Abstract
Background:
This study evaluated the diagnostic capability of on-site coronary computed tomography-derived computational fractional flow reserve (CT-FFR) determinations for detecting coronary artery disease (CAD), as assessed by invasive fractional flow reserve (FFR).
Methods and Results:
Seventy-four patients with coronary artery calcium scores <1,500 who underwent coronary CT angiography (CTA) and invasive FFR measurements within 90 days were retrospectively reviewed. CT-FFR was computed using a prototype machine-learning (ML) algorithm in 91 vessels; 47 vessels of 42 patients were determined to have significant CAD (FFR ≤0.8). Correlation between CT-FFR and FFR was good (r=0.786, P<0.001). Per-vessel area under the curve was significantly larger for CT-FFR (0.907, 95% confidence interval: 0.828–0.958) than for CTA stenosis ≥50% (0.595, 0.487–0.697) or ≥70% (0.603, 0.495–0.705) (both P<0.001). Standard coronary CTA classifications recommended further functional tests in 57 patients with moderate or worse stenosis on CTA. CT-FFR analysis (mean analysis time: 16.4±7.5 min) corrected the standard coronary CTA classification in 18 of 74 patients and confirmed it in 45 of 74 patients. Thus, the per-patient diagnostic accuracy of the classifications was improved from 66% (54–77%) to 85% (75–92%).
Conclusions:
On-site CT-FFR based on a ML algorithm can provide good diagnostic performance for detecting hemodynamically significant CAD, suggesting the high value of coronary CTA for selected patients in clinical practice.
With rapid technological advances in multidetector row computed tomography (CT), coronary CT angiography (CTA) is widely used in clinical practice as a reliable diagnostic tool for patients with stable coronary artery disease (CAD).1,2
Coronary CTA is highly effective for ruling out CAD, with a high negative predictive value (NPV). However, when stenosis severity is assessed using coronary CTA, it does not always correlate with the severity of myocardial ischemia,3
and current guidelines recommend further cardiac investigations in addition to coronary CTA for moderate or worse coronary artery stenosis.4
Fractional flow reserve (FFR) has been established as an invasive standard reference for the assessment of myocardial ischemia.5,6
When lesion-specific ischemia is assessed by FFR during invasive coronary angiography (ICA), the findings have a great impact on the practical management of patients with CAD, by assisting decision-making and procedural planning for revascularization therapy.7,8
Coronary CTA-derived computational FFR (CT-FFR) determination is a new diagnostic method that uses information obtained from the resting coronary CTA dataset and computational flow dynamics (CFD).9
Previous studies have shown that CT-FFR has good correlation with invasively measured FFR and improves the diagnostic differentiation between hemodynamically significant CAD and coronary CTA alone, using either a remote service10–12
or on-site software.13–15
Recently, machine-learning (ML)-based CT-FFR applications have been developed.16
Single- and multicenter trials have reported the diagnostic performance of ML-based CT-FFR simulations for detecting hemodynamically significant CAD.17–19
However, the clinical value of on-site ML-based CT-FFR has not been fully investigated. Thus, this study compared the clinical and decision-making value of on-site ML-based CT-FFR with conventional CTA for managing patients with hemodynamically significant CAD. CT-FFR was also compared with invasively measured FFR as a reference standard for myocardial ischemia.
Methods
Study Population
This study was approved as a retrospective multicenter observational study by the review board of each institution, and the need for informed consent was waived. The inclusion criteria included (1) age of ≥20 years, (2) maximum interval of 90 days between coronary CTA and invasive FFR measurement, and (3) adequate image quality of coronary CTA. The exclusion criteria included (1) patient refusal to participate, (2) arrhythmia inappropriate for ECG-triggering data acquisition for coronary CTA, (3) poor image quality on coronary CTA (artifact, calcification, and misregistration) for CT-FFR analysis, (4) coronary artery calcium (CAC) Agatston score ≥1,500, (5) prior revascularization, (6) myocardial infarction (MI) (based on clinical information, ECG, echocardiography, and tissue characterization of myocardium using the coronary CTA dataset), (7) total coronary artery occlusion, (8) coronary anomalies (aneurysm or dissection), (9) presence of collateral flow, (10) small-vessel disease and severe, diffuse stenosis (<1.5 mm), (11) low cardiac function (left ventricular [LV] ejection fraction <30%), (12) heart valve disease (moderate or severe aortic stenosis and regurgitation), (13) cardiomyopathy, (14) decompensated congestive heart failure, (15) implanted intracardiac metallic device (pacemaker, implantable cardioverter defibrillator, prosthetic valve, and sternal clip) and history of cardiovascular surgery, and (16) major cardiovascular event (MI, worsening angina, and hospitalization for heart disease or stoke) during the study period.
Coronary CTA
Two dual-source CT scanners (SOMATOM Force or SOMATOM Definition Flash, Siemens Healthineers, Forchheim, Germany) were used according to the institutional scan protocol. First, a CAC score scan was performed using a prospective ECG-triggering axial scan mode (tube voltage, 120 kV; tube current time product, 80 mA/rotation for a 70-kg body weight as a reference, 3-mm slice thickness). Sublingual nitroglycerin (0.6 mg, Myocor; Astellas Pharma, Tokyo, Japan) was used before the coronary CTA examination, but no additional β-blockers or other heart rate-modifying medication were administered. Coronary CTA was performed using a retrospective ECG-triggering spiral scan mode or prospective ECG-triggering axial scan mode according to the scan heart rate. The scan parameters were as follows: gantry rotation time of 0.25 s/rotation (force), 0.28 s/rotation (definition flash); 90-, 100- or 120-kV tube voltage; 2×192×0.6 mm (force) or 2×128×0.6 mm (definition flash) detector collimation with z-flying focal spot; tube current 228 (145–292) mA per rotation with X-ray tube modulation that depended on patient size, variable pitch, and heart rate. Contrast material (iopamidol, 370 mg iodine/mL; Bayer Yakuhin, Osaka, Japan) was intravenously administered for 15 s (40–60 mL), followed by a 20-mL saline chaser. The scan timing was optimized using bolus tracking or timing bolus scan according to the institution’s scan protocol.
The CAC Agatston score was evaluated using semi-automated software (“CaScoring”, Siemens Healthcare). For coronary CTA, the CT datasets were reconstructed from the cardiac phase with the fewest artifacts, using a 0.75- or 0.6-mm slice thickness, a 0.4-mm reconstruction increment, sonogram-affirmed iterative reconstruction (strength level 3) or advanced modeled iterative reconstruction (strength level 2), and a vascular convolution algorithm (I36f, I26f, or Bv40). The effective radiation dose for coronary CTA was estimated using a dose length product (mGy×cm) with a conversion coefficient (0.014 mSv×mGy−1×cm−1).
Two radiologists (both with 8 years’ experience in cardiac imaging) independently assessed the overall CT image quality and coronary stenosis severity in a blinded fashion (no access to clinical results and other information). Overall CT image quality at the patient level was judged on a 4-point Likert scale: (1) poor image quality: evaluation of the coronary arteries and lumens not possible because of factors known to have adverse effects, including heart rate, motion artifact, CAC, misregistration, and image noise; (2) reduced image quality: with differentiation of coronary artery lumen but with reduced confidence; (3) average: presence of any artifacts, but full assessment of the coronary artery lumen is possible, and (4) good image quality: clear delineation of vessel lumen with complete absence of artifacts. When images of any segments on coronary CTA were of poor quality, the patients were excluded from the study. Coronary artery stenosis per-vessel was graded as: none (0% luminal stenosis), minimal (1–24%), mild (25–49%), moderate (50–69%), and severe (70–99%), according to the standard Coronary Artery Disease Reporting and Data System (CAD-RADSTM
classification).4
A per-patient classification was applied to the vessel with the maximum coronary artery stenosis severity among 3 vessels. The interobserver variance was assessed using 37 randomly selected coronary lesions (34 patients). Discrepancies in CT image quality and coronary artery stenosis were solved by consensus with a third senior radiologist with 9 years’ experience in cardiac imaging.
ICA and FFR
ICA was performed using 6- or 7-Fr coronary catheters. Isosorbide dinitrate was given via catheter before angiography and FFR measurements. Invasive FFR measurements were performed by 3 experienced interventional cardiologists for clinical indications to assess whether the CAD lesions were causing hemodynamically relevant myocardial ischemia. An FFR pressure wire (Verrata, Phillips, MA, USA, or AERIS, Abbott, CA, USA) was placed distal to the stenosis of interest. The invasive FFR was measured during hyperemia induced by intravenous infusion of adenosine triphosphate at a rate of 0.14–0.16 μg·kg−1·min−1
via the forearm or femoral vein as previously reported.14
An FFR ≤0.80 was considered as hemodynamically significant CAD.
For the anatomic locations of the CT-FFR measurements, 3 experienced cardiologists, who were blinded to other functional tests and coronary CTA stenosis severity, transferred the corresponding landmarks for invasive FFR sample locations to the volume-rendered images of coronary CTA with reference to the FFR wire on the fluoroscopic images.
CT-FFR Analysis
CT-FFR calculations were performed on the coronary CTA datasets using prototype research software (cFFR version 3.0.0, Siemens Healthcare) that uses artificial intelligence (AI) ML.16
During CT-FFR preparation, a 3D anatomic model of the coronary arteries (luminal model) was semi-automatically created from the coronary CTA dataset by tracing the coronary artery centerline and lumen. The anatomic positions of the coronary stenoses were defined for the CT-FFR computation and then the LV mass was defined using a threshold value from the attenuation of the LV myocardium. The CT-FFR computation provided a coronary tree of color-coded CT-FFR values, with red representing CT-FFR values ≤0.80.
Two experienced radiologists (with 4 and 16 years’, respectively, experience in cardiac imaging), who were blinded to other results, performed the CT-FFR analysis. First, they were involved in a pilot study to assess the interobserver variance for CT-FFR calculations for 20 independently selected patients who were not included in the study population. Next, they carefully prepared for the process of CT-FFR calculation by setting the coronary artery centerline and lumen according to the anatomic positions of the stenosis in a semi-automated manner. The window settings (Hounsfield units, HU) were adjusted per-patient and fixed up to the completion of the 3D coronary artery model (window level; 187 HU, 173–193 HU; window width 868 HU, 778–967 HU). To obtain the lesion-specific CT-FFR results, a third observer (with 15 years’ experience in cardiac imaging) deployed the sample points to the color-coded CT-FFR trees and obtained the CT-FFR values, according to the landmark images previously described.13
Processing time for editing the centerline and the lumen of the coronary arteries and the calculation time for the virtual FFR simulation were measured and added to determine the total processing time.
Statistical Analysis
Categorical variables are expressed as proportions and continuous variables are expressed as mean±standard deviation or median (interquartile range), as appropriate. The interobserver variabilities were calculated using a weighted kappa statistic and interclass correlation coefficient. Correlation and differences between CTA-FFR and invasive FFR were evaluated with the Spearman’s test and the Bland-Altman test.
Coronary CTA was assessed using both a threshold of 50% and 70% luminal stenosis. A cutoff value ≤0.80 was regarded as hemodynamically significant for both CT-FFR and invasive FFR. On a per-vessel basis, the diagnostic performance of anatomic coronary CTA assessments (≥50% and ≥70% luminal stenosis) and CT-FFR (≤0.80) to detect vessels with invasive FFR ≤0.80 is reported as sensitivity, specificity, positive and negative predictive values (PPVs and NPVs), and accuracy, with their 95% confidence intervals (CIs). Sensitivity and specificity were compared using the McNemar test with Bonferroni correction.20
Diagnostic accuracy was compared using the area under the curve (AUC) of the receiver-operating characteristic curve analysis. The AUCs were compared using the method described by DeLong et al.21
On a per-patient basis, patients with at least 1 diseased vessel confirmed by invasive FFR were classified as disease positive and those without any diseased vessels were classified as disease negative. Similar analyses were conducted regarding diagnostic performance and the AUC analysis.
To investigate the clinical value of CT-FFR compared with conventional anatomic CTA-based diagnosis and recommendations (CAD-RADTM
classification) for the indication of patients requiring further evaluation for CAD caused by moderate stenosis or worse stenosis, patients were classified into 3 groups: (1) patients in whom CT-FFR corrected the CTA-based recommendations, (2) patients in whom CT-FFR supported the CTA-based recommendations, and (3) patients in whom CT-FFR evaluation was not effective for the CTA-based recommendations. Subgroups stratified by anatomic CTA stenosis (<50%, 50–69%, and ≥70%) were compared using Fisher’s exact test.
All analyses were performed using statistical software (SPSS version 20.0, IBM, Armonk, NY, USA; MedCalc version 17.9.7, Ostend, Belgium). A 2-tailed P-value <0.05 was deemed significant.
Results
Study Population
Figure 1
is a flowchart of patient selection. Initially, 206 patients were collected from collaborating facilities using the inclusion criteria. Of them, data for 128 patients were excluded for various reasons related to patient factors, including the ruling out of invasive FFR assessment, CT image quality factors, and CT-FFR analysis-related factors. In this study, regardless of the target or non-target lesions for CT-FFR analysis, 50 patients with poor image quality coronary CTA (artifact, n=5; calcification, n=24; compound reasons, n=21) and 41 patients with a history of MI or revascularization were excluded. Finally, 74 patients with known CAD or suspected of CAD (56 males; mean age, 70.2±10.3 years) were eligible for analysis. Patients’ characteristics are shown in
Table 1. No major cardiovascular events were seen during the study period, which was a median of 31 days (17–47 days) between coronary CTA and invasive FFR measurement. A total of 91 vessels were investigated using a pressure wire. The overall median invasive FFR was 0.80 (0.72–0.86), and 47 vessels (52%) were diagnosed with hemodynamically significant stenosis (FFR ≤0.8). Thus, 42 patients (57%) were deemed to have hemodynamically significant stenosis.
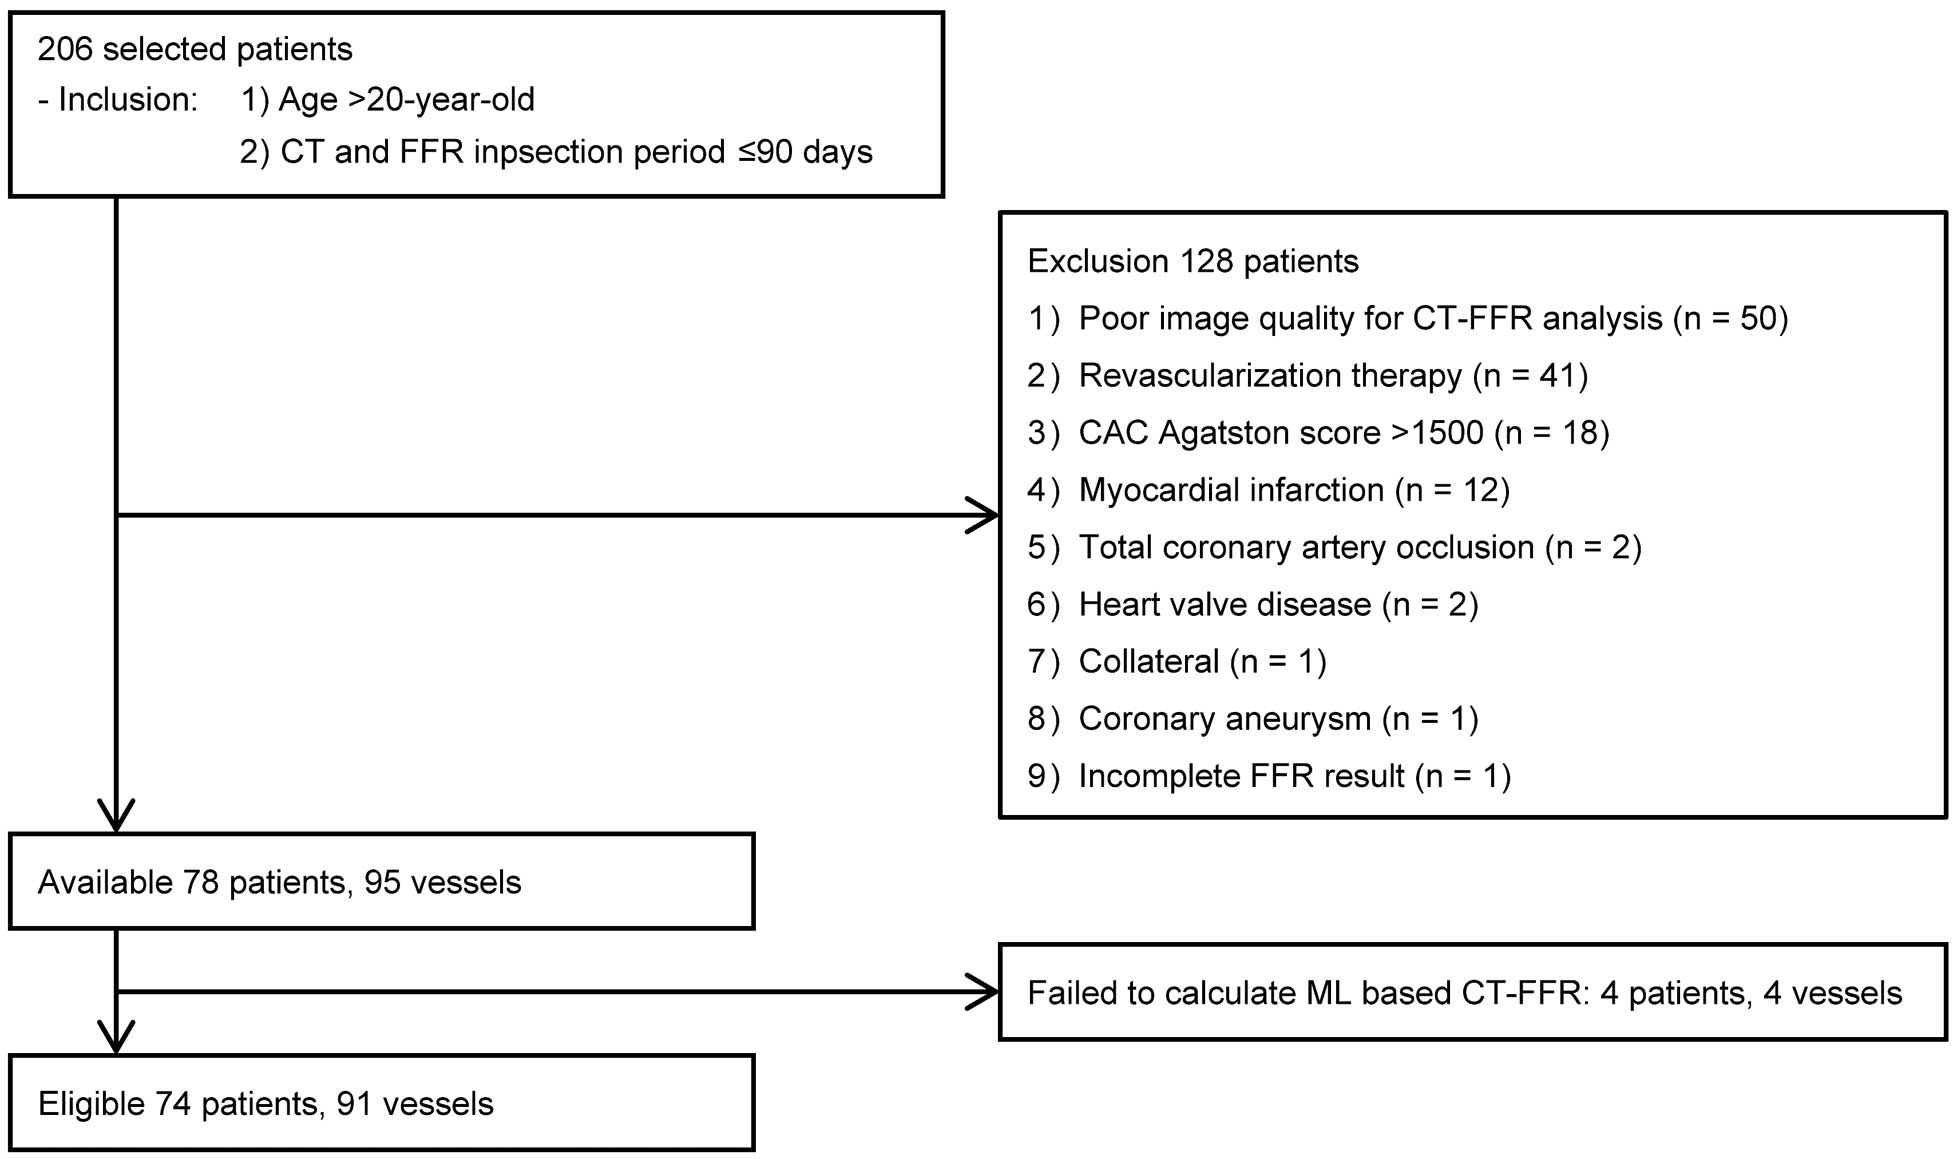
Table 1.
Patients Characteristics
| |
n=74 |
| Age (years) |
70.2±10.3 |
| Male/female |
56 (76)/18 (24) |
| Chest symptoms |
57 (77) |
| Coronary risk factors |
| Hypertension |
57 (77) |
| Hyperlipidemia |
40 (54) |
| Diabetes mellitus |
28 (38) |
| Smoking |
23 (31) |
| Family history of CAD |
11 (15) |
| CT and FFR inspection period (days) |
31 (17–47) |
| CAC Agatston score |
180 (58–510) |
Data are presented as n (%), mean±standard deviation or median (interquantile range), unless otherwise stated. CAC, coronary artery calcium; CAD, coronary artery disease; CT, computed tomography; FFR, fractional flow reserve.
The median scan heart rate during coronary CTA was 59 (56–67) beats/min. The median CAC Agatston score was 180 (58–510). The median total radiation dose was 7.4 mSv (5.7–11.2 mSv), by summing the CAC score scan and coronary CTA.
Regarding the interobserver variability, the weighted interobserver kappa score was 0.740 (95% CI, 0.601–0.880) for CT image quality and 0.692 (95% CI, 0.414–0.97) for coronary CTA stenosis. The reproducibility was satisfactory. Median CT image quality on a per-patient basis was 3 (2–4). Of the 91 vessels, coronary CTA depicted 2 minimal stenosis, 18 mild stenoses, 53 moderate stenoses, and 18 severe stenoses. Thus, there were 17 patients with mild stenosis or less, 40 patients with moderate stenosis, and 17 patients with severe stenosis.
CT-FFR
For CT-FFR analysis, the mean analysis time per-patient was 16.4±7.5 min (sum of preparation for the 3D coronary artery anatomic model [16.2±7.4 min] and the CT-FFR calculation [16.3±9.9 s]). The overall median CT-FFR was 0.80 (0.68–0.86), and hemodynamically significant stenosis on CT-FFR (≤0.8) was present in 53 vessels (58%) in 45 patients (61%).
Correlation between ML-based CT-FFR and invasive FFR was moderate (P<0.001, r=0.786;
Figure 2A), with a lower mean outcome for CT-FFR compared with invasive FFR of -0.03±0.10 (Figure 2B).
Diagnostic Performance of CT-FFR and Coronary CTA
The diagnostic characteristics of coronary CTA and CT-FFR are shown in
Table 2. On a per-vessel basis, for detecting hemodynamically significant CAD (FFR ≤0.8), sensitivities of CTA stenosis ≥50% (87%; 95% CI, 74–95%) and CT-FFR ≤0.80 (89%; 95% CI, 77–96%) were higher than that of CTA stenosis ≥70% (30%; 95% CI, 17–45%) (all P<0.05). Specificity of CTA stenosis ≥70% (91%; 95% CI, 78–98%) and CT-FFR ≤0.80 (75%; 95% CI, 60–87%) were higher than that of CTA stenosis ≥50% (34%; 95% CI, 21–50%) (P<0.05, for each). The AUC to differentiate hemodynamically significant CAD with CT-FFR ≤0.80 (0.907; 95% CI, 0.828–0.958) was greater than those of CTA stenosis ≥50% (0.595; 95% CI, 0.487–0.697) or ≥70% (0.603; 95% CI, 0.495–0.705) (all P<0.001).
Table 2.
Diagnostic Performance of Coronary CTA and CT-FFR on the Per-Vessel and Per-Patient Levels
| |
Sensitivity, % |
Specificity, % |
PPV, % |
NPV, % |
Accuracy, % |
| All vessels (n=91) |
| CTA stenosis ≥50% |
41/47, 87 [74–95] |
14/44, 31 [19–48] |
41/71, 58 [52–63] |
14/20, 70 [50–85] |
55/91, 60 [50–71] |
| CTA stenosis ≥70% |
14/47, 30 [17–45] |
40/44, 91 [78–97] |
14/18, 78 [56–91] |
40/73, 55 [50–60] |
54/91, 59 [49–70] |
| CT-FFR ≤0.8 |
42/47, 89 [77–96] |
33/44, 75 [60–87] |
42/53, 79 [69–87] |
33/38, 87 [74–94] |
75/91, 82 [73–90] |
| All patients (n=74) |
| CTA stenosis ≥50% |
37/42, 88 [74–96] |
12/32, 38 [21–56] |
37/57, 65 [58–71] |
12/17, 71 [48–86] |
49/74, 66 [54–77] |
| CTA stenosis ≥70% |
14/42, 33 [20–50] |
29/32, 91 [75–98] |
14/17, 82 [59–94] |
29/57, 51 [45–57] |
43/74, 58 [46–69] |
| CT-FFR ≤0.8 |
38/42, 90 [77–97] |
25/32, 78 [60–91] |
38/45, 84 [74–91] |
25/29, 86 [71–94] |
63/74, 85 [75–92] |
Data are expressed as n/N, %, and 95% confidence interval, unless otherwise stated. Diagnostic characteristics were assessed for detecting coronary lesions with invasive FFR ≤0.80 as reference. CTA, computed tomography angiography; CT-FFR, computed tomography-derived fractional flow reserve; PPV, positive predictive value; NPV, negative predictive value.
On a per-patient basis, sensitivity improved from 33% (95% CI, 20–50%) by CTA stenosis ≥70% to 91% (95% CI, 77–97%) by CT-FFR (P<0.05), and specificity also improved from 38% (95% CI, 24–59%) by CTA stenosis ≥50% to 78% (95% CI, 60–91%) by CT-FFR (P<0.05). The AUC of CT-FFR (0.913; 95% CI, 0.825–0.966) was significantly greater than that of CTA stenosis ≥50% (0.628; 95% CI, 0.508–0.738) or ≥70% (0.620; 95% CI, 0.499–0.730) (both P<0.001).
Regarding the clinical value of on-site ML-based CT-FFR, we evaluated the effectiveness of CT-FFR for standard CTA-based diagnosis and recommendations. According to the CAD-RADSTM
classification, further functional tests or ICA was indicated in 57 patients with moderate stenosis or worse, and risk factor modification was indicated in 17 patients with mild stenosis or better. However, additional assessment with CT-FFR corrected the CAD-RADTM
classification in 18 patients and supported the decision-making in 45 patients (Figures 3,4) or risk factor modification. It did not provide effective information in 11 patients (Figure 5). No significant difference in the effectiveness of CT-FFR was seen among subgroups stratified by coronary CTA stenosis severity (P=0.279992) (Table 3).


Table 3.
Effectiveness of CT-FFR to Coronary CTA-Based Decision-Making
| |
CT-FFR corrected
CTA-based
decisions (a) |
CT-FFR supported
CTA-based
decisions (b) |
CT-FFR ineffective
to CTA-based
decisions (c) |
Effectiveness, %
(a+b) / (a+b+c) |
| <50% CTA stenosis (n=17) |
4 |
11 |
2 |
15/17 (88%) |
| 50–69% CTA stenosis (n=40) |
12 |
20 |
8 |
32/40 (80%) |
| ≥70% CTA stenosis (n=17) |
2 |
14 |
1 |
16/17 (94%) |
| Total |
18 |
45 |
11 |
63/74 (85%) |
Abbreviations as in Table 2.
Discussion
The main findings of this study were: (1) the prototype on-site ML-based CT-FFR computation showed good correlation with invasively measured FFR, (2) CT-FFR had high diagnostic performance for the detection of hemodynamically significant CAD on a per-vessel and per-patient basis, and (3) on-site ML-based CT-FFR analysis increased the value of coronary CTA with a short processing time.
Based on numerous studies and technological developments, clinical use of coronary CTA has developed from appropriate use criteria to standard guidelines for coronary CTA reporting and recommendations. Meanwhile, because of the relatively low specificity and PPV of semiquantitative coronary CTA assessment, functional assessment is often required to further evaluate the patient.22
In current clinical practice, non-invasive myocardial perfusion imaging and invasive FFR measurement have been used for assessing the indication of revascularization therapy and for prediction of various outcomes.23–27
However, the additional cost, associated radiation exposure, and diagnostic throughput hamper their use in current practice.
CT-FFR has rapidly established as a new method, with multicenter trials showing that it has good diagnostic capability for detecting hemodynamically significant CAD and providing incremental value with respect to diagnosis, controlling clinical costs, and predicting outcomes.10–12,28–30
The Heartflow CFD-based FFR software works using AI with algorithm-based, fully-automated 3D coronary luminal modeling and CFD-based FFR calculations. Nevertheless, because these studies utilized a remote analysis service for CT-FFR computations, clinical application of CT-FFR might not have been fully maximized. The currently available work-in-progress on-site CT-FFR software works on a regular workstation using semi-automated 3D coronary artery modeling and 1 of the following algorithms: (1) the reduced-order CFD-based FFR calculations;13,14
(2) CFD-based FFR calculations with an AI algorithm,15
or (3) ML-based CT-FFR calculations.17–19
The most recently developed on-site ML-based CT-FFR algorithm was developed using a deep learning model to integrate the complex relationship between various anatomic features and the CFD-based FFR results as the ground truth from a synthetically generated database of 12,000 coronary artery models. The ML-based CT-FFR software extracts 28 anatomic input features and calculates the CT-FFR results.16
It allows for the quantification of ischemic severity through color-coding of the coronary artery tree for all the analyzed coronary arteries, with greatly shortened CT-FFR calculation time. Single- and multicenter trials have shown comparable diagnostic performance and incremental values for the method in comparison with CFD-based CT-FFR.10–15,17–19
The present study also showed that the on-site ML-based CT-FFR had a high diagnostic capability for detecting hemodynamically significant CAD using a local workstation, and it could immediately provide seamless and effective diagnostic information after standard coronary CTA assessment. Although the CT-FFR analysis was carefully performed by 2 relatively experienced operators independent of the time-cost study, per-patient total processing time (16.4±7.5 min) was clinically reasonable compared with previous studies.13–15,19
Additional assessment of CT-FFR identified 4 patients (25%) with hemodynamically significant CAD out of 17 patients with mild stenosis or less on CTA, and ruled out 14 patients (25%) without hemodynamically significant CAD out of 57 patients with moderate or severe stenosis on CTA. Although we thought that clinical effectiveness of CT-FFR analysis compared with standard coronary CTA assessment might vary among subgroups stratified by stenosis severity on coronary CTA, the present results did not show a statistically significant difference.
The pros and cons of clinical application of on-site CT-FFR are currently being discussed. The positive viewpoint suggests that on-site CT-FFR can provide timeliness in clinical practice and promote understanding of the importance of high-quality coronary CTA, and the underlying algorithm and requirements for CT-FFR computations, including the accurate 3D coronary model. The negative viewpoint suggests that CT-FFR may be used incorrectly. Because of the semi-automated post-processing involved in the CT-FFR analysis, such as centerline and coronary lumen tracing, a training period would be required.
Study Limitations
First, the study population was retrospectively assessed and was limited to patients with good-quality coronary CTA imaging and this excluded a large number of candidates (24%, 50 of 206 cases for poor image quality) from this study, for accurate 3D coronary artery modeling. Thus, for more complex cases, the results may not always be clear as in this study. Second, conventional coronary CTAs were evaluated using the most severe lesions. More dedicated or cumulative assessments corresponding to the landmarks of invasive FFR sample locations might be necessary. Third, the indications for invasive FFR measurement were clinically determined by attending physicians, and therefore, selection bias may have affected the results. Application of the present results to extremely minimal or severe CTA stenosis, as well as more complex cases with massive calcified lesions, should be performed with caution. Fourth, the present study population was not prescribed additional β-blockers to reduce scanned heart rates. Fifth, cases of MI were clinically excluded. Because the CT-FFR calculation assumes the LV volume obtained from CT as the mass of normal LV myocardium, unrecognized or subendocardial MI might result in a mismatch between the CT-FFR computation and invasive FFR measurement. Thus, both image quality and the various potential factors affecting CT-FFR will require further evaluation.31
Sixth, on-site CT-FFR analysis requires objectivity and independence. It is desirable that a well-trained single operator can perform standard coronary CTA evaluation and CT-FFR preparation comprising the generation of 3D coronary artery model and color-encoding with CT-FFR values by the CT-FFR calculation. Additionally, the deployment of the sample point should be standardized according to invasive FFR or other evidence-based basis (2–3 cm or 4 cm distal to the stenosis),32,33
blinded to all other patient information except for point-of-care diagnosis. Seventh, ML-based CT-FFR results were not able to be calculated in a small number of patients (5% of the analysis). The possible reasons were investigated by the vendor scientific research group and will be used to improve the present work-in-progress software. Lastly, this study focused on diagnosis, but larger multicenter trials of on-site CT-FFR that investigate interventions to therapeutic strategies, and prognosis are required.34,35
Conclusions
In conclusion, CT-FFR can be assessed using an on-site workstation. ML-based CT-FFR analysis can provide good diagnostic performance for detecting hemodynamically significant CAD during clinically relevant analysis time. Diagnostic factors and various outcomes should be assessed in further clinical investigations.
Acknowledgments
The authors appreciate the invaluable support given by Noriharu Yamamoto (Siemens Healthcare, Japan) and Shinya Kuroki (Siemens Healthcare, Japan) to the present research.
Disclosures
The authors declare no conflicts of interests. No funding was received for this research.
References
- 1.
Yamagishi M, Tamaki N, Akasaka T, Ikeda T, Uemura S, Otsuji Y, et al. JCS 2018 guideline on diagnosis of chronic coronary heart diseases (in Japanese). http://www.j-circ.or.jp/guideline/pdf/JCS2018_yamagishi_tamaki.pdf (accessed March 2019).
- 2.
Wolk MJ, Bailey SR, Doherty JU, Douglas PS, Hendel RC, Kramer CM, et al. ACCF/AHA/ASE/ASNC/HFSA/HRS/SCAI/SCCT/SCMR/STS 2013 multimodality appropriate use criteria for the detection and risk assessment of stable ischemic heart disease: A report of the American College of Cardiology Foundation Appropriate Use Criteria Task Force, American Heart Association, American Society of Echocardiography, American Society of Nuclear Cardiology, Heart Failure Society of America, Heart Rhythm Society, Society for Cardiovascular Angiography and Interventions, Society of Cardiovascular Computed Tomography, Society for Cardiovascular Magnetic Resonance, and Society of Thoracic Surgeons. J Am Coll Cardiol 2014; 63: 380–406.
- 3.
Di Carli MF, Murthy VL. Cardiac PET/CT for the evaluation of known or suspected coronary artery disease. Radiographics 2011; 31: 1239–1254.
- 4.
Cury RC, Abbara S, Achenbach S, Agatston A, Berman DS, Budoff MJ, et al. CAD-RADS(TM) Coronary Artery Disease: Reporting and Data System. An expert consensus document of the Society of Cardiovascular Computed Tomography (SCCT), the American College of Radiology (ACR) and the North American Society for Cardiovascular Imaging (NASCI). Endorsed by the American College of Cardiology. J Cardiovasc Comput Tomogr 2016; 10: 269–281.
- 5.
Pijls NH, De Bruyne B, Peels K, Van Der Voort PH, Bonnier HJ, Bartunek J, et al. Measurement of fractional flow reserve to assess the functional severity of coronary-artery stenoses. N Engl J Med 1996; 334: 1703–1708.
- 6.
De Bruyne B, Pijls NH, Heyndrickx GR, Hodeige D, Kirkeeide R, Gould KL. Pressure-derived fractional flow reserve to assess serial epicardial stenoses: Theoretical basis and animal validation. Circulation 2000; 101: 1840–1847.
- 7.
Tonino PA, De Bruyne B, Pijls NH, Siebert U, Ikeno F, van’t Veer M, et al. Fractional flow reserve versus angiography for guiding percutaneous coronary intervention. N Engl J Med 2009; 360: 213–224.
- 8.
Pijls NH, van Schaardenburgh P, Manoharan G, Boersma E, Bech JW, van’t Veer M, et al. Percutaneous coronary intervention of functionally nonsignificant stenosis: 5-year follow-up of the DEFER Study. J Am Coll Cardiol 2007; 49: 2105–2111.
- 9.
Taylor CA, Fonte TA, Min JK. Computational fluid dynamics applied to cardiac computed tomography for noninvasive quantification of fractional flow reserve: Scientific basis. J Am Coll Cardiol 2013; 61: 2233–2241.
- 10.
Koo BK, Erglis A, Doh JH, Daniels DV, Jegere S, Kim HS, et al. Diagnosis of ischemia-causing coronary stenoses by noninvasive fractional flow reserve computed from coronary computed tomographic angiograms: Results from the prospective multicenter DISCOVER-FLOW (Diagnosis of Ischemia-Causing Stenoses Obtained Via Noninvasive Fractional Flow Reserve) study. J Am Coll Cardiol 2011; 58: 1989–1997.
- 11.
Min JK, Leipsic J, Pencina MJ, Berman DS, Koo BK, van Mieghem C, et al. Diagnostic accuracy of fractional flow reserve from anatomic CT angiography. JAMA 2012; 308: 1237–1245.
- 12.
Nørgaard BL, Leipsic J, Gaur S, Seneviratne S, Ko BS, Ito H, et al. Diagnostic performance of noninvasive fractional flow reserve derived from coronary computed tomography angiography in suspected coronary artery disease: The NXT trial (Analysis of Coronary Blood Flow Using CT Angiography: Next Steps). J Am Coll Cardiol 2014; 63: 1145–1155.
- 13.
Coenen A, Lubbers MM, Kurata A, Kono A, Dedic A, Chelu RG, et al. Fractional flow reserve computed from noninvasive CT angiography data: Diagnostic performance of an on-site clinician-operated computational fluid dynamics algorithm. Radiology 2015; 274: 674–683.
- 14.
Fujimoto S, Kawasaki T, Kumamaru KK, Kawaguchi Y, Dohi T, Okonogi T, et al. Diagnostic performance of on-site computed CT-fractional flow reserve based on fluid structure interactions: Comparison with invasive fractional flow reserve and instantaneous wave-free ratio. Eur Heart J Cardiovasc Imaging 2018; 20: 343–352.
- 15.
Donnelly PM, Kolossváry M, Karády J, Ball PA, Kelly S, Fitzsimons D, et al. Experience with an on-site coronary computed tomography-derived fractional flow reserve algorithm for the assessment of intermediate coronary stenoses. Am J Cardiol 2018; 121: 9–13.
- 16.
Itu L, Rapaka S, Passerini T, Georgescu B, Schwemmer C, Schoebinger M, et al. A machine-learning approach for computation of fractional flow reserve from coronary computed tomography. J Appl Physiol (1985) 2016; 121: 42–52.
- 17.
Tesche C, Vliegenthart R, Duguay TM, De Cecco CN, Albrecht MH, De Santis D, et al. Coronary computed tomographic angiography-derived fractional flow reserve for therapeutic decision making. Am J Cardiol 2017; 120: 2121–2127.
- 18.
Coenen A, Kim YH, Kruk M, Tesche C, De Geer J, Kurata A, et al. Diagnostic accuracy of a machine-learning approach to coronary computed tomographic angiography-based fractional flow reserve: Result from the MACHINE consortium. Circ Cardiovasc Imaging 2018; 11: e007217.
- 19.
Hu X, Yang M, Han L, Du Y. Diagnostic performance of machine-learning-based computed fractional flow reserve (FFR) derived from coronary computed tomography angiography for the assessment of myocardial ischemia verified by invasive FFR. Int J Cardiovasc Imaging 2018; 34: 1987–1996.
- 20.
Trajman A, Luiz RR. McNemar Xi2 test revisited: Comparing sensitivity and specificity of diagnostic examinations. Scand J Clin Lab Invest 2008; 68: 77–80.
- 21.
DeLong ER, DeLong DM, Clarke-Pearson DL. Comparing the areas under two or more correlated receiver operating characteristic curves: A nonparametric approach. Biometrics 1988; 44: 837–845.
- 22.
Meijboom WB, Van Mieghem CA, van Pelt N, Weustink A, Pugliese F, Mollet NR, et al. Comprehensive assessment of coronary artery stenoses: Computed tomography coronary angiography versus conventional coronary angiography and correlation with fractional flow reserve in patients with stable angina. J Am Coll Cardiol 2008; 52: 636–643.
- 23.
Hachamovitch R, Hayes SW, Friedman JD, Cohen I, Berman DS. Comparison of the short-term survival benefit associated with revascularization compared with medical therapy in patients with no prior coronary artery disease undergoing stress myocardial perfusion single photon emission computed tomography. Circulation 2003; 107: 2900–2907.
- 24.
Nakajima K, Matsuo S, Okuda K, Wakabayashi H, Tsukamoto K, Nishimura T. Estimation of cardiac event risk by gated myocardial perfusion imaging and quantitative scoring methods based on a multi-center J-ACCESS database. Circ J 2011; 75: 2417–2423.
- 25.
Greenwood JP, Maredia N, Younger JF, Brown JM, Nixon J, Everett CC, et al. Cardiovascular magnetic resonance and single-photon emission computed tomography for diagnosis of coronary heart disease (CE-MARC): A prospective trial. Lancet 2012; 379: 453–460.
- 26.
Rochitte CE, George RT, Chen MY, Arbab-Zadeh A, Dewey M, Miller JM, et al. Computed tomography angiography and perfusion to assess coronary artery stenosis causing perfusion defects by single photon emission computed tomography: The CORE320 study. Eur Heart J 2014; 35: 1120–1130.
- 27.
Shiono Y, Kubo T, Tanaka A, Ino Y, Yamaguchi T, Tanimoto T, et al. Long-term outcome after deferral of revascularization in patients with intermediate coronary stenosis and gray-zone fractional flow reserve. Circ J 2015; 79: 91–95.
- 28.
Miyoshi T, Osawa K, Ito H, Kanazawa S, Kimura T, Shiomi H, et al. Non-invasive computed fractional flow reserve from computed tomography (CT) for diagnosing coronary artery disease: Japanese results from NXT trial (Analysis of Coronary Blood Flow Using CT Angiography: Next Steps). Circ J 2015; 79: 406–412.
- 29.
Hlatky MA, Saxena A, Koo BK, Erglis A, Zarins CK, Min JK. Projected costs and consequences of computed tomography-determined fractional flow reserve. Clin Cardiol 2013; 36: 743–748.
- 30.
Kimura T, Shiomi H, Kuribayashi S, Isshiki T, Kanazawa S, Ito H, et al. Cost analysis of non-invasive fractional flow reserve derived from coronary computed tomographic angiography in Japan. Cardiovasc Interv Ther 2015; 30: 38–44.
- 31.
Coenen A, Lubbers MM, Kurata A, Kono A, Dedic A, Chelu RG, et al. Coronary CT angiography derived fractional flow reserve: Methodology and evaluation of a point of care algorithm. J Cardiovasc Comput Tomogr 2016; 10: 105–113.
- 32.
Toth GG, Johnson NP, Jeremias A, Pellicano M, Vranckx P, Fearon WF, et al. Standardization of fractional flow reserve measurements. J Am Coll Cardiol 2016; 68: 742–753.
- 33.
Solecki M, Kruk M, Demkow M, Schoepf UJ, Reynolds MA, Wardziak Ł, et al. What is the optimal anatomic location for coronary artery pressure measurement at CT-derived FFR? J Cardiovasc Comput Tomogr 2017; 11: 397–403.
- 34.
Duguay TM, Tesche C, Vliegenthart R, De Cecco CN, Lin H, Albrecht MH, et al. Coronary computed tomographic angiography-derived fractional flow reserve based on machine learning for risk stratification of non-culprit coronary narrowings in patients with acute coronary syndrome. Am J Cardiol 2017; 120: 1260–1266.
- 35.
Fairbairn TA, Nieman K, Akasaka T, Nørgaard BL, Berman DS, Raff G, et al. Real-world clinical utility and impact on clinical decision-making of coronary computed tomography angiography-derived fractional flow reserve: Lessons from the ADVANCE Registry. Eur Heart J 2018; 39: 3701–3711.

