Abstract
Background:
The purpose of this study was to investigate if the transcatheter aortic valve replacement (TAVR) risk score can independently predict outcomes following TAVR, and to evaluate its predictive performance.
Methods and Results:
This retrospective multicenter study comprised 682 patients with severe aortic stenosis who underwent TAVR. The primary endpoint was all-cause death following TAVR. The clinical model was established using variables identified as independent predictors in the multivariate analysis. Incremental values were assessed after adding atrial fibrillation, body mass index (BMI), and serum albumin to the TAVR risk score in receiver-operating characteristic analysis. The median TAVR risk score was 2.1% with a mean follow-up of 505 days. On Kaplan-Meier analysis, a TAVR risk score >4% had lowest survival rate, whereas TAVR risk score ≤2% had the highest survival rate at 3 years (log-rank P<0.001). The multivariate Cox regression analysis found the TAVR risk score was independently associated with all-cause death, and demonstrated moderate predictive performance for predicting all-cause death at 3 years. However, if each independent predictor is added to the model, it significantly increased discriminatory performance, particularly with BMI and serum albumin level.
Conclusions:
We demonstrated that the TAVR risk score could independently predict mid-term death following TAVR, and had greater predictive performance for predicting all-cause death at 3 years with BMI and serum albumin level.
Over the past few decades, transcatheter aortic valve replacement (TAVR) has emerged as a less invasive alternative to surgical valve replacement, with tremendous survival advantage and symptom benefits.1
The use of an accurate risk prediction model for TAVR is an essential component of patient care; the Society of Thoracic Surgeons (STS), American College of Cardiology (ACC), and Transcatheter Valve Therapies (TVT) produced a statistical model in 2016 to predict procedural outcomes based on patient characteristics and disease severity.2
Another, more recent study demonstrated that the TAVR risk score was more useful than the surgical risk score or other TAVR-specific scores, especially to predict 30-day death, in a German population.3
However, information regarding the utility of this scoring method for predicting mid-term outcomes in patients undergoing TAVR is scarce.4–8
Editorial p 1630
The purpose of this study was to investigate whether the TAVR risk score could independently predict mid-term death after TAVR, and to evaluate its predictive performance.
Methods
Study Population
The study population comprised 682 patients with severe aortic stenosis (AS) who underwent TAVR at the Sakakibara Heart Institute, Yamagata University Hospital, and Juntendo University Hospital between April 2010 and May 2018. Among the patients, 551 were from Sakakibara, 36 from Yamagata, and 95 from Juntendo. The treatment was initially determined according to the following criteria: (1) presence of symptoms; (2) degenerative AS; (3) a mean gradient >40 mmHg or jet velocity >4.0 m/s; or (4) aortic valve area <1 cm2
(0.6 cm2/m2). All cases were reviewed by a multidisciplinary team consisting of cardiac surgeons, interventional cardiologists, and imaging specialists, and transcatheter therapies were considered preferable. Patients on dialysis, with active endocarditis or other active infections, or with estimated life expectancy <12 months because of noncardiac conditions were excluded from this study. The STS risk score for predicted risk of death, Logistic EuroSCORE, EuroSCORE II, and the TAVR risk score were calculated.1,2
The institutional review boards in each hospital approved the study. All information was retrospectively obtained from patients’ medical records or telephone interview. Therefore, follow-up and accountability of all patients was ensured. Informed consent was given by each patient. The study was performed in accordance with the ethical principles of the Declaration of Helsinki and was approved by the Human Investigation Committee.
TAVR Risk Score
The STS/ACC TAVR risk score was developed at the ACC in collaboration with the STS as a STS/ACC TVT Registry risk-adjusted mortality model, consisting of the variables age, sex, race, renal function, presence of lung disease, degree of heart failure, procedural access, and acuity status (http://tools.acc.org/tavrrisk/#!/content/evaluate/). Technical experts designed and built the app, overseen by a group of clinical leaders and experts representing the target audience.
Endpoint and Other Criteria
The primary endpoint was all-cause death following TAVR. Echocardiographic findings were analyzed by full-time academic echocardiographers using ACC/AHA guidelines. Procedural complications were defined according to the Valve Academic Research Consortium-2 Criteria.9
Device success was defined as the absence of procedural death, correct positioning of a single prosthetic valve, and performance of the prosthetic valve as initially intended. The complications at 30 days included all-cause death, all stroke, life-threatening bleeding, acute kidney injury (Acute Kidney Injury Network, stage 2 or 3), coronary obstruction requiring intervention, major vascular complications, and valve-related dysfunction requiring a repeat procedure. TAVR was performed as previously described.1
Statistical Analysis
Continuous variables are expressed as the mean±standard deviation or median with interquartile range, and categorical variables as the number and percentage. Normality of distribution for continuous variables was tested using the Shapiro-Wilk test. A 2-sided P-value <0.05 was considered statistically significant.
The TAVR risk score was stratified into 3 groups (≤2%, 2–4%, >4%) using the interquartile range and each outcome as a reference in the present study, and Kaplan-Meier analysis was used to estimate the cumulative mortality in each group. To determine the influence on the relationship between outcomes, variables (shown in
Table 1) with P-values <0.10 in the univariate analysis were entered into the multivariate Cox regression analysis. Receiver-operating characteristic (ROC) analysis was performed using all-cause death at 1 year and 3 years. Moreover, the area under the curve of the Logistic EuroSCORE, the EuroSCORE II, and the STS score were compared with those of the TAVR risk score at 1 year and 3 years using reclassification analysis by integrated discrimination improvement and net reclassification improvement. In the analysis for the primary endpoint, we established a clinical model consisting of variables that were identified as independent predictors on multivariate analysis: atrial fibrillation (AF), serum albumin level, and body mass index (BMI). Sex was excluded from the ROC analysis because the TAVR risk score includes the sex information when it is being calculated. Information regarding TAVR valve generation was also excluded. Incremental values were assessed after adding each marker to the clinical model. Incremental values were assessed after adding each predictor to this model, and compared between the TAVR risk score alone. Kaplan-Meier analysis was used to estimate the cumulative mortality in each group. All analyses were performed using SPSS version 22.0 (IBM, Armonk, NY, USA) and R version 2.13 (R Foundation for Statistical Computing, Vienna, Austria).
Table 1.
Baseline Patient Characteristics
| Characteristic |
Overall (n=682) |
| Age, years |
85 (81, 88) |
| Women, % |
479 (69.0) |
| BMI (kg/m2) |
21.9 (19.5, 24.6) |
| NYHA classification III/IV, % |
365 (53.5) |
| TAVR risk score, % |
2.1 (2.7, 3.7) |
| STS score, % |
5.8 (4.0, 8.3) |
| Clinical frailty scale (1–9) |
4 (4, 5) |
| Diabetes mellitus, % |
160 (23.5) |
| Hypertension, % |
533 (78.2) |
| Dyslipidemia, % |
376 (55.1) |
| Previous MI, % |
41 (6.0) |
| Previous bypass surgery, % |
48 (7.0) |
| Peripheral artery disease, % |
107 (15.7) |
| Previous stroke, % |
71 (10.4) |
| AF, % |
167 (24.5) |
| COPD, % |
50 (7.3) |
| Hemoglobin level, g/dL |
11.5 (10.5, 12.6) |
| eGFR, mL/min/1.73 m2 |
52.9 (41.2, 64.4) |
| Serum albumin, g/dL |
3.8 (3.5, 4.1) |
| Ejection fraction, % |
62 (56, 66) |
| Aortic valve area, cm2 |
0.64 (0.53, 0.75) |
| Mean gradient, mmHg |
50 (40, 64) |
| MR (moderate/severe) |
25 (3.7) |
| Pulmonary artery pressure, mmHg |
25 (21, 31) |
Values are median (interquartile range). AF, atrial fibrillation; BMI, body mass index; COPD, chronic obstructive pulmonary disease; eGFR, estimated glomerular filtration rate; MI, myocardial infarction; MR, mitral regurgitation; NYHA, New York Heart Association; STS, Society of Thoracic Surgeons; TAVR, transcatheter aortic valve replacement.
Results
Overall Outcomes After TAVR
Patient demographic and clinical characteristics at baseline are shown in
Table 1. Mean age was 83.9±5.4 years (median, 85 years). Mortality at 30 days after TAVR was 0.5%, with a median STS score of 5.8% (median Logistic EuroSCORE, and EuroSCORE II: 12.8% and 4.1%, respectively). Median TAVR risk score was 2.1% (1st and 3rd interquartile range: 2.7 and 3.7, respectively).
Figure 1
shows the distribution of TAVR risk score in each STS score group, when the TAVR risk score was stratified into 3 groups. Other procedural outcomes are shown in
Table 2. Observed mortality at 30 days was much less than the mortality predicted by using both the STS and TAVR risk scores.
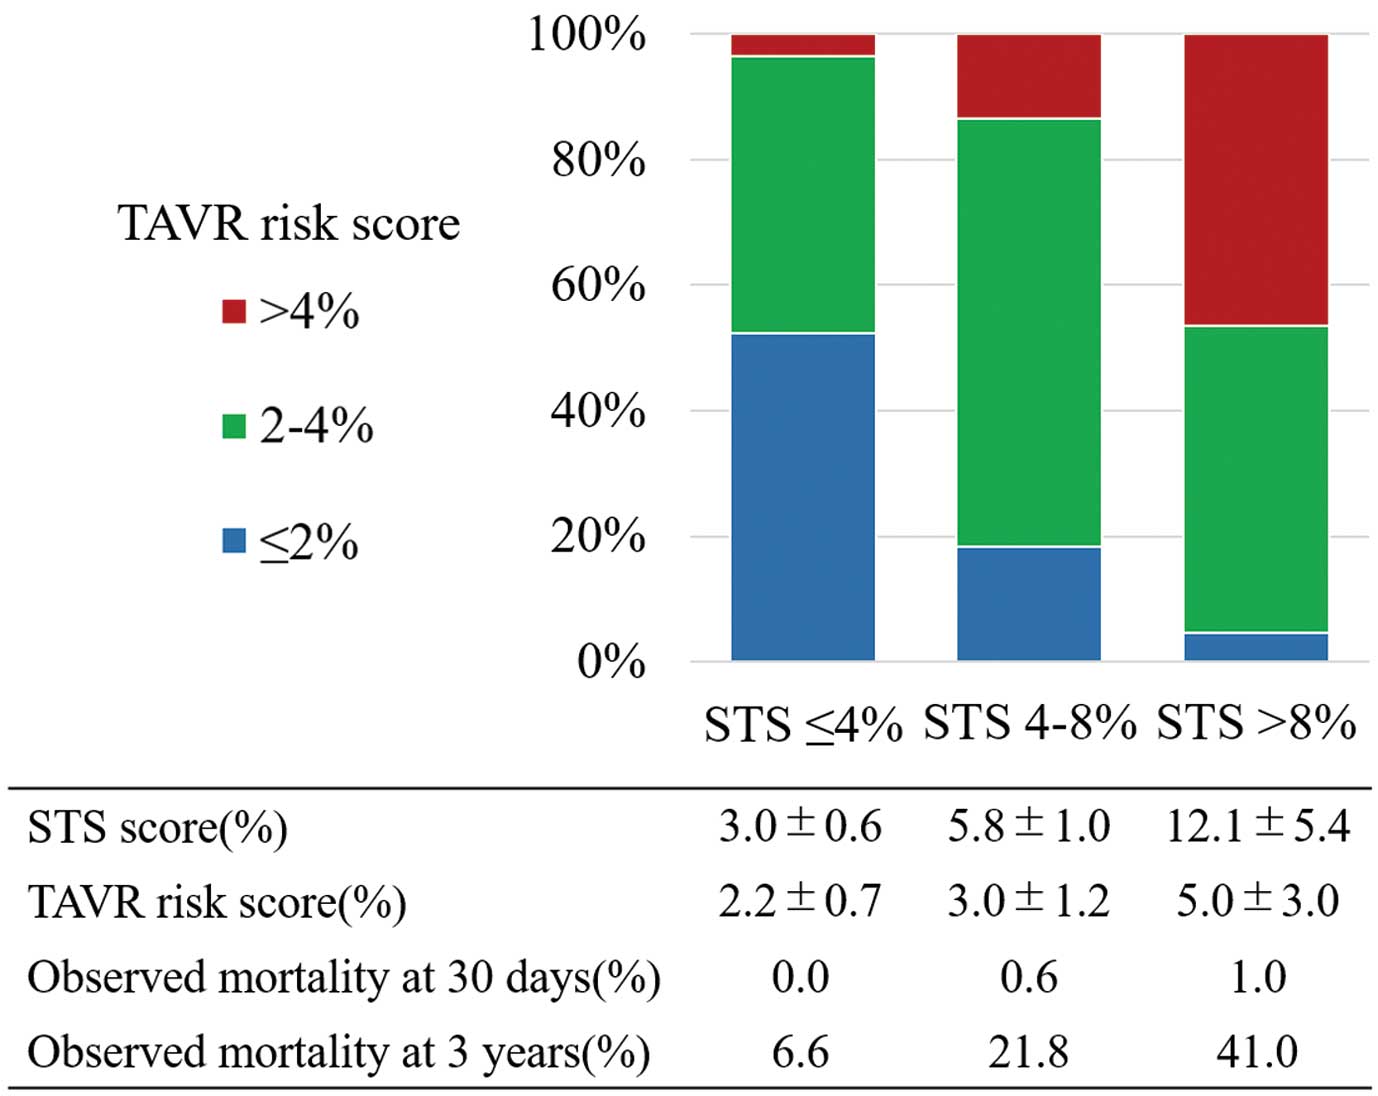
Table 2.
Procedural Characteristics
| Outcome |
Overall (n=682) |
| Transfemoral approach, % |
594 (87.0) |
| SAPIEN XT, % |
215 (31.5) |
| CoreValve, % |
29 (4.2) |
| SAPIEN 3, % |
316 (46.3) |
| CoreValve Evolut R, % |
109 (15.9) |
| Other valves, % |
12 (1.7) |
| Emergency transcatheter valve in transcatheter valve, % |
4 (0.5) |
| Procedure time, min |
84 (65, 111) |
| Radiation time, min |
20 (16, 26) |
| Contrast media, mL |
84 (54, 120) |
| Device success, % |
662 (97.0) |
| Early safety at 30 days, % |
612 (89.8) |
| Death, % |
4 (0.5) |
| All stroke, % |
25 (3.6) |
| Life-threatening bleeding, % |
20 (2.9) |
| Acute kidney injury (AKIN stage 2 or 3), % |
14 (2.0) |
| Coronary obstruction requiring intervention, % |
7 (1.0) |
| Major vascular complication, % |
24 (3.5) |
| Paravalvular leak (moderate/severe) |
36 (5.2) |
Values are n (%) or median (interquartile range). TAVR, transcatheter aortic valve replacement.
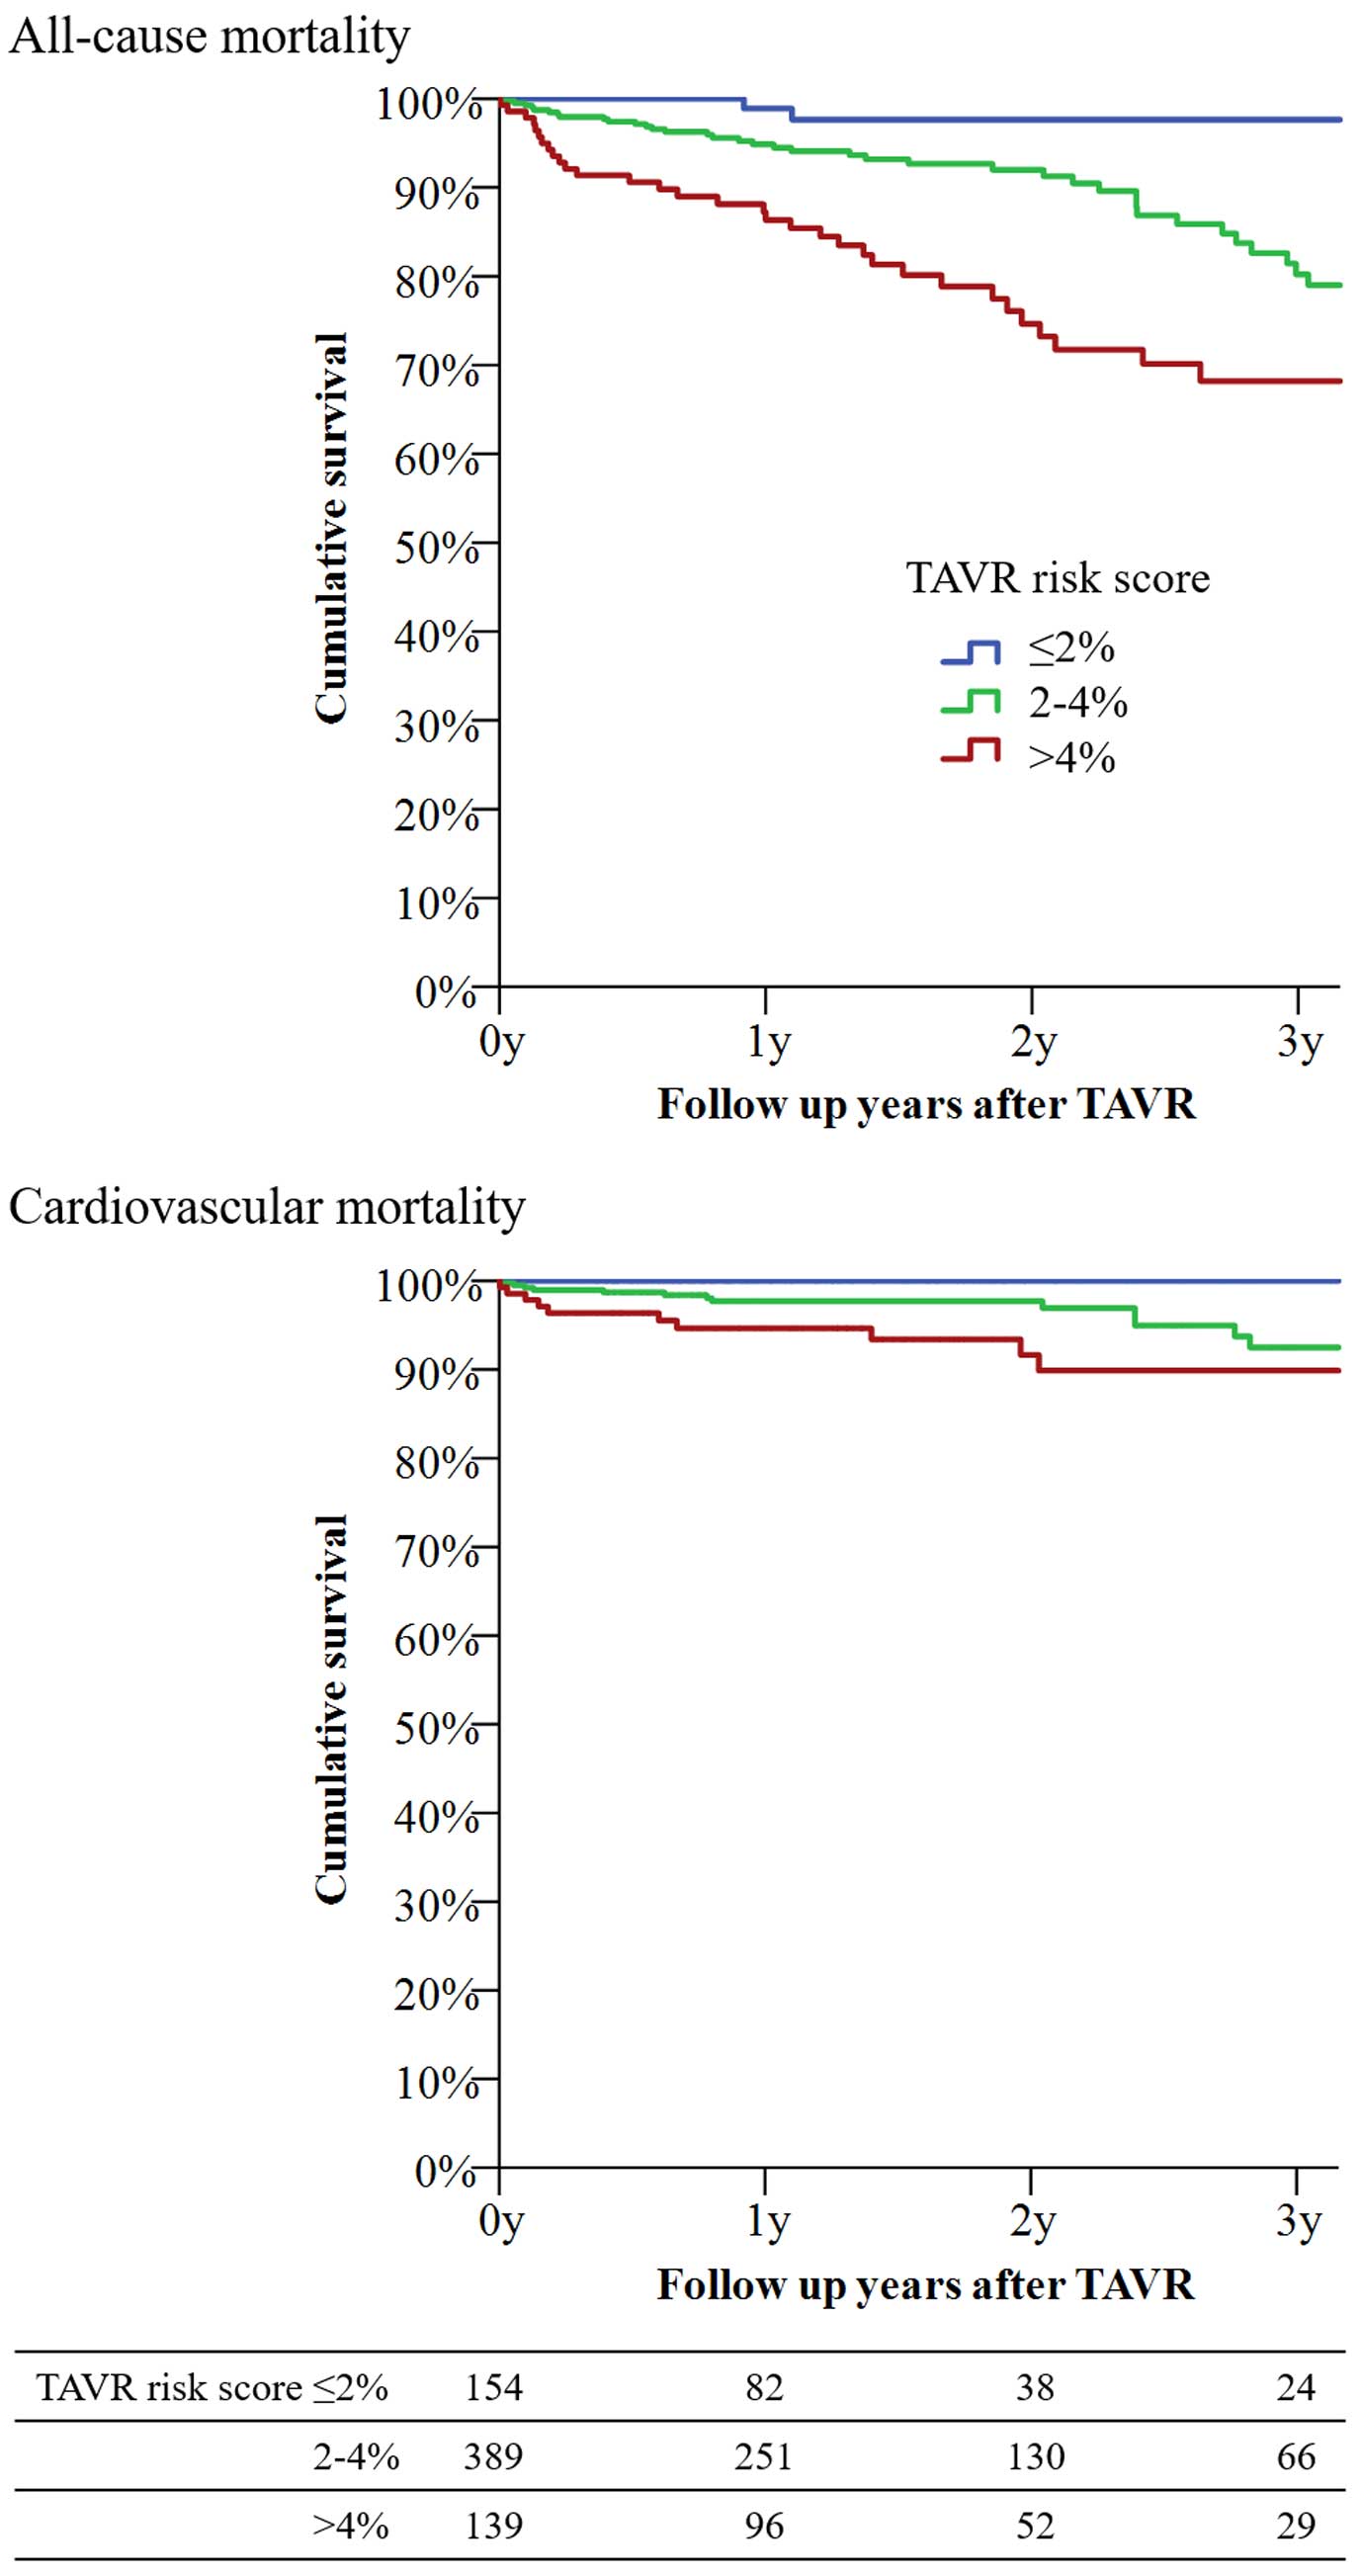
Figure 2
shows the survival rate following TAVR stratification into 3 groups in the Kaplan-Meier analysis. TAVR risk score >4% had the lowest survival rate, while TAVR risk score ≤2% had the highest survival rate at 3 years (log-rank P<0.001 for all-cause death, and log-rank P=0.007 for cardiovascular death). The survival rate in each group (TAVR risk score ≤2, 2–4, and >4%) at 3 years was 93.2±4.6%, 80.2±3.7%, and 68.2±5.1%, respectively.
Association Between Primary Endpoint and Clinical Characteristics
After performing univariate analyses, the baseline variables (shown in
Table 1) of female sex, BMI, New York Heart Association (NYHA) classification, TAVR risk score, clinical frailty scale, hypertension, peripheral artery disease, AF, estimated glomerular filtration rate, serum albumin level, aortic mean pressure gradients, transfemoral approach, and use of 2nd-generation TAVR valve, were entered into the multivariate Cox regression analysis (Table 3). The analysis found that female sex, BMI, TAVR risk score, AF, serum albumin level, and use of 2nd-generation TAVR valve were independently associated with all-cause death. On the other hand, the clinical frailty scale, which is a commonly used frailty marker, was not identified as a predictor of all-cause death in the multivariate analysis.
Table 3.
Predictors of All-Cause Death in Univariate and Multivariate Cox Regression Analyses
| Parameters |
HR |
95% CI |
P value |
Adjusted HR |
95% CI |
P value |
| Age (every 10 years increase) |
1.16 |
0.80–1.68 |
0.416 |
|
|
|
| Women |
0.60 |
0.39–0.91 |
0.017 |
0.58 |
0.37–0.90 |
0.016 |
| BMI (<20 kg/m2) |
1.64 |
1.08–2.49 |
0.019 |
1.62 |
1.05–2.52 |
0.028 |
| NYHA classification (every degree increase) |
1.47 |
1.05–2.07 |
0.024 |
|
|
|
| TAVR risk score (≤2, 2–4, >4%) |
1.12 |
1.04–1.20 |
0.001 |
1.70 |
1.21–2.37 |
0.002 |
| Clinical frailty scale (every score increase) |
1.26 |
1.03–1.54 |
0.019 |
|
|
|
| Diabetes mellitus |
1.14 |
0.71–1.81 |
0.580 |
|
|
|
| Hypertension |
0.64 |
0.40–1.04 |
0.075 |
|
|
|
| Dyslipidemia |
0.85 |
0.56–1.28 |
0.442 |
|
|
|
| Previous MI |
0.97 |
0.41–2.20 |
0.923 |
|
|
|
| Previous bypass surgery |
1.00 |
0.50–2.01 |
0.979 |
|
|
|
| Peripheral artery disease |
1.63 |
1.01–2.65 |
0.045 |
|
|
|
| Previous stroke |
1.55 |
0.87–2.75 |
0.129 |
|
|
|
| AF |
2.38 |
1.57–3.62 |
<0.001 |
2.41 |
1.56–3.72 |
<0.001 |
| COPD |
1.59 |
0.79–3.17 |
0.188 |
|
|
|
| Hemoglobin level (<11 g/dL) |
1.10 |
0.73–1.67 |
0.621 |
|
|
|
| eGFR (every 15 mL/min/1.73 m2 decrease) |
1.20 |
0.96–1.48 |
0.095 |
|
|
|
| Serum albumin (<3.5 g/dL) |
2.09 |
1.35–3.25 |
0.001 |
1.67 |
1.06–2.62 |
0.025 |
| Ejection fraction (every 10% decrease) |
1.11 |
0.90–1.36 |
0.302 |
|
|
|
| Aortic valve area (every 0.1 cm2 decrease) |
1.04 |
0.91–1.20 |
0.535 |
|
|
|
| Mean pressure gradient (every 10 mmHg decrease) |
1.15 |
0.99–1.35 |
0.067 |
|
|
|
| MR (every degree increase) |
1.20 |
0.85–1.68 |
0.285 |
|
|
|
| Pulmonary artery pressure (>40 mmHg) |
1.15 |
0.59–2.24 |
0.660 |
|
|
|
| Transfemoral approach |
0.62 |
0.39–0.99 |
0.048 |
|
|
|
| 2nd- vs. 1 st-generation valve |
0.48 |
0.27–0.84 |
0.011 |
0.55 |
0.31–0.98 |
0.043 |
CI, confidence interval; HR, hazard ratio. Other abbreviations as in Table 1.
In
Table 4, the TAVR risk score demonstrates moderate predictive performance for predicting all-cause death at 1 and 3 years. If the TAVR risk score is compared with other risk scores, there are no differences between the STS score at both 1 and 3 years. Conversely, there are differences between the EuroSCORE 2 at 3 years, and it shows a trend towards a greater value in the TAVR risk score than in the Logistic EuroSCORE and the EuroSCORE 2 at 1 year, but no differences between the logistic EuroSCORE 3 years.
Table 4.
AUC for All-Cause Death in Each Scoring System
| Parameter |
AUC |
95% CI |
P value (NRI/IDI) |
| At 1 year |
| TAVR risk score |
0.69 |
0.59–0.79 |
– |
| Logistic EuroSCORE |
0.56 |
0.45–0.68 |
0.005/0.057 |
| EuroSCORE II |
0.66 |
0.55–0.76 |
0.002/0.076 |
| STS Score |
0.63 |
0.50–0.75 |
0.013/0.311 |
| At 3 years |
| TAVR risk score |
0.66 |
0.56–0.76 |
– |
| Logistic EuroSCORE |
0.62 |
0.52–0.72 |
0.238/0.245 |
| EuroSCORE II |
0.62 |
0.52–0.72 |
0.036/0.025 |
| STS Score |
0.68 |
0.59–0.78 |
0.413/0.323 |
AUC, area under the curve; IDI, integrated discrimination improvement; NRI, net reclassification improvement. Other abbreviations as in Tables 1,3.
When each independent predictor identified in the multivariate analysis (AF, BMI, and serum albumin level) was added to the model, it significantly increased the discriminatory performance, particularly with BMI and serum albumin level (Table 5).
Table 5.
Incremental AUC of Parameters for All-Cause Death
| Parameter |
AUC |
95% CI |
Δ AUC |
P value |
| TAVR risk score |
0.66 |
0.56–0.76 |
– |
– |
| +AF |
0.69 |
0.59–0.78 |
+0.04 |
0.251 |
| +Serum albumin |
0.74 |
0.65–0.82 |
+0.09 |
0.023 |
| +BMI |
0.73 |
0.65–0.82 |
+0.08 |
0.033 |
| +AF+serum albumin |
0.76 |
0.67–0.84 |
+0.11 |
0.014 |
| +AF+BMI |
0.76 |
0.67–0.85 |
+0.11 |
0.005 |
| +Serum albumin+BMI |
0.77 |
0.69–0.86 |
+0.12 |
0.003 |
| +AF+serum albumin+BMI |
0.79 |
0.71–0.88 |
+0.14 |
0.001 |
Abbreviations as in Tables 1,3,4.
Discussion
The purpose of this study was to investigate whether the TAVR risk score could independently predict mid-term death following TAVR, and to evaluate its predictive performance. The TAVR risk score was independently associated with mid-term death following TAVR. On Kaplan-Meier analysis, a TAVR risk score >4% had the lowest survival rate, while TAVR risk score ≤2% had the highest survival rate at 3 years. The TAVR risk score demonstrated moderate predictive performance for all-cause death at 1 and 3 years. However, if the variables were added to the model, it significantly increased the discriminatory performance, particularly with BMI and the serum albumin level.
Predictors of Mid-Term Mortality
The TAVR risk score was independently associated with mid-term death following TAVR. Although this score was initially designed to predict periprocedural outcomes in TAVR, the present study demonstrated the usefulness of TAVR risk score for longer outcomes as well.3,10
The STS score is well known as a predictive model for periprocedural surgical outcomes; however, some previous studies reported that the STS score could help predict longer-term outcomes, probably because the comorbid conditions influencing early death after cardiac operations can also affect longer-term survival.11,12
The TAVR risk score includes variables such as age, chronic pulmonary obstructive disease, serum creatinine, or degree of heart failure, all of which can also be considered to result in worse longer-term outcomes. Predicting longer-term outcomes can provide useful information for patients’ decision making. Patients may be advised of their predicted death after TAVR according to our analysis.2
Female sex was identified an independent protecting predictor of death in the longer term in this study. In a previous study, women were found to be more likely to develop major bleeding and vascular complications, as well as needing transfusions in the periprocedural period, probably because of anatomical disadvantages such as smaller femoral artery diameter, left ventricle, or aortic annulus.13
On the other hand, in terms of longer-term outcomes, women have been considered to have better outcomes than men, which is in line with the results of the present study. This is because the men tend to have vascular disease and comorbidities including hypertension, diabetes mellitus, coronary artery disease, prior revascularization, and lower left ventricular ejection fraction, as seen in a previous study.13
BMI, AF, and low serum albumin level have all been discussed previously as predictors of death in TAVR patients.14–16
Nonetheless, this is the first study to demonstrate the effect of TAVR risk score on mid-term outcomes following TAVR.
Survival Rate Stratified According to TAVR Risk Score
On Kaplan-Meier analysis, TAVR risk score >4% had the lowest survival rate, while TAVR risk score ≤2% had the highest survival rate at 3 years. According to our results, the TAVR risk score (≤2%, 2–4%, >4%) may be termed low, intermediate, and high TAVR risk respectively, because the STS score can also be divided into 3 groups for easier understanding of the periprocedural surgical risk. Because TAVR has been approved for patients with a lower surgical risk in the USA and Europe, patients with a lower risk have undergone more TAVR procedures recently than they did some years prior. We now predict a larger number of patients with a lower TAVR risk, as shown in
Figure 1. It is therefore important to consider and precisely predict longer-term outcomes following TAVR as well as short-term outcomes, because younger and healthier patients are unlikely to have unfavorable outcomes, and are likely to survive longer after TAVR.
Predictive Performance of TAVR Risk Score
In the present study, the TAVR risk score demonstrated a moderate predictive performance for predicting all-cause death at 1 and 3 years. The AUC obtained in the present study was similar to that in previous studies [0.69 at 1 year and 0.66 at 3 years in the present study vs. 0.65 at 30 days in the German registry2
and 0.66 at 30 days in the original STS/ACC TAVR registry]. Nonetheless, this is the first study showing that the TAVR risk score has been externally validated in an Asian population as well as US and European populations.2,3
As expected, there are no differences between the TAVR risk score and the STS score at both 1 and 3 years, which seems to be in line with previous results.3
Conversely, there are differences between the TAVR risk score and the EuroSCORE 2 at 3 years, and the TAVR risk score shows a trend to a greater value than the Logistic EuroSCORE and the EuroSCORE 2 at 1 year, but not at 3 years. That being said, even without significant differences between the TAVR risk score and the other risk scores, the TAVR risk score was essentially derived from a large TAVR registry (compared with the STS score derived from a surgical population, which includes a younger and less comorbid population), and it is reasonable to use it as a predictive tool in TAVR patients. Moreover, there is an advantage in the TAVR risk score in terms of the smaller number of input parameters for analysis, even with a similar predictive performance. Of note, the actual numbers of the TAVR risk score (as with the STS score) does not reflect the actual mortality rate in either the short- or mid-term period, which needs to be adjusted, if predicting those numbers.
Incremental Value of the TAVR Risk Score With AF, BMI, and Serum Albumin Level
If the abovementioned variables are added to the model, the discriminatory performance increases significantly, particularly when BMI and serum albumin level are added, which are generally considered part of the frailty markers.14,17,18
In previous studies, some other TAVR risk predictive models failed to include the frailty parameters in their analysis, which can be critical in this very old population.4,5,7,17
In the present study, BMI and low serum albumin level were identified as independent predictors of death, whereas the clinical frailty scale was not, probably because of its subjective parameters.19,20
To enable accurate general use of any disease-specific predictive model, it is necessary to include objective parameters or information that is easy to obtain to minimize the inter- or intravariability.18,21
Although the STS score consists of well-defined parameters, as with the SYNTAX score, its larger number of parameters than needed for the TAVR risk score may result in greater interobserver variability.3
Study Limitations
This study has a number of important limitations. First, it was limited by its retrospective nature. Second, it included a relatively small number of patients who were followed up for more than 3 years. Therefore, broad generalization of the findings cannot be supported.
Conclusions
Our study offers some important conclusions. We have demonstrated that the TAVR risk score could independently predict mid-term death following TAVR, and had greater predictive performance for predicting all-cause death at 3 years with simple parameters.
Acknowledgments
The authors thank Masatoshi Nagayama, MD, Kenichi Hagiya, MD, Jun Shimizu, MD, Yuya Matsue, MD, PhD, and all of the members of our structural heart team.
Funding
This research was supported by the Sakakibara Heart Institute research grant.
Conflict of Interest
T.T. is a proctor for Edwards Lifesciences and Medtronic.
References
- 1.
Leon MB, Smith CR, Mack M, Miller DC, Moses JW, Svensson LG, et al. Transcatheter aortic-valve implantation for aortic stenosis in patients who cannot undergo surgery. N Engl J Med 2010; 363: 1597–1607.
- 2.
Edwards FH, Cohen DJ, O’Brien SM, Peterson ED, Mack MJ, Shahian DM, et al. Development and validation of a risk prediction model for in-hospital mortality after transcatheter aortic valve replacement. JAMA Cardiol 2016; 1: 46–52.
- 3.
Arsalan M, Maren W, Hecker F, Filardo G, Kim WK, Pollock BD, et al. TAVI risk scoring using established versus new scoring systems: Role of the new STS/ACC model. EuroIntervention 2018; 13: 1520–1526.
- 4.
Debonnaire P, Fusini L, Wolterbeek R, Kamperidis V, van Rosendael P, van der Kley F, et al. Value of the “TAVI2-SCORe” versus surgical risk scores for prediction of one year mortality in 511 patients who underwent transcatheter aortic valve implantation. Am J Cardiol 2015; 115: 234–242.
- 5.
Iung B, Laouénan C, Himbert D, Eltchaninoff H, Chevreul K, Donzeau-Gouge P, et al. Predictive factors of early mortality after transcatheter aortic valve implantation: individual risk assessment using a simple score. Heart 2014; 100: 1016–1023.
- 6.
Capodanno D, Barbanti M, Tamburino C, D’Errigo P, Ranucci M, Santoro G, et al. A simple risk tool (the OBSERVANT score) for prediction of 30-day mortality after transcatheter aortic valve replacement. Am J Cardiol 2014; 113: 1851–1858.
- 7.
Seiffert M, Sinning JM, Meyer A, Wilde S, Conradi L, Vasa-Nicotera M, et al. Development of a risk score for outcome after transcatheter aortic valve implantation. Clin Res Cardiol 2014; 103: 631–640.
- 8.
Kötting J, Schiller W, Beckmann A, Schäfer E, Döbler K, Hamm C, et al. German Aortic Valve Score: A new scoring system for prediction of mortality related to aortic valve procedures in adults. Eur J Cardiothorac Surg 2013; 43: 971–977.
- 9.
Kappetein AP, Head SJ, Généreux P, Piazza N, van Mieghem NM, Blackstone EH, et al. Updated standardized endpoint definitions for transcatheter aortic valve implantation: The Valve Academic Research Consortium-2 consensus document. J Am Coll Cardiol 2012; 60: 1438–1454.
- 10.
Reiff C, Gurevich S, Bertog S, Sorajja P, Kelly R, Garcia S. Validation of STS/ACC TVT-TAVR score in veterans undergoing transcatheter aortic valve replacement. J Invasive Cardiol 2018; 30: 447–451.
- 11.
Puskas JD, Kilgo PD, Thourani VH, Lattouf OM, Chen E, Vega JD, et al. The society of thoracic surgeons 30-day predicted risk of mortality score also predicts long-term survival. Ann Thorac Surg 2012; 93: 26–33; discussion 33–35.
- 12.
Hermiller JB Jr, Yakubov SJ, Reardon MJ, Deeb GM, Adams DH, Afilalo J, et al. Predicting early and late mortality after transcatheter aortic valve replacement. J Am Coll Cardiol 2016; 68: 343–352.
- 13.
Saad M, Nairooz R, Pothineni NVK, Almomani A, Kovelamudi S, Sardar P, et al. Long-term outcomes with transcatheter aortic valve replacement in women compared with men: Evidence from a meta-analysis. JACC Cardiovasc Interv 2018; 11: 24–35.
- 14.
Yamamoto M, Mouillet G, Oguri A, Gilard M, Laskar M, Eltchaninoff H, et al. Effect of body mass index on 30- and 365-day complication and survival rates of transcatheter aortic valve implantation (from the FRench Aortic National CoreValve and Edwards 2 [FRANCE 2] registry). Am J Cardiol 2013; 112: 1932–1937.
- 15.
Vora AN, Dai D, Matsuoka R, Harrison JK, Hughes GC 4th, Sherwood MW, et al. Incidence, management, and associated clinical outcomes of new-onset atrial fibrillation following transcatheter aortic valve replacement: An analysis from the STS/ACC TVT Registry. JACC Cardiovasc Interv 2018; 11: 1746–1756.
- 16.
Barili F, Pacini D, D’Ovidio M, Ventura M, Alamanni F, Di Bartolomeo R, et al. Reliability of modern scores to predict long-term mortality after isolated aortic valve operations. Ann Thorac Surg 2016; 101: 599–605.
- 17.
Afilalo J, Alexander KP, Mack MJ, Maurer MS, Green P, Allen LA, et al. Frailty assessment in the cardiovascular care of older adults. J Am Coll Cardiol 2014; 638: 747–762.
- 18.
Afilalo J, Lauck S, Kim DH, Lefèvre T, Piazza N, Lachapelle K, et al. Frailty in older adults undergoing aortic valve replacement: The FRAILTY-AVR Study. J Am Coll Cardiol 2017; 70: 689–700.
- 19.
Shimura T, Yamamoto M, Kano S, Kagase A, Kodama A, Koyama Y, et al. Impact of the clinical frailty scale on outcomes after transcatheter aortic valve replacement. Circulation 2017; 135: 2013–2024.
- 20.
Saji M, Higuchi R, Tobaru T, Iguchi N, Takanashi S, Takayama M, Isobe M. Impact of frailty markers for unplanned hospital readmission following transcatheter aortic valve implantation. Circ J 2018; 82: 2191–2198.
- 21.
Shiomi H, Tamura T, Niki S, Tada T, Tazaki J, Toma M, et al. Inter- and intra-observer variability for assessment of the synergy between percutaneous coronary intervention with TAXUS and cardiac surgery (SYNTAX) score and association of the SYNTAX score with clinical outcome in patients undergoing unprotected left main stenting in the real world. Circ J 2011; 75: 1130–1137.