Abstract
Background:
There has not been a previous report on the long-term outcomes of those patients who refuse aortic valve replacement (AVR) despite physicians’ recommendations.
Methods and Results:
Among 3,815 consecutive patients with severe aortic stenosis (AS) enrolled in the CURRENT AS registry, the study population comprised 2,005 symptomatic patients, who were subdivided into 3 groups by their treatment strategy and the reasons for conservative strategy (Initial AVR group: n=905; Patient rejection group: n=256; Physician judgment group, n=844). The primary outcome measure was a composite of aortic valve-related death and heart failure hospitalization. Patients in the patient rejection group as compared with those in the physician judgment group were younger, and had less comorbidities, and lower surgical risk scores. The cumulative 5-year incidence of the primary outcome measure in the patient rejection group was markedly higher than that in the initial AVR group, and was similar to that in the physician judgment group (60.7%, 19.0%, and 66.4%, respectively).
Conclusions:
Patient rejection was the reason for non-referral to AVR in nearly one-quarter of the symptomatic patients with severe AS who were managed conservatively. The dismal outcome in patients who refused AVR was similar to that in patients who were not referred to AVR based on physician judgment despite less comorbidities and lower surgical risk scores in the former than in the latter.
Aortic stenosis (AS) is the most frequent valvular heart disease and its incidence is increasing with the aging of the population.1
In symptomatic patients with severe AS, the current guidelines strongly recommend surgical aortic valve replacement (AVR) or transcatheter aortic valve implantation (TAVI).2–5
However, previous studies consistently report that a substantial proportion of symptomatic patients do not undergo AVR despite the fact that symptomatic patients with severe AS have an extremely unfavorable prognosis with impaired quality of life and high short-term mortality rate if not treated by AVR,6–8
which can now be performed with relatively low mortality rates even in elderly patients.1,9,10
Previous studies have reported advanced age, frailty, the presence of multiple coexisting conditions, or patient rejection as the reasons for non-referral to AVR.11–15
However, there is a scarcity of data on the relation between the reasons for non-referral to AVR and the long-term outcomes in these patients with severe AS who are managed conservatively despite symptoms.16
More specifically, there has not been a previous report on the long-term outcomes of these patients who refuse AVR despite recommendations by physicians. Therefore, we aimed to investigate the baseline characteristics and long-term clinical outcome in symptomatic patients who denied AVR in comparison with those conservatively managed patients based on physician judgment in a large Japanese multicenter registry of consecutive patients with severe AS.
Methods
Study Population
The CURRENT AS (Contemporary outcomes after sURgery and medical tREatmeNT in patients with severe Aortic Stenosis) registry is a retrospective, multicenter registry enrolling consecutive patients with severe AS from among 27 centers (of which 20 had an on-site surgical facility) in Japan between January 2003 and December 2011. The design, patient enrollment, and outcomes of the registry were previously reported in detail.17
In brief, we searched the hospitals’ databases of transthoracic echocardiography, and enrolled consecutive patients who met the definition of severe AS (peak aortic jet velocity [Vmax] >4.0 m/s, mean aortic pressure gradient [PG] >40 mmHg, or aortic valve area [AVA] <1.0 cm2) for the first time during the study period.2
We excluded patients with a history of aortic valve surgery or percutaneous aortic balloon valvuloplasty. The institutional review boards of all 27 participating centers approved the protocol. Written informed consent from each patient was waived in this retrospective study, because we used clinical information obtained during routine clinical practice, and no patients refused to participate in the study when contacted for follow-up.
Among 3,815 patients enrolled in the registry, there were 2,005 patients with and 1,808 patients without symptoms related to AS at the time of the index echocardiography, excluding 2 patients whose symptomatic status were not available. In the present analysis, 2,005 symptomatic patients with severe AS were divided into the initial AVR (n=905) and conservative (n=1,100) groups. Patients in the conservative group were further subdivided into 2 subgroups according to the main reasons for not choosing the initial AVR strategy after the index echocardiography, namely, patient rejection and physician judgment (Figure 1). We evaluated the baseline characteristics, AVR/TAVI during follow-up, and long-term clinical outcomes in the 2 subgroups of the conservative group with the initial AVR group used as the reference (Figure 1).
Data Collection and Definitions
Collection of baseline clinical information was conducted through review of the hospital charts or database. Angina, syncope, or congestive heart failure (HF) were regarded as symptoms related to AS. The presence of HF was determined as acute HF requiring hospitalization, or chronic exertional dyspnea. There was a specific data field for the reasons the patient was not referred to AVR despite the presence of symptoms. Site investigators entered the data field by searching the hospital chart for the notes regarding recommendation for AVR, the responses of the patient to the recommendation, and the reasons for no recommendation for AVR. All patients underwent comprehensive 2-D and Doppler echocardiographic evaluation in the participating centers. Vmax
and mean PG were obtained with the use of the simplified Bernoulli equation. AVA was calculated by standard continuity equation, and indexed to body surface area.18
Follow-up information was mainly collected through review of the hospital charts and additional information was collected through contact with patients, relatives, and/or referring physicians by mailing a questionnaire regarding survival, symptoms and subsequent hospitalizations.
The primary outcome measure in the current analysis was a composite of aortic valve-related death and HF hospitalization. Secondary outcome measures included the individual components of the primary outcome measure: all-cause death, and non-cardiac death. The causes of death were classified according to the Valve Academic Research Consortium (VARC) definitions and were adjudicated by a clinical event committee.19,20
Sudden death was defined as unexplained death in a previously stable patient. Aortic valve-related death included aortic procedure-related death, sudden death, and death attributed to HF that was possibly related to the aortic valve. HF hospitalization was defined as hospitalization attributed to worsening HF that required intravenous drug therapy.
Statistical Analysis
We present continuous variables as the mean±standard deviation for normal distribution or median with interquartile range (IQR) for non-normal distribution and categorical variables as number and percentage. We compared continuous variables using ANOVA or the Kruskal-Wallis test according to their distributions. We analyzed categorical variables with the chi-squared test. We used the Kaplan-Meier method to estimate the cumulative incidences of clinical events and assessed intergroup differences with the log-rank test. The outcomes of the initial AVR group and physician judgment group were compared with those of the patient rejection group in the univariate and multivariable Cox proportional hazard models. Consistent with our previous report, we used the 21 clinically relevant risk-adjusting variables in the Cox proportional hazard models (age, male, body mass index (BMI) <22 kg/m2, peak aortic jet velocity ≥4 m/s, coronary artery disease (CAD), creatinine level >0.83 mg/dL, malignancy current under treatment, anemia, ejection fraction (EF) <68%, chronic lung disease, hypertension, diabetes mellitus on insulin therapy, current smoking, prior myocardial infarction (MI), prior symptomatic stroke, atrial fibrillation or flutter, aortic/peripheral vascular disease, hemodialysis, liver cirrhosis, any combined valvular disease, and tricuspid regurgitation (TR) PG ≥40 mmHg) as indicated in
Table 2. We assigned dummy variables for both the initial AVR and physician judgment groups compared with the patient rejection group and estimated hazard ratios (HR) and their 95% confidence intervals (CI). We also estimated the overall P values among the 3 groups. We performed a subgroup analysis based on age (<75 years or ≥75 years) for the primary outcome measure, because age is one of the most relevant factors for the choice of initial treatment strategy. The predictors of AVR/TAVI during follow-up were estimated by univariate and multivariable logistic regression models. Based on the results of the univariate analyses, we incorporated 16 clinically relevant potential independent predictors in the logistic regression models (age, male, BMI <22 kg/m2, peak aortic jet velocity ≥4 m/s, CAD, creatinine level >0.83 mg/dL, malignancy current under treatment, anemia, EF <68%, chronic lung disease, dyslipidemia, prior MI, prior symptomatic stroke, aortic/peripheral vascular disease, any combined valvular disease, and TRPG ≥40 mmHg) as indicated in
Supplementary Table 1. We evaluated the effect of AVR/TAVI during follow-up on the primary outcome measure. We incorporated AVR/TAVI during follow-up as the time-updated covariate together with the same 21 risk-adjusting variables used in the main analysis into the multivariable Cox proportional hazard model and estimated the HR of AVR/TAVI during the follow-up for the primary outcome measure.
All statistical analyses were conducted by a physician using JMP 13.0.0 (SAS Institute Inc., Cary, NC, USA) or SPSS version 25.0.0.2 (IBM Corp.) in collaboration with a statistician. All reported P-values are 2-tailed, and P<0.05 was considered statistically significant.
Results
Reasons for Not Choosing the Initial AVR Strategy
In symptomatic patients with severe AS, the 2 main reasons for not choosing the initial AVR strategy were patient rejection despite physician recommendation for AVR (patient rejection group: n=256) and physician judgment considering the risk-benefit balance of the AVR procedure (physician judgment: n=844). In the physician judgment group, the dominant reasons included very advanced age, improvement of symptoms by medications, prohibitive surgical risk, and dementia/frailty (Table 1). Dementia/frailty accounted for 16.8% of the physician judgment group. Prohibitive surgical risk included cardiac dysfunction, renal dysfunction, liver cirrhosis, respiratory dysfunction, thoracic deformity and previous open cardiac surgery.
Table 1.
Reasons for Choosing Conservative Strategy Despite Symptomatic Severe Aortic Stenosis
| Reasons |
No. of patients |
| Patient rejection |
256 |
| Physician judgment |
844 |
| Too advanced age |
443 |
| Improved symptoms by medications |
204 |
| Prohibitive surgical risk |
168 |
| Dementia/Frailty |
142 |
| Symptoms related to CAD |
54 |
| Limited life expectancy |
51 |
| Other |
13 |
The individual reasons for physician judgment were not mutually exclusive. Prohibitive surgical risk included cardiac dysfunction, renal dysfunction, liver cirrhosis, respiratory dysfunction, thoracic deformity and previous open cardiac surgery. Other includes referral to another hospital in 3 patients, cardiopulmonary arrest before further examination in 1 patient, need for non-cardiac surgery in 1 patient, and unknown in 8 patients. CAD, coronary artery disease.
The baseline characteristics of the 2 conservative subgroups were much different from those of the initial AVR group, with advanced age, preponderance of women, lower BMI, more comorbidities, higher prevalence of HF symptoms, and higher surgical risk scores (Table 2). Patients in the patient rejection group were younger, and had less comorbidities, less acute HF, and lower surgical risk scores than those in the physician judgment group (Table 2). The severity of AS evaluated by Vmax
was greater in the initial AVR than in the patient rejection group and was greater in the patient rejection than in the physician judgment group (Table 2).
Table 2.
Baseline Clinical and Echocardiographic Characteristics
| |
Initial AVR
group
(n=905) |
Patient
rejection group
(n=256) |
Physician
judgment group
(n=844) |
P value |
P value |
3-way
comparison |
Physician
judgment vs.
Patient rejection |
| Clinical characteristics |
| Age, years |
73.9±8.9 |
80.0±7.8 |
83.2±9.0 |
<0.0001 |
<0.0001 |
| ≥75 years, n (%) |
478 (52.8) |
201 (78.5) |
711 (84.2) |
<0.0001 |
0.04 |
| Women, n (%) |
524 (57.9) |
178 (69.5) |
590 (69.9) |
<0.0001 |
0.91 |
| BMI |
22.4±3.6 |
21.4±3.9 |
20.7±3.8 |
<0.0001 |
0.02 |
| <22, n (%) |
476 (52.6) |
171 (66.8) |
621 (73.6) |
<0.0001 |
0.04 |
| BSA (m2) |
1.49±0.18 |
1.42±0.18 |
1.39±0.19 |
<0.0001 |
0.07 |
| Hypertension, n (%) |
618 (68.3) |
187 (73.1) |
613 (72.6) |
0.09 |
0.90 |
| Current smoking, n (%) |
240 (26.5) |
50 (19.5) |
138 (16.4) |
<0.0001 |
0.24 |
| Dyslipidemia, n (%) |
360 (39.8) |
78 (30.5) |
241 (28.6) |
<0.0001 |
0.56 |
| On statin therapy, n (%) |
267 (29.5) |
60 (23.4) |
179 (21.2) |
0.0003 |
0.45 |
| Diabetes mellitus, n (%) |
217 (24.0) |
55 (21.5) |
191 (22.6) |
0.65 |
0.70 |
| On insulin therapy, n (%) |
47 (5.2) |
10 (3.9) |
40 (4.7) |
0.68 |
0.57 |
| Prior MI, n (%) |
46 (5.1) |
22 (8.6) |
104 (12.3) |
<0.0001 |
0.09 |
| Prior PCI, n (%) |
82 (9.1) |
22 (8.6) |
112 (13.3) |
0.009 |
0.04 |
| Prior CABG, n (%) |
28 (3.1) |
16 (6.3) |
60 (7.1) |
0.0004 |
0.63 |
| Prior open cardiac surgery, n (%) |
38 (4.2) |
22 (8.6) |
94 (11.1) |
<0.0001 |
0.22 |
| Prior symptomatic stroke, n (%) |
82 (9.1) |
32 (12.5) |
135 (16.0) |
<0.0001 |
0.16 |
| Atrial fibrillation, n (%) |
168 (18.6) |
65 (25.4) |
257 (30.5) |
<0.0001 |
0.12 |
| Aortic/peripheral vascular disease, n (%) |
125 (13.8) |
25 (9.8) |
130 (13.8) |
0.06 |
0.02 |
| Serum creatinine (mg/dL) |
0.84 (0.70–1.16) |
0.92 (0.70–1.38) |
1.00 (0.73–1.59) |
<0.0001 |
0.29 |
| Creatinine level >2 mg/dL, n (%) |
116 (12.8) |
34 (13.3) |
144 (17.1) |
0.04 |
0.14 |
| Hemodialysis, n (%) |
103 (11.4) |
19 (7.4) |
76 (9.0) |
0.09 |
0.42 |
| Anemia, n (%) |
499 (55.1) |
149 (58.2) |
606 (71.8) |
<0.0001 |
<0.0001 |
| Liver cirrhosis (Child-pugh B or C), n (%) |
3 (0.3) |
1 (0.4) |
17 (2.0) |
0.003 |
0.08 |
| Malignancy, n (%) |
97 (10.7) |
24 (9.4) |
119 (14.1) |
0.04 |
0.04 |
Malignancy currently under treatment,
n (%) |
17 (1.9) |
3 (1.2) |
35 (4.2) |
0.004 |
0.01 |
| Chest wall irradiation, n (%) |
6 (0.7) |
2 (0.8) |
5 (0.6) |
0.95 |
0.75 |
| Immunosuppressive therapy, n (%) |
27 (3.0) |
7 (2.7) |
37 (4.4) |
0.22 |
0.22 |
| Chronic lung disease, n (%) |
114 (12.6) |
27 (10.6) |
98 (11.6) |
0.62 |
0.64 |
Chronic lung disease (moderate or
severe), n (%) |
17 (1.9) |
9 (3.5) |
43 (5.1) |
0.0009 |
0.28 |
| CAD, n (%) |
330 (36.5) |
64 (25.0) |
252 (29.9) |
0.0004 |
0.13 |
| Logistic Euro Score, % |
7.6 (4.8–12.6) |
11.8 (7.9–19.3) |
16.3 (10.5–27.1) |
<0.0001 |
<0.0001 |
| Euro Score, % |
2.5 (1.5–4.1) |
3.8 (2.6–6.1) |
5.3 (3.3–8.5) |
<0.0001 |
<0.0001 |
| STS score (PROM), % |
3.1 (1.9–5.2) |
4.6 (2.8–7.9) |
6.6 (10.8–3.9) |
<0.0001 |
<0.0001 |
| Symptoms |
| Angina, n (%) |
291 (32.2) |
55 (21.5) |
152 (18.0) |
<0.0001 |
0.22 |
| Syncope, n (%) |
110 (12.2) |
29 (11.3) |
59 (7.0) |
<0.0001 |
0.03 |
| HF, n (%) |
659 (72.8) |
212 (82.8) |
732 (86.7) |
<0.0001 |
0.12 |
| Acute HF requiring hospitalization, n (%) |
270 (29.8) |
93 (36.3) |
427 (50.6) |
<0.0001 |
0.0002 |
| Etiology of aortic stenosis |
|
|
|
<0.0001 |
0.87 |
| Degenerative, n (%) |
753 (83.2) |
241 (94.1) |
796 (94.3) |
|
|
| Congenital, n (%) |
100 (11.1) |
4 (1.6) |
14 (1.7) |
|
|
| Rheumatic, n (%) |
44 (4.9) |
9 (3.5) |
31 (3.7) |
|
|
| Infective endocarditis, n (%) |
3 (0.3) |
0 (0.0) |
0 (0) |
|
|
| Other, n (%) |
5 (0.6) |
2 (0.8) |
3 (0.4) |
|
|
| Echocardiographic variables |
| LV end-diastolic diameter (mm) |
47.8±7.4 |
46.8±7.4 |
46.2±7.8 |
<0.0001 |
0.25 |
| LV end-systolic diameter (mm) |
32.1±9.0 |
31.6±8.8 |
31.8±8.7 |
0.76 |
0.75 |
| LVEF (%) |
61.4±14.9 |
60.5±14.8 |
58.1±14.8 |
<0.0001 |
0.03 |
| LVEF <40%, n (%) |
99 (10.9) |
24 (9.4) |
113 (13.4) |
0.12 |
0.08 |
| LVEF <50%, n (%) |
186 (20.6) |
53 (20.7) |
212 (25.1) |
0.057 |
0.14 |
| IVST in diastole (mm) |
11.9±2.4 |
11.8±2.4 |
11.1±2.3 |
<0.0001 |
<0.0001 |
| PWT in diastole (mm) |
11.6±2.1 |
11.3±1.9 |
10.7±2.0 |
<0.0001 |
0.0002 |
| Peak aortic jet velocity (m/s) |
4.7±0.8 |
4.5±0.9 |
3.9±0.9 |
<0.0001 |
<0.0001 |
| Peak aortic jet velocity ≥4 m/s |
748 (82.7) |
195 (76.2) |
377 (44.7) |
<0.0001 |
<0.0001 |
| Peak aortic jet velocity ≥5 m/s |
314 (34.7) |
71 (27.7) |
105 (12.4) |
<0.0001 |
<0.0001 |
| Peak aortic pressure gradient (mmHg) |
90.3±31.2 |
84.0±31.6 |
63.1±29.9 |
<0.0001 |
<0.0001 |
| Mean aortic pressure gradient (mmHg) |
53.4±19.2 |
48.5±21.1 |
35.6±18.8 |
<0.0001 |
<0.0001 |
| AVA (equation of continuity) (cm2) |
0.64±0.18 |
0.64±0.20 |
0.71±0.19 |
<0.0001 |
<0.0001 |
| AVA index (cm2/m2) |
0.43±0.12 |
0.46±0.13 |
0.52±0.14 |
<0.0001 |
<0.0001 |
Any combined valvular disease
(moderate or severe) |
397 (43.9) |
144 (56.3) |
456 (54.0) |
<0.0001 |
0.53 |
| Moderate or severe AR, n (%) |
238 (26.3) |
70 (27.3) |
189 (22.4) |
0.1 |
0.11 |
| Moderate or severe MS, n (%) |
44 (4.9) |
8 (3.1) |
32 (3.8) |
0.35 |
0.61 |
| Moderate or severe MR, n (%) |
201 (22.2) |
91 (35.6) |
258 (30.6) |
<0.0001 |
0.14 |
| Moderate or severe TR, n (%) |
125 (13.8) |
54 (21.1) |
233 (27.6) |
<0.0001 |
0.03 |
| TR pressure gradient ≥40 mmHg |
159 (17.6) |
73 (28.5) |
201 (23.8) |
0.0001 |
0.13 |
BMI was calculated as weight in kilograms divided by height in meters squared. Anemia was defined by the World Health Organization criteria (hemoglobin <12.0 g/dL in women and <13.0 g/dL in men). AR, aortic regurgitation; AVA, aortic valve area; AVR, aortic valve replacement; BMI, body mass index; BSA, body surface area; CABG, coronary artery bypass grafting; CAD, coronary artery disease; HF, heart failure; IVST, interventricular septum thickness; LV, left ventricular; LVEF, left ventricular ejection fraction; MI, myocardial infarction; MR, mitral regurgitation; MS, mitral stenosis; PCI, percutaneous coronary intervention; PROM, predicted risk of mortality; PWT, posterior wall thickness; STS, Society of Thoracic Surgeons; TR, tricuspid regurgitation.
Median follow-up interval of the surviving patients was 1,294 (IQR: 973–1,710) days. During follow-up, patients in the patient rejection group more often underwent AVR or TAVI than those in the physician judgment group (cumulative 5-year incidence: 44.7% and 25.2%, respectively), while the vast majority of patients in the initial AVR group actually underwent AVR within 6 months of the index echocardiography (Figure 2). In the logistic regression analyses for the predictors of AVR/TAVI during follow-up in the entire cohort, the independent predictors included patients with advanced age, low BMI, peak aortic jet velocity ≥4 m/s, CAD, anemia, and EF <68% (Supplementary Table 1). The cumulative 5-year incidence of the primary outcome measure (aortic valve-related death or HF hospitalization) in the patient rejection group was markedly higher than that in the initial AVR group, and was similar to that in the physician judgment group (60.7%, 19.0%, and 66.4%, respectively) (Figure 3). After adjusting for potential confounders, the excess risk of the patient rejection group relative to the initial AVR group for the primary outcome measure remained significant, while the risk of the patient rejection group for the primary outcome measure was comparable to that of the physician judgment group (Table 3). The cumulative 5-year incidences of all-cause death and non-cardiac death in the patient rejection group trended to be lower than those in the physician judgment group (Figure 3). In the patient rejection group, almost 80% of patients who underwent AVR/TAVI did so within 2 years of the index echocardiography, and the mortality rate was much higher in patients without AVR/TAVI than in patients with AVR/TAVI (Supplementary Figures 1,2). The cumulative incidence of death after AVR/TAVI was similar across the 3 groups (patient rejection/physician judgment/initial AVR) (Supplementary Figure 3).

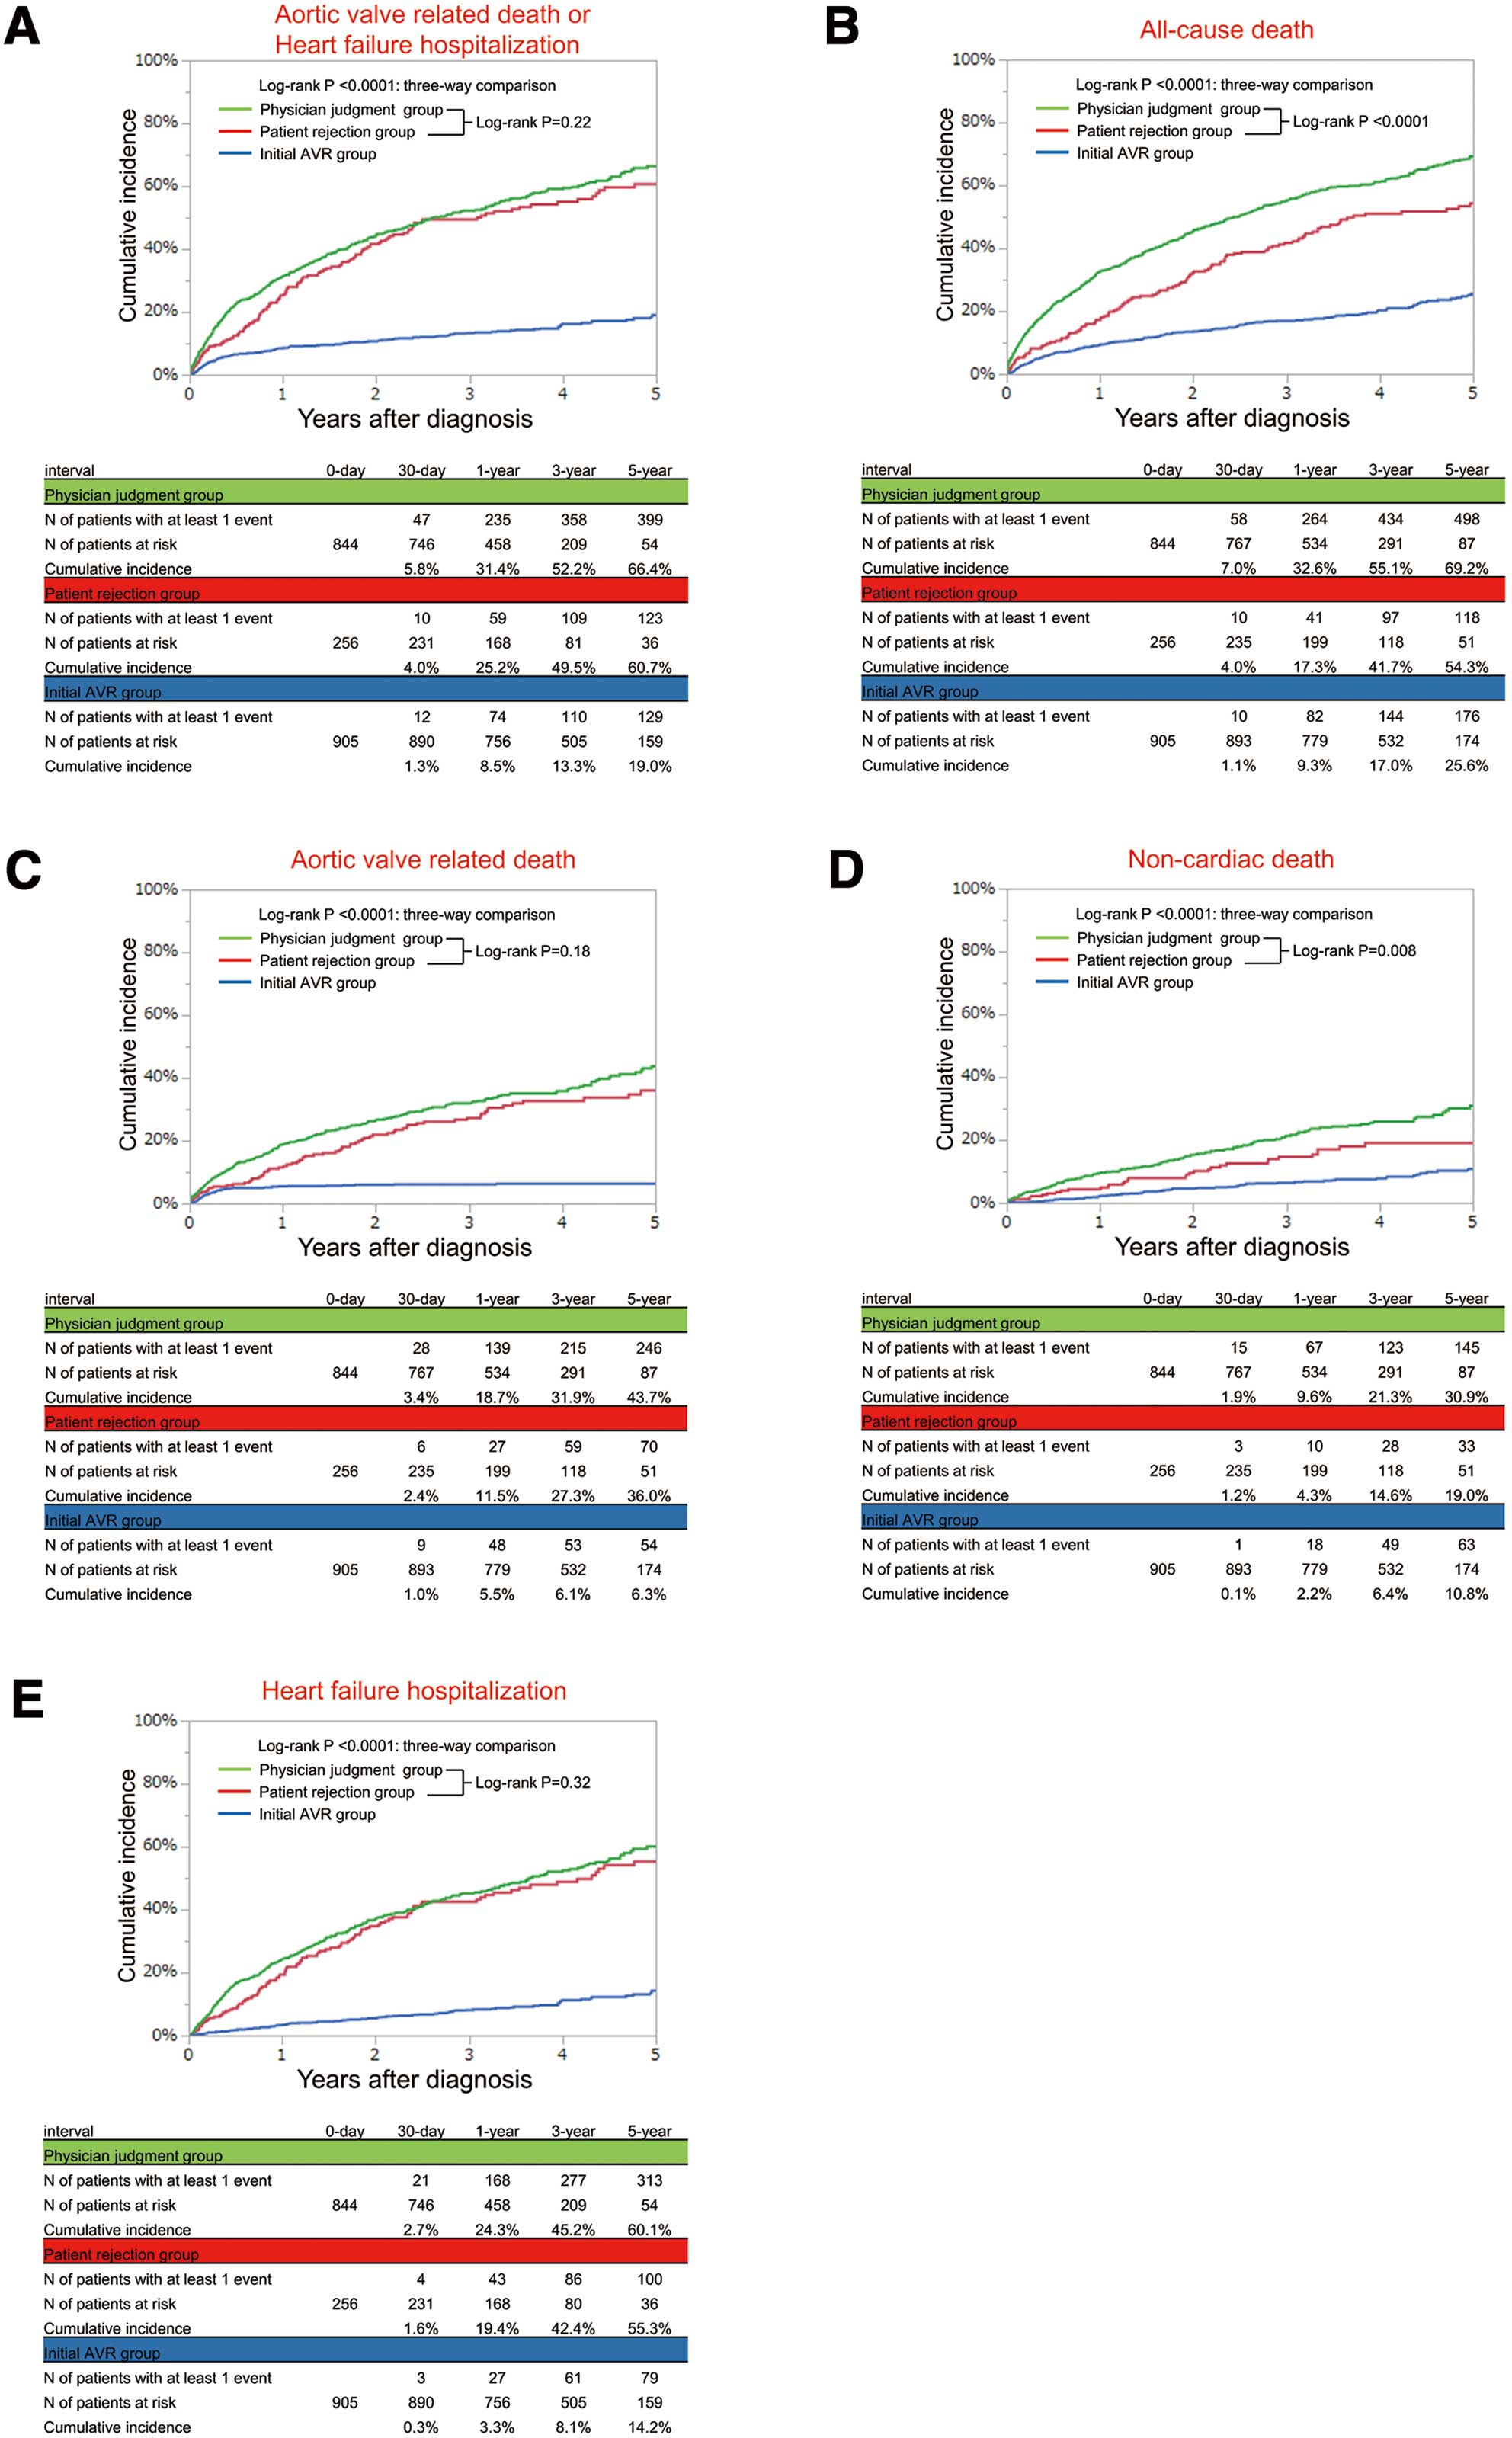
Table 3.
Risk of the Patient Rejection and Physician Judgment Groups Relative to the Initial AVR Group for the Primary and Secondary Outcome Measures
| Variables |
No. of patients
with event
(Cumulative
5-year
incidence, %) |
Unadjusted |
Adjusted |
| HR |
95% CI |
P value |
Overall
P value |
HR |
95% CI |
P value |
Overall
P value |
| Composite of aortic valve-related death or HF hospitalization |
| Initial AVR group |
142 (19.0) |
0.23 |
0.18–0.30 |
<0.0001 |
|
0.28 |
0.22–0.36 |
<0.0001 |
|
| Patient rejection group |
132 (60.7) |
1 (Ref.) |
|
|
<0.0001 |
1 (Ref.) |
|
|
<0.0001 |
| Physician judgment group |
407 (66.4) |
1.14 |
0.94–1.39 |
0.19 |
|
0.93 |
0.76–1.15 |
0.52 |
|
| All-cause death |
| Initial AVR group |
196 (25.6) |
0.36 |
0.29–0.44 |
<0.0001 |
|
0.44 |
0.35–0.56 |
<0.0001 |
|
| Patient rejection group |
138 (54.3) |
1 (Ref.) |
|
|
<0.0001 |
1 (Ref.) |
|
|
<0.0001 |
| Physician judgment group |
532 (69.2) |
1.48 |
1.23–1.80 |
<0.0001 |
|
1.07 |
0.88–1.31 |
0.49 |
|
| Aortic valve-related death |
| Initial AVR group |
55 (6.3) |
0.17 |
0.12–0.23 |
<0.0001 |
|
0.21 |
0.15–0.30 |
<0.0001 |
|
| Patient rejection group |
84 (36.0) |
1 (Ref.) |
|
|
<0.0001 |
1 (Ref.) |
|
|
<0.0001 |
| Physician judgment group |
260 (43.7) |
1.16 |
0.91–1.49 |
0.25 |
|
0.90 |
0.69–1.18 |
0.46 |
|
| Non-cardiac death |
| Initial AVR group |
70 (10.8) |
0.47 |
0.32–0.71 |
0.0004 |
|
0.58 |
0.38–0.88 |
0.01 |
|
| Patient rejection group |
37 (19.0) |
1 (Ref.) |
|
|
<0.0001 |
1 (Ref.) |
|
|
0.001 |
| Physician judgment group |
155 (30.9) |
1.65 |
1.17–2.40 |
0.004 |
|
1.08 |
0.73–1.58 |
0.71 |
|
| HF hospitalization |
| Initial AVR group |
92 (14.2) |
0.18 |
0.14–0.24 |
<0.0001 |
|
0.22 |
0.16–0.29 |
<0.0001 |
|
| Patient rejection group |
106 (55.3) |
1 (Ref.) |
|
|
<0.0001 |
1 (Ref.) |
|
|
<0.0001 |
| Physician judgment group |
320 (60.1) |
1.14 |
0.92–1.43 |
0.23 |
|
0.94 |
0.74–1.19 |
0.63 |
|
Aortic valve-related death included aortic procedure-related death, sudden death, and death from HF. HF hospitalization was defined as hospitalization for worsening HF requiring intravenous drug therapy. AVR, aortic valve replacement; CI, confidence interval; HF, heart failure; HR, hazard ratio.
In the subgroup analysis stratified by age, the proportion of ‘patient rejection’ among those managed conservatively was numerically higher in patients <75 years of age (29%) than in patients ≥75 years of age (22%) (Table 4).
Table 4.
Risk of the Patient Rejection and Physician Judgment Groups Relative to the Initial AVR Group on the Primary Outcome Measure Stratified by Age
| Variables |
No. of events
(Cumulative
5-year
incidence, %) |
Unadjusted |
Adjusted |
| HR |
95% CI |
P value |
Overall
P value |
Interaction
P value |
HR |
95% CI |
P value |
Overall
P value |
Interaction
P value |
| |
|
|
|
|
|
0.32 |
|
|
|
|
0.39 |
| Age <75 years |
Initial AVR
group (n=427) |
54 (13.0) |
0.33 |
0.20–0.55 |
<0.0001 |
|
|
0.29 |
0.17–0.49 |
<0.0001 |
|
|
Patient
rejection
group (n=55) |
22 (40.7) |
1 (Ref.) |
|
|
<0.0001 |
|
1 (Ref.) |
|
|
0.0006 |
|
Physician
judgment
group (n=133) |
45 (41.7) |
1.03 |
0.62–1.75 |
0.92 |
|
|
0.52 |
0.30–0.93 |
0.03 |
|
|
| Age ≥75 years |
Initial AVR
group (n=478) |
88 (25.9) |
0.24 |
0.18–0.32 |
<0.0001 |
|
|
0.26 |
0.20–0.36 |
<0.0001 |
|
|
Patient
rejection
group (n=201) |
110 (67.2) |
1 (Ref.) |
|
|
<0.0001 |
|
1 (Ref.) |
|
|
<0.0001 |
|
Physician
judgment
group (n=711) |
362 (72.4) |
1.09 |
0.89–1.36 |
0.41 |
|
|
1.07 |
0.85–1.35 |
0.55 |
|
|
Aortic valve-related death included aortic procedure-related death, sudden death, and death from HF. HF hospitalization was defined as hospitalization for worsening HF requiring intravenous drug therapy. Abbreviations as in Table 3.
Cumulative 5-year incidence of the primary outcome measure for patient rejection was markedly higher than in the initial AVR group and was similar to that in the physician judgment group regardless of the age category (age < or ≥75 years) (Figure 4, Table 4,
Supplementary Figures 4–8). After adjusting for potential confounders, the excess risk of the patient rejection group relative to the initial AVR group for the primary outcome measure remained significant regardless of the age category (Table 4). There was no significant interaction between the age category and the risk of the initial AVR group relative to the patient rejection group for the primary outcome measure (Table 4). The adjusted risk of the patient rejection group for the primary outcome measure was significantly higher than that of the physician judgment group in the <75 years age category and was similar to that of the physician judgment group in the ≥75 years age category (Table 4).

In the Cox hazard model incorporating AVR/TAVI during follow-up as a time-dependent covariate, AVR/TAVI during the follow-up group was associated with a significantly lower risk for the primary outcome measure compared with the never AVR/TAVI group (HR 0.27, 95% CI 0.16–0.44, P<0.001;
Supplementary Table 2).
Discussion
The main findings in the present study were: (1) patient rejection was the reason for non-referral to AVR in nearly one-quarter of the symptomatic patients with severe AS who were managed conservatively; and (2) the dismal outcome in patients who refused AVR was similar to that in patients who were not referred to AVR based on physician judgment despite less comorbidities and lower surgical risk scores in the former than in the latter.
In the present study, a conservative management strategy was chosen for more than half of the symptomatic patients with severe AS, which is consistent with previous reports.2–4
Obviously, symptomatic patients with severe AS who are managed conservatively have markedly worse adjusted aortic valve-related clinical outcomes than those who are managed with an initial AVR strategy. The dominant reason for non-referral to AVR was physician judgment based on factors such as very advanced age, improvement of symptoms by medication, prohibitive surgical risk, dementia/frailty, symptoms considered to be related to CAD, and limited life expectancy, etc. Frailty is reported to be associated with a higher rate of poor outcome after both AVR and TAVR.21,22
However, consistent with previous reports,16
patient rejection was the reason for non-referral to AVR in nearly one-quarter of the symptomatic patients with severe AS who were managed conservatively in the present study. It was somewhat surprising that the proportion of ‘patient rejection’ among those managed conservatively was numerically higher in patients aged <75 years than in patients aged ≥75 years. The dismal outcome in patients who refused AVR was similar to that in patients who were not referred to AVR based on physician judgment, despite less comorbidities and lower surgical risk scores in the former than in the latter. We might reasonably speculate that the proportion of patients who were truly contraindicated for AVR was smaller in the patient rejection group than in the physician judgment group. Indeed, the proportion of patients who underwent AVR later during follow-up was higher in the patient rejection group than in the physician judgment group (45% and 25%, respectively). Delaying AVR in symptomatic patients with severe AS might have a detrimental effect on prognosis.17,23
However, in the patient rejection group of this study, almost 80% of patients who underwent AVR/TAVI did so within 2 years after the index echocardiography. Death after AVR/TAVI in the patient rejection group was similar to that in the initial AVR group. Therefore, the high mortality of patients in the patient rejection group was largely driven by the very high mortality of those patients who ultimately did not undergo AVR/TAVI. It is also be important to note that the dismal outcome of patients who refused AVR was consistently seen regardless of the age category (age < or ≥75 years).
Patients refuse AVR for many reasons, which might differ according to age, and social environment. The introduction of TAVI might have already substantially changed patients’ decisions.24
Patients in the patient refusal group were heterogeneous in terms of their risk for AVR. TAVI has already become the firstline treatment in patients with high surgical risk who have refused surgical AVR (SAVR). Recently, 2 randomized trials that enrolled low surgical risk patients clearly demonstrated non-inferiority or even superiority of TAVI relative to SAVR in terms of the hard clinical endpoints.25,26
Considering its less invasive nature, TAVI would also be the preferred option in patients with low surgical risk who refuse SAVR. Nevertheless, the present study results are important because they highlight the profound risk of patient rejection for AVR as well as the risk of delaying AVR, which should be adequately informed to the patients and the family members.
Study Limitations
This study has several important limitations. First, the present analysis was a post-hoc substudy from the retrospective CURRENT AS registry. We did not collect information on the severity of symptoms, frailty, frailty scores such as Clinical Frailty Scale,27
or activities in daily living, all of which would be important in the decision making for the treatment strategy. Second, in this retrospective registry it might sometimes have been very difficult to make a clear distinction between patients who refused AVR and those whom the physician did not recommend AVR. Furthermore, those patients who rejected AVR may have recognized their own morbidities not captured in the database that would make AVR high risk. Third, we do not know the specific reasons for patient rejection, or how strongly the physician recommended AVR. Fourth, we should be cautious in extrapolating the present study results to current clinical practice after the introduction of TAVI.
Conclusions
Patient rejection was the reason for non-referral to AVR in nearly one-quarter of the symptomatic patients with severe AS who were managed conservatively in this retrospective registry. The dismal outcome in patients who refused AVR was similar to that in patients who were not referred to AVR based on physician judgment, despite less comorbidities and lower surgical risk scores in the former than in the latter.
Disclosures
This work was supported by an educational grant from the Research Institute for Production Development (Kyoto, Japan). The authors report that they have no relationships relevant to the contents of this paper to disclose.
Supplementary Files
Please find supplementary file(s);
http://dx.doi.org/10.1253/circj.CJ-19-0247
References
- 1.
Vahanian A, Otto CM. Risk stratification of patients with aortic stenosis. Eur Heart J 2010; 31: 416–423.
- 2.
Nishimura RA, Otto CM, Bonow RO, Carabello BA, Erwin JP 3rd, Guyton RA, et al. 2014 AHA/ACC guideline for the management of patients with valvular heart disease: A report of the American College of Cardiology/American Heart Association Task Force on Practice Guidelines. Circulation 2014; 129: e521–e643.
- 3.
Bonow RO, Brown AS, Gillam LD, Kapadia SR, Kavinsky CJ, Lindman BR, et al. ACC/AATS/AHA/ASE/EACTS/HVS/SCA/SCAI/SCCT/SCMR/STS 2017 appropriate use criteria for the treatment of patients with severe aortic stenosis: A report of the American College of Cardiology Appropriate Use Criteria Task Force, American Association for Thoracic Surgery, American Heart Association, American Society of Echocardiography, European Association for Cardio-thoracic Surgery, Heart Valve Society, Society of Cardiovascular Anesthesiologists, Society for Cardiovascular Angiography and Interventions, Society of Cardiovascular Computed Tomography, Society for Cardiovascular Magnetic Resonance, and Society of Thoracic Surgeons. J Am Soc Echocardiogr 2018; 31: 117–147.
- 4.
Baumgartner H, Falk V, Bax JJ, De Bonis M, Hamm C, Holm PJ, et al. 2017 ESC/EACTS guidelines for the management of valvular heart disease. Eur Heart J 2017; 38: 2739–2791.
- 5.
Otto CM, Prendergast B. Aortic-valve stenosis: From patients at risk to severe valve obstruction. N Engl J Med 2014; 371: 744–756.
- 6.
Ross J Jr, Braunwald E. Aortic stenosis. Circulation 1968; 38: 61–67.
- 7.
Pai RG, Kapoor N, Bansal RC, Varadarajan P. Malignant natural history of asymptomatic severe aortic stenosis: Benefit of aortic valve replacement. Ann Thorac Surg 2006; 82: 2116–2122.
- 8.
Schueler R, Hammerstingl C, Sinning JM, Nickenig G, Omran H. Prognosis of octogenarians with severe aortic valve stenosis at high risk for cardiovascular surgery. Heart 2010; 96: 1831–1836.
- 9.
Gilbert T, Orr W, Banning AP. Surgery for aortic stenosis in severely symptomatic patients older than 80 years: Experience in a single uk centre. Heart 1999; 82: 138–142.
- 10.
Martinez-Selles M, Hortal J, Barrio JM, Ruiz M, Bueno H. Treatment and outcomes of severe cardiac disease with surgical indication in very old patients. Int J Cardiol 2007; 119: 15–20.
- 11.
Jander N, Minners J, Holme I, Gerdts E, Boman K, Brudi P, et al. Outcome of patients with low-gradient “severe” aortic stenosis and preserved ejection fraction. Circulation 2011; 123: 887–895.
- 12.
Rossi A, Temporelli PL, Cicoira M, Gaibazzi N, Cioffi G, Nistri S, et al. Beta-blockers can improve survival in medically-treated patients with severe symptomatic aortic stenosis. Int J Cardiol 2015; 190: 15–17.
- 13.
Martinez-Selles M, Diez-Villanueva P, Sanchez-Sendin D, Carro Hevia A, Gomez Doblas JJ, Garcia de la Villa B, et al. Comorbidity and intervention in octogenarians with severe symptomatic aortic stenosis. Int J Cardiol 2015; 189: 61–66.
- 14.
Kang DH, Jang JY, Park SJ, Kim DH, Yun SC, Song JM, et al. Watchful observation versus early aortic valve replacement for symptomatic patients with normal flow, low-gradient severe aortic stenosis. Heart 2015; 101: 1375–1381.
- 15.
Pellikka PA. Observation for mildly symptomatic normal-flow, low-gradient severe aortic stenosis: Caution advised. Heart 2015; 101: 1349–1350.
- 16.
Bernal E, Ariza-Sole A, Formiga F, Abu-Assi E, Carol A, Galian L, et al. Conservative management in very elderly patients with severe aortic stenosis: Time to change? J Cardiol 2017; 69: 883–887.
- 17.
Taniguchi T, Morimoto T, Shiomi H, Ando K, Kanamori N, Murata K, et al. Initial surgical versus conservative strategies in patients with asymptomatic severe aortic stenosis. J Am Coll Cardiol 2015; 66: 2827–2838.
- 18.
Baumgartner H, Hung J, Bermejo J, Chambers JB, Evangelista A, Griffin BP, et al. Echocardiographic assessment of valve stenosis: EAE/ASE recommendations for clinical practice. J Am Soc Echocardiogr 2009; 22: 1–23; quiz 101–102.
- 19.
Leon MB, Piazza N, Nikolsky E, Blackstone EH, Cutlip DE, Kappetein AP, et al. Standardized endpoint definitions for transcatheter aortic valve implantation clinical trials: A consensus report from the Valve Academic Research Consortium. J Am Coll Cardiol 2011; 57: 253–269.
- 20.
Kappetein AP, Head SJ, Genereux P, Piazza N, van Mieghem NM, Blackstone EH, et al. Updated standardized endpoint definitions for transcatheter aortic valve implantation: The Valve Academic Research Consortium-2 consensus document. J Am Coll Cardiol 2012; 60: 1438–1454.
- 21.
Afilalo J, Mottillo S, Eisenberg MJ, Alexander KP, Noiseux N, Perrault LP, et al. Addition of frailty and disability to cardiac surgery risk scores identifies elderly patients at high risk of mortality or major morbidity. Circ Cardiovasc Qual Outcomes 2012; 5: 222–228.
- 22.
Green P, Arnold SV, Cohen DJ, Kirtane AJ, Kodali SK, Brown DL, et al. Relation of frailty to outcomes after transcatheter aortic valve replacement (from the PARTNER trial). Am J Cardiol 2015; 116: 264–269.
- 23.
Rosenhek R, Binder T, Porenta G, Lang I, Christ G, Schemper M, et al. Predictors of outcome in severe, asymptomatic aortic stenosis. N Engl J Med 2000; 343: 611–617.
- 24.
Makkar RR, Fontana GP, Jilaihawi H, Kapadia S, Pichard AD, Douglas PS, et al. Transcatheter aortic-valve replacement for inoperable severe aortic stenosis. N Engl J Med 2012; 366: 1696–1704.
- 25.
Mack MJ, Leon MB, Thourani VH, Makkar R, Kodali SK, Russo M, et al. Transcatheter aortic-valve replacement with a balloon-expandable valve in low-risk patients. N Engl J Med 2019; 380: 1695–1705.
- 26.
Popma JJ, Deeb GM, Yakubov SJ, Mumtaz M, Gada H, O’Hair D, et al. Transcatheter aortic-valve replacement with a self-expanding valve in low-risk patients. N Engl J Med 2019; 380: 1706–1715.
- 27.
Rockwood K, Song X, MacKnight C, Bergman H, Hogan DB, McDowell I, et al. A global clinical measure of fitness and frailty in elderly people. Can Med Assoc J 2005; 173: 489–495.

