Abstract
Background:
Attenuation-compensated (AC) technique was recently introduced to improve the plaque characterization of optical coherence tomography (OCT). Histological validation demonstrated promising results but the efficacy and reproducibility of this technique for assessing in-vivo tissue composition remains unclear.
Methods and Results:
OCT images portraying native (n=200) and stented (n=200) segments and 31 histological cross-sections were analyzed. AC-OCT appeared superior to conventional (C)-OCT in detecting the external elastic lamina (EEM) borders (76% vs. 65.5%); AC-OCT enabled larger EEM arc detection compared with C-OCT (174.2±58.7° vs. 137.5±57.9°; P<0.001). There was poor agreement between the 2 techniques for detection of lipid in native and lipid and calcific tissue in stented segments (κ range: 0.164–0.466) but the agreement of C-OCT and AC-OCT was high for calcific tissue in native segments (κ=0.825). Intra and interobserver agreement of the 2 analysts was moderate to excellent with C-OCT (κ range: 0.681–0.979) and AC-OCT (κ range: 0.733–0.892) for all tissue types in both native and stented segments. Ex-vivo
analysis demonstrated that C-OCT was superior to AC-OCT (κ=0.545 vs. κ=0.296) for the detection of the lipid component in native segments.
Conclusions:
The AC technique allows better delineation of the EEM but it remains inferior for lipid pool detection and neointima characterization. Combined AC- and C-OCT imaging may provide additional value for complete assessment of plaque and neointima characteristics.
Optical coherence tomography (OCT) provides high-resolution cross-sectional images that enable accurate assessment of lumen pathology and dimensions, and identification of plaque micro-characteristics associated with increased vulnerability and characterization of its composition. However, the superior resolution of OCT comes at the cost of limited penetration (1–2 mm), which often does not allow for complete assessment of the plaque, quantification of its burden and accurate characterization of the different tissue types, especially in deeply embedded tissues.1
Editorial p 13
The attenuation-compensated (AC) technique has been recently introduced to correct light attenuation and enhance the contrast and penetration depth of the OCT signal.2,3
A preliminary validation study of this approach to OCT data acquired ex vivo demonstrated that AC-OCT increases image contrast at the expense of a reduction of the signal-to-noise ratio and it could facilitate differentiation of lipid from calcific tissue and enhance detection of the external elastic membrane (EEM) borders. However, that analysis included only a small set of images acquired ex vivo and focused on evaluation of the intensity characteristics of different tissues types in conventional (C-OCT) and AC-OCT images rather than on assessment of the efficacy of expert analysts to evaluate plaque morphology in these imaging sets. In the present study, we aim to compare for the first time, in a large set of images acquired in vivo, the estimations of C-OCT and AC-OCT images and the reproducibility of expert analysts in detecting the lumen, stent and EEM borders and characterizing plaque composition in native and stented segments. In addition, we examined the efficacy of C-OCT and AC-OCT in assessing plaque morphology and detecting the presence and extent of lipid tissue using histology as the gold standard in an ex-vivo study.
Methods
In Vivo OCT Imaging
We analyzed data from 37 patients who underwent OCT imaging using a C7-XRTM
or OPTIS system (St. Jude Medical, St. Paul, MN, USA) for clinical purposes. The pullback of the OCT catheter (DragonflyTM, St. Jude Medical) was performed during contrast agent injection at a constant speed of 20 mm/s. From the acquired images, frames portraying native (n=200) and stented segments (n=200) that were at least 1 mm apart were randomly selected and transferred to an offline workstation for further analysis.
Ex Vivo OCT Imaging
OCT imaging was performed ex vivo in 6 autopsied hearts randomly selected from the Bristol Heart Valve Bank.4
The hearts were excised within 48 h of postmortem and stored at 4℃. A guide catheter was introduced into the studied arteries and fixed in position with sutures; the vessel was perfused with phosphate-buffered saline and the intracoronary pressure was maintained at 100 mmHg. OCT imaging was performed using a C7-XR imaging system at a constant speed of 20 mm/s. The acquired data were stored in DICOM format and transferred to a workstation for further analysis.
Histological Analysis
The studied vessels were pressure-fixed with buffered formalin at 100 mmHg for 15 min, then excised from the heart and fixed with buffered formalin for 24 h and cut into 3-mm lengths. Sections were cut from the 3-mm segments through the entire block from the proximal face of each block and stained with hematoxylin and eosin, elastica van Gieson (EVG), Movat’s pentachrome, cluster of differentiation 68 (CD68) and smooth muscle cell α-actin stains at regular intervals and matched to OCT frames using anatomical landmarks. Annotation of the presence and circumferential extent of lipid tissue was performed independently by an expert blinded to the OCT data. Within the available dataset, calcified plaques were not represented frequently enough to perform analysis of this feature.
OCT Post-Processing and Data Analysis
The AC technique has been described in detail elsewhere. In brief, this approach assumes that light attenuation and backscatter are proportional and that the OCT signal fully attenuates at an infinite depth. Based on this assumption, image intensity is amplified based on the equation:
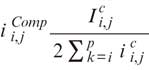
where,  is the compensated image,
  is the
amplification factor for every A-line (i=0, on the top of the image and
i=p
on the bottom of the image) and C is a component that regulates contrast and noise (high C values are associated with increased and low with reduced contrast and noise). Optimization of the compensation parameters has already been performed in 20 regions of interest from 20 patients.2
Based on the reported results, in the present analysis we used a C value of 2 and an N value of 4, where N is the compression exponent that regulates the dynamic range of the AC image.
The frames included in the present analysis were extracted from the OCT pullbacks using ImageJ, and the AC images were then generated using Reflectivity 3.2 (Opthalmic Engineering & Innovation Laboratory, National University of Singapore, Singapore), a medical image post-processing software designed for this purpose. The C-OCT and AC-OCT images acquired in vivo were analyzed offline by 2 expert analysts. To examine the intraobserver variability, analysis was done twice by the 1st analyst (AR) within a 2-month interval and his estimations were compared with the annotations of the 2nd analyst (CVB) to report interobserver variability.
In each cross-section, the lumen border was detected and the circumferential extent of the EEM, when this was visible, was defined. In frames portraying stented segments, the stent borders were also annotated. In addition, the presence of thrombus, calcific tissue with its area and circumferential extent, and lipid tissue and its circumferential extent, as well as the presence of cholesterol crystals, neovessels, and macrophage accumulation were reported in the vessel wall or in neointimal tissue in stented segments in the C-OCT and AC-OCT images. Tissue characterization was performed using the same criteria for the C-OCT and AC-OCT images. Lipid tissue was defined as a signal-poor region with diffuse borders, and calcific tissue was a well-delineated, signal-poor region with sharp borders.5
The border of the fibrous cap over lipid tissue was segmented using semi-automated software (QCM-CMS) and the minimum cap thickness was estimated.6
Thrombus was defined as a mass that was floating or was attached to the lumen border; macrophage accumulation was defined as a signal-rich distinct or punctuated region with strong signal attenuation behind it;5
neovessels were small vesicular structures with a diameter ≤300 μm, not connected with the lumen and identified within the vessel wall or the neointima in 3 consecutive frames;7,8
cholesterol crystals where characterized as thin, signal-rich linear regions.5
Statistical Analysis
Numerical values are presented as mean±standard deviation and categorical variables as absolute values and percentages. Inter- and intraobserver reliability was assessed by Cohen’s kappa (κ) for categorical variables and intraclass correlation (ICC) for numerical variables. Linear regression and Bland-Altman analysis were performed to examine the agreement between the analysts’ estimations. Statistical analysis was performed with SPSS (IBM SPSS statistics, v23.0, Armonk, NY, USA). P<0.05 was considered statistically significant.
Results
Baseline Characteristics
In each patient a single vessel was studied using OCT; the baseline characteristics of the patients included in the study are summarized in
Table 1. Most of the studied patients were male, current smokers, suffered from hypercholesterolemia and were admitted with an acute coronary syndrome. The incidence of hypertension was higher in the patients who underwent OCT imaging in the stented segments; these patients were also more likely to have suffered a previous myocardial infarction. Otherwise, there were no differences in the baseline demographics of the patients who had OCT of native and those who had OCT of the stented segments.
Table 1.
Baseline Characteristics of the Study Patients
| |
Native vessels
(n=16) |
Stented vessels
(n=21) |
P value |
| Age (years) |
57.9±8.4 |
59.8±7.7 |
0.690 |
| Sex (male) |
14 (87.5%) |
15 (71.4%) |
0.271 |
| Current smoker |
10 (62.5%) |
11 (52.3%) |
0.546 |
| Comorbidities |
| Diabetes mellitus |
5 (31.3%) |
9 (42.9%) |
0.497 |
| Hypertension |
5 (31.3%) |
15 (71.5%) |
0.014 |
| Hypercholesterolemia |
14 (87.5%) |
15 (71.5%) |
0.188 |
| Previous MI |
2 (12.5%) |
10 (47.6%) |
0.029 |
| Clinical presentation |
|
|
0.199 |
| ACS |
9 (56.2%) |
16 (76.2%) |
|
| Stable angina |
7 (43.8%) |
5 (23.8%) |
|
| Studied vessels |
|
|
0.114 |
| LAD |
6 (37.5%) |
14 (66.7%) |
|
| LCx |
5 (31.3%) |
5 (23.8%) |
|
| RCA |
5 (31.3%) |
2 (9.5%) |
|
ACS, acute coronary syndrome; LAD, left anterior descending artery; LCx, left circumflex artery; MI, myocardial infarction; RCA, right coronary artery.
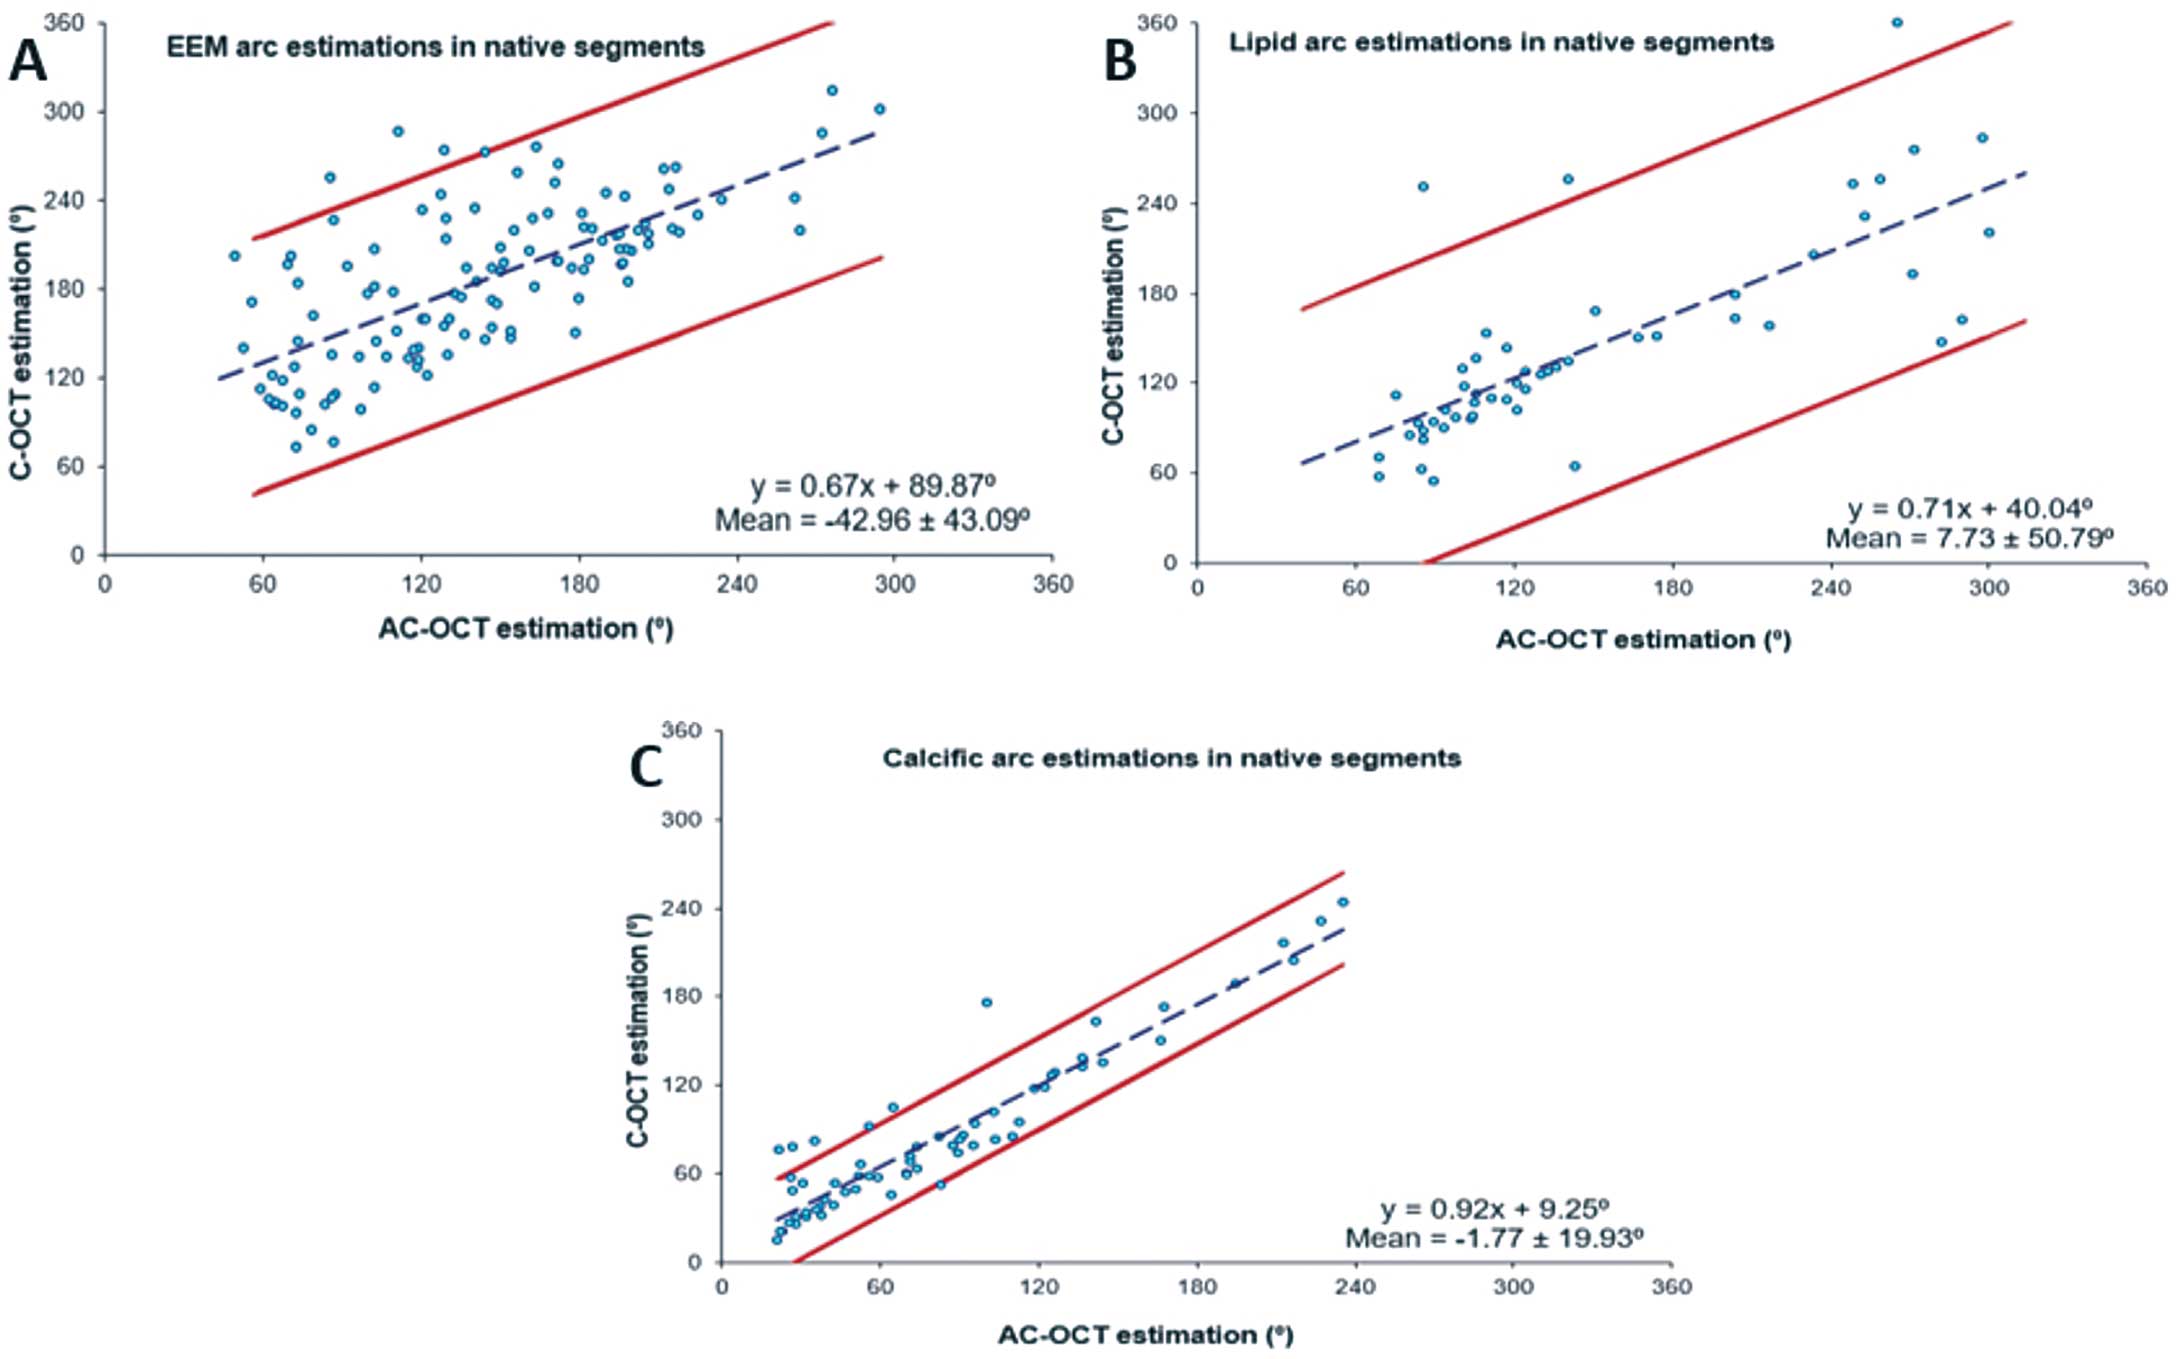
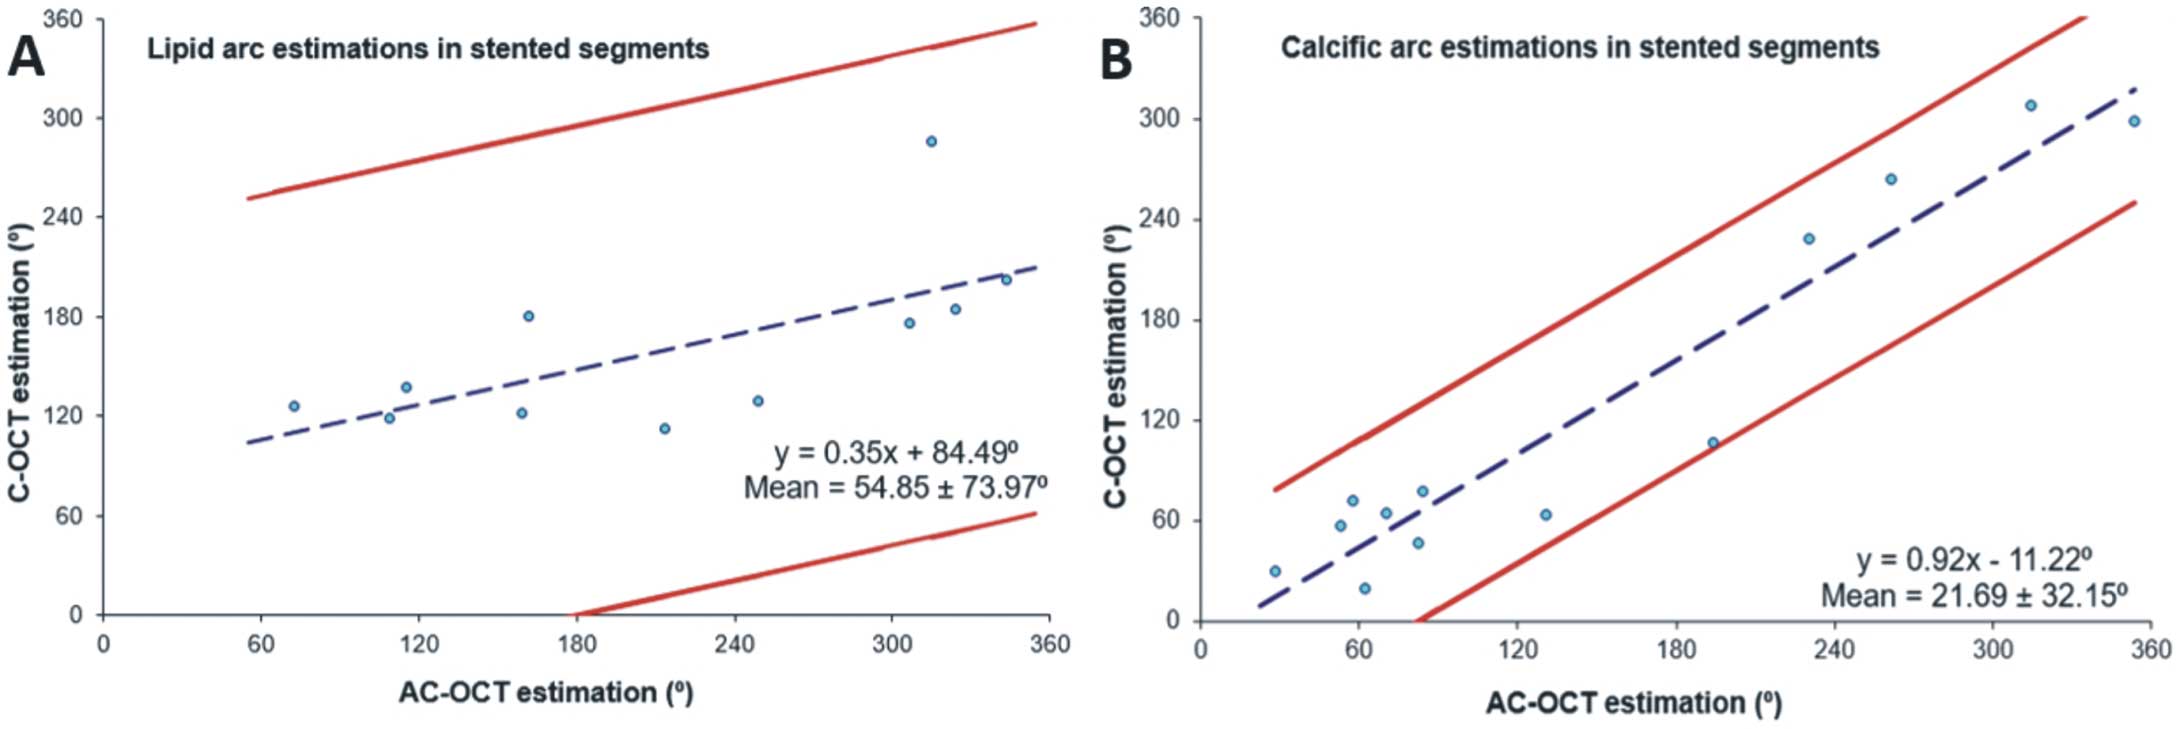
There was excellent correlation (ICC >0.900) between the estimations of the 1st analyst for the lumen, thrombus extent, stent borders and calcific tissue extent in the native and stented segments in the C-OCT and AC-OCT images (Table 2). Detection of the EEM was possible in 65.5% of the cases in the C-OCT images and in 76.0% in the AC-OCT (κ=0.601, P<0.001). In addition, AC-OCT images allowed a larger EEM arc to be detected (174.2±58.7° vs. 137.5±57.9°; ICC=0.831, P<0.001). Moreover, annotation of the calcific tissue area was feasible in 99% of cases in which calcific tissue was detected with AC-OCT; conversely, with C-OCT annotation of the calcific tissue area was possible in only 83% of cases. A weak agreement was noted between the estimations of the 1st analyst in C-OCT and AC-OCT for the presence of lipid tissue in native and stented segments, and for the calcific tissue in stented segments, with AC-OCT underestimating their presence especially in stented segments (κ range: 0.166–0.466;
Figures 1, 2). In addition, AC-OCT did not enable detection of plaque micro-characteristics seen with C-OCT, such as the presence of macrophages and the thickness of the fibrous cap, and the incidence of both cholesterol crystals (n=8, 4%) and neovessels (n=5, 2.5%) was too small in the C-OCT images to allow us to reach safe conclusions (Supplementary Figure 1). The linear regression and Bland-Altman analyses of the C-OCT and AC-OCT estimations in native and stented segments are shown in
Figure 3
and
Figure 4
respectively.
Table 2.
Comparison of C-OCT and AC-OCT in Native and Stented Vessels for Lumen and Stent Area, Calcific Tissue Circumferential Extent and Area, Lipid Tissue Circumferential Extent, Minimum Cap Thickness, Macrophage Accumulation and Thrombus Arc
| |
C-OCT
(n) |
C-OCT
estimation
(mean±SD) |
AC-OCT
(n) |
AC-OCT
estimation
(mean±SD) |
Kappa
(κ) |
P value |
ICC |
P value |
| Native vessels |
| Lumen area (mm2) |
200 |
4.80±2.21 |
200 |
4.82±2.21 |
– |
– |
0.988 |
<0.001 |
| EEM arc (°) |
131 |
137.5±57.9 |
152 |
174.2±58.7 |
0.601 |
<0.001 |
0.831 |
<0.001 |
| Calcium arc (°) |
69 |
79.4±54.6 |
73 |
75.8±55.0 |
0.825 |
<0.001 |
0.968 |
<0.001 |
| Calcific tissue area (mm2) |
57 |
1.01±0.80 |
72 |
1.00±0.90 |
– |
– |
0.763 |
<0.001 |
| Lipid arc (°) |
96 |
132.9±63.6 |
62 |
135.7±65.6 |
0.470 |
<0.001 |
0.861 |
<0.001 |
| Minimum cap thickness (μm) |
96 |
135±85 |
– |
– |
– |
– |
– |
– |
| Macrophages arc (°) |
20 |
36.6±20.7 |
– |
– |
– |
– |
– |
– |
| Stented vessels |
| Lumen area (mm2) |
200 |
3.40±1.82 |
200 |
3.34±1.83 |
– |
– |
0.992 |
<0.001 |
| Thrombus arc (°) |
17 |
85.0±56.9 |
19 |
65.2±43.2 |
0.817 |
<0.001 |
0.903 |
0.002 |
| Stent area (mm2) |
190 |
6.92±2.16 |
186 |
6.61±2.13 |
0.646 |
<0.001 |
0.986 |
<0.001 |
| Calcium arc (°) |
27 |
109.0±88.5 |
22 |
98.6±90.2 |
0.466 |
<0.001 |
0.978 |
<0.001 |
| Calcium tissue area (mm2) |
27 |
0.67±0.56 |
22 |
0.54±0.57 |
– |
– |
0.985 |
<0.001 |
| Lipid arc (°) |
73 |
160.2±73.4 |
13 |
151.1±53.9 |
0.164 |
<0.001 |
0.711 |
0.031 |
| Minimum cap thickness (μm) |
73 |
167±112 |
– |
– |
– |
– |
– |
– |
| Macrophages arc (°) |
13 |
61.6±34.3 |
– |
– |
– |
– |
– |
– |
AC, attenuation-compensated; C, conventional; EEM, external elastic lamina; ICC, intraclass correlation; OCT, optical coherence tomography.

The reproducibility of the 2 analysts in C-OCT and AC-OCT of native segments is shown in
Table 3A. Excellent intraobserver agreement was noted for the presence of the EEM and calcific tissue in the C-OCT and the AC-OCT images, while the intraobserver agreement was moderate for lipid extent and the presence of macrophage accumulations. The interobserver agreement was excellent in the C-OCT images for the EEM border and calcific tissue, while for the presence of lipid tissue and macrophage accumulations the agreement was moderate. In the AC-OCT images, excellent interobserver agreement was noted for the lumen and calcific tissue and moderate agreement for the EEM and lipid tissue.
Table 3.
(A) Inter- and Intra-Observer Agreement of Two Analysts for Lumen Area, EEM Arc, Calcific Tissue Circumferential Extent and Area, Lipid Tissue Circumferential Extent, Minimum Cap Thickness and Macrophage Accumulation in Native Segments Analyzed by C-OCT and AC-OCT, (B) Inter- and Intra-Observer Agreement for the Lumen and Stent Areas, Calcific Tissue Circumferential Extent and Area, Lipid Tissue Circumferential Extent, Minimum Cap Thickness, Macrophage Accumulation and Thrombus Arc in Stented Segments Analyzed by C-OCT and AC-OCT
| (A) |
Kappa (κ) |
P value |
Mean±SD |
ICC |
P value |
| Conventional OCT |
| Lumen area (mm2) |
| Intraobserver variability |
– |
– |
0.05±0.25 |
0.997 |
<0.001 |
| Interobserver variability |
– |
– |
0.01±0.27 |
0.996 |
<0.001 |
| EEM arc (°) |
| Intraobserver variability |
0.815 |
<0.001 |
1.2±19.9 |
0.969 |
<0.001 |
| Interobserver variability |
0.832 |
<0.001 |
−4.2±25.1 |
0.949 |
<0.001 |
| Calcium arc (°) |
| Intraobserver variability |
0.978 |
<0.001 |
−0.6±15.6 |
0.994 |
<0.001 |
| Interobserver variability |
0.922 |
<0.001 |
−1.8±7.7 |
0.977 |
<0.001 |
| Calcific tissue area (mm2) |
| Intraobserver variability |
– |
– |
−0.05±0.14 |
0.992 |
<0.001 |
| Interobserver variability |
– |
– |
−0.03±0.18 |
0.981 |
<0.001 |
| Lipid arc (°) |
| Intraobserver variability |
0.760 |
<0.001 |
−0.1±10.4 |
0.993 |
<0.001 |
| Interobserver variability |
0.779 |
<0.001 |
−2.4±21.1 |
0.971 |
<0.001 |
| Minimum cap thickness (μm) |
| Intraobserver variability |
0.760 |
<0.001 |
2±20 |
0.977 |
<0.001 |
| Interobserver variability |
0.779 |
<0.001 |
−10±38 |
0.920 |
<0.001 |
| Macrophages arc (°) |
| Intraobserver variability |
0.775 |
<0.001 |
2.9±6.1 |
0.978 |
<0.001 |
| Interobserver variability |
0.681 |
<0.001 |
3.9±14.3 |
0.853 |
<0.001 |
| Attenuation-compensated OCT |
| Lumen area (mm2) |
| Intraobserver variability |
– |
– |
0.01±0.05 |
1.000 |
<0.001 |
| Interobserver variability |
– |
– |
0.03±0.10 |
1.000 |
<0.001 |
| EEM arc (°) |
| Intraobserver variability |
0.820 |
<0.001 |
−1.7±20.6 |
0.969 |
<0.001 |
| Interobserver variability |
0.746 |
<0.001 |
−1.9±23.8 |
0.957 |
<0.001 |
| Calcium arc (°) |
| Intraobserver variability |
0.892 |
<0.001 |
4.3±17.4 |
0.941 |
<0.001 |
| Interobserver variability |
0.857 |
<0.001 |
1.6±13.0 |
0.923 |
<0.001 |
| Calcific tissue area (mm2) |
| Intraobserver variability |
– |
– |
0.04±0.18 |
0.990 |
<0.001 |
| Interobserver variability |
– |
– |
0.01±0.18 |
0.987 |
<0.001 |
| Lipid arc (°) |
| Intraobserver variability |
0.778 |
<0.001 |
−2.6±17.4 |
0.982 |
<0.001 |
| Interobserver variability |
0.766 |
<0.001 |
−9.8±22.8 |
0.841 |
<0.001 |
| (B) |
Kappa (κ) |
P value |
Mean±SD |
ICC |
P value |
| Conventional OCT |
| Lumen area (mm2) |
| Intraobserver variability |
– |
– |
0.08±0.55 |
0.975 |
<0.001 |
| Interobserver variability |
– |
– |
0.07±0.54 |
0.975 |
<0.001 |
| Thrombus arc (°) |
| Intraobserver variability |
0.906 |
<0.001 |
1.7±6.9 |
0.996 |
<0.001 |
| Interobserver variability |
0.851 |
<0.001 |
−0.1±10.9 |
0.990 |
<0.001 |
| Stent area (mm2) |
| Intraobserver variability |
0.834 |
<0.001 |
0.11±0.81 |
0.954 |
<0.001 |
| Interobserver variability |
0.904 |
<0.001 |
0.19±0.82 |
0.944 |
<0.001 |
| Calcium arc (°) |
| Intraobserver variability |
0.979 |
<0.001 |
−1.1±10.7 |
0.985 |
<0.001 |
| Interobserver variability |
0.867 |
<0.001 |
−2.0±13.2 |
0.988 |
<0.001 |
| Calcific tissue area (mm2) |
| Intraobserver variability |
– |
– |
0.00±0.12 |
0.988 |
<0.001 |
| Interobserver variability |
– |
– |
0.15±0.29 |
0.986 |
<0.001 |
| Lipid arc (°) |
| Intraobserver variability |
0.894 |
<0.001 |
−2.5±16.9 |
0.987 |
<0.001 |
| Interobserver variability |
0.686 |
<0.001 |
−7.3±26.1 |
0.938 |
<0.001 |
| Minimum cap thickness (μm) |
| Intraobserver variability |
0.894 |
<0.001 |
0±20 |
0.986 |
<0.001 |
| Interobserver variability |
0.686 |
<0.001 |
11±33 |
0.975 |
<0.001 |
| Macrophages arc (°) |
| Intraobserver variability |
0.957 |
<0.001 |
6.5±11.6 |
0.971 |
<0.001 |
| Interobserver variability |
0.770 |
<0.001 |
4.2±7.3 |
0.994 |
<0.001 |
| Attenuation-compensated OCT |
| Lumen area (mm2) |
| Intraobserver variability |
– |
– |
0.01±0.09 |
0.999 |
<0.001 |
| Interobserver variability |
– |
– |
−0.02±0.08 |
1.000 |
<0.001 |
| Thrombus arc (°) |
| Intraobserver variability |
0.878 |
<0.001 |
0.1±4.1 |
0.998 |
<0.001 |
| Interobserver variability |
0.878 |
<0.001 |
−1.5±6.3 |
0.972 |
<0.001 |
| Stent area (mm2) |
| Intraobserver variability |
0.856 |
<0.001 |
−0.02±0.25 |
0.997 |
<0.001 |
| Interobserver variability |
0.856 |
<0.001 |
−0.01±0.24 |
0.997 |
<0.001 |
| Calcium arc (°) |
| Intraobserver variability |
0.733 |
<0.001 |
−7.0±23.6 |
0.985 |
<0.001 |
| Interobserver variability |
0.778 |
<0.001 |
−10.0±22.8 |
0.988 |
<0.001 |
| Calcific tissue area (mm2) |
| Intraobserver variability |
– |
– |
0.02±0.18 |
0.978 |
<0.001 |
| Interobserver variability |
– |
– |
0.01±0.21 |
0.971 |
<0.001 |
| Lipid arc (°) |
| Intraobserver variability |
0.889 |
<0.001 |
4.1±21.3 |
0.956 |
<0.001 |
| Interobserver variability |
0.846 |
<0.001 |
1.0±18.1 |
0.966 |
<0.001 |
EEM, external elastic lamina; ICC, intraclass correlation; OCT, optical coherence tomography.
A high ICC (>0.900) was noted between the annotations of the expert analyst for all the studied variables in both the C- and AC-OCT images. The ICC was moderate between the estimations of the 2 analysts for the extent of macrophages in the C-OCT images and for the lipid circumferential extent in the AC-OCT images, while the rest of the studied variables showed excellent ICC (>0.900). The linear regression and Bland-Altman analyses for the estimations of the 1st analyst and for the estimations of the 2 analysts for the EEM and plaque composition in C-OCT and AC-OCT images are shown in
Supplementary Figure 2
and
Supplementary Figure 3.
Stented Coronary Arteries
The reproducibility of the 2 analysts in the C-OCT and AC-OCT images of stented segments are shown in
Table 3B. Excellent intraobserver agreement was noted for the presence of thrombus and lipid tissue in both the C-OCT and AC-OCT images and for calcific tissue and macrophage accumulations in the C-OCT images (κ>0.900). However, the interobserver agreement was moderate for the presence of calcific tissue in the AC-OCT images.
The interobserver agreement was excellent for the presence of thrombus and calcific tissue and moderate for the presence of lipid and macrophage accumulations in the C-OCT images, but in the AC-OCT images it was excellent for the presence of thrombus and lipid tissue and moderate for the calcific tissue.
Excellent inter- and intraobserver agreement was noted for all the studied variables in the C-OCT and AC-OCT images (ICC >0.948, in all estimations). The linear regression analysis for the estimations of the 1st analyst and for the estimations of the 2 analysts for the lipid and calcific tissue arc in the C-OCT and AC-OCT images are shown in
Supplementary Figure 4
and
Supplementary Figure 5.
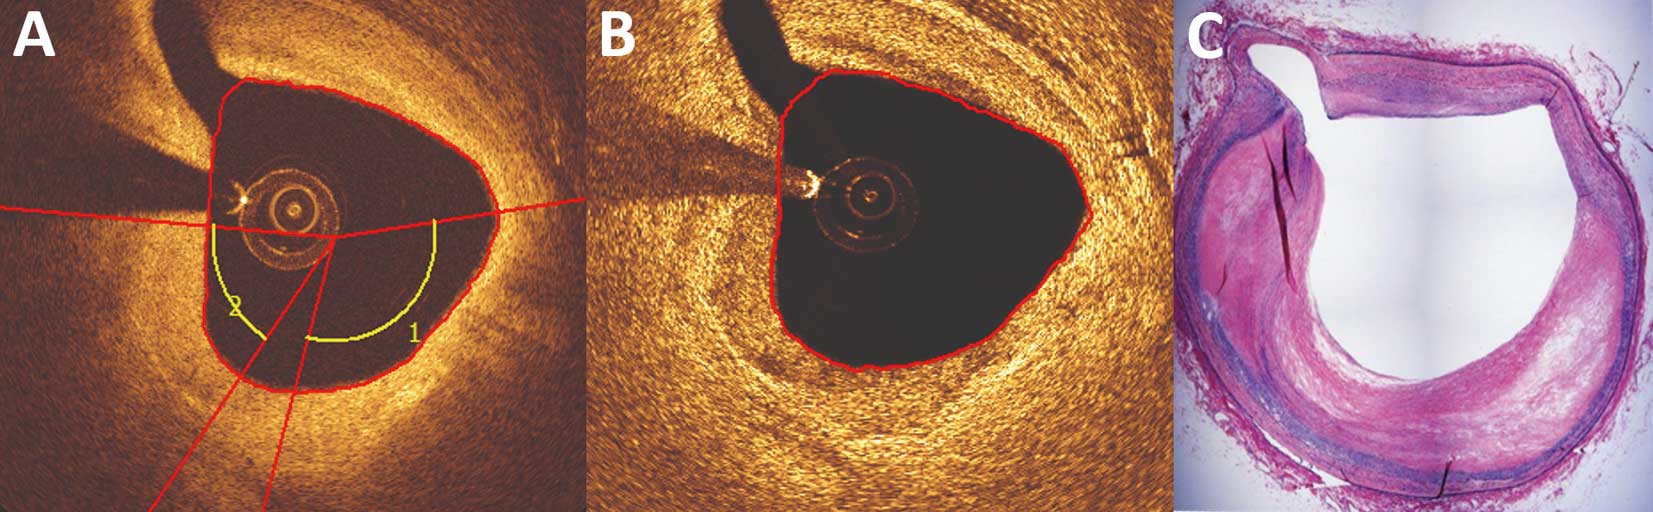
Histological Validation of Lipid-Rich Plaques
In view of the weak agreement between the C-OCT and AC-OCT images for native segments, an ex-vivo study that included 31 matched histological and OCT images was performed. C-OCT accurately identified 12 of the 13 lipid-rich plaques, but erroneously classified 6 fibrotic lesions as lipid-rich. AC-OCT was less effective in detecting lipid-rich plaques, as it correctly identified only 6 of the 13 lipid-rich plaque and misclassified 3 fibrotic lesions as lipid-rich (Figure 5). The agreement between C-OCT and histology for the detection of lipid-rich plaques was moderate (κ=0.545, P=0.002) and the agreement between AC-OCT and histology for the detection of lipid tissue was weak (κ=0.296, P=0.091). The ICC between C-OCT and histology for the circumferential extent of lipid tissue was 0.874 (P<0.001) and between AC-OCT and histology was only 0.514 (P<0.001).
Discussion
The present study evaluated, in vivo and ex vivo, the diagnostic accuracy of AC-OCT in assessing lumen, stent, EEM, plaque morphology and vessel micro-characteristics against that of C-OCT imaging. We found that (1) AC-OCT enabled accurate detection of the lumen and stent borders and had a higher efficacy in detecting the EEM border and calcific tissue area, (2) there was a high agreement between the 2 methods for the presence and lateral extent of calcific tissue in native segments but the agreement for lipid tissue in native and for lipid and calcific tissue in stented segments was weak, (3) AC-OCT was unable to detect plaque micro-characteristics associated with increased vulnerability or to measure the thickness of the fibrous cap, and (4) when histology was used as the gold standard to assess the accuracy of both techniques in characterizing plaque composition, AC-OCT was inferior to C-OCT in detecting the presence of lipid tissue.
OCT with its high resolution enables detailed assessment of luminal pathology and has been extensively used to guide percutaneous coronary interventions (PCI). Randomized control trials have demonstrated the superiority of OCT over intravascular ultrasound (IVUS) in assessing post-procedural results and identifying features associated with poor outcomes, but have also revealed the limitations of OCT.9–11
Two studies comparing IVUS and OCT in guiding stent implantation showed that IVUS guidance was associated with implantation of larger stents and a larger minimum stent area,10,11
but the ILUMIEN III study, which used the EEM diameter to define stent diameter, showed no significant difference in minimum stent area between the OCT- and IVUS-guided groups (5.79 mm2
vs. 5.89 mm2, P=0.42).9
In the ILUMIEN III study, the EEM border was visible in the vast majority of the patients undergoing OCT-guided PCI; however this is often not possible in long, diffuse atherosclerotic lesions, which were excluded from ILUMIEN III.9
To overcome this limitation, the AC-OCT technique was recently introduced to increase the penetration depth of the OCT signal and enable delineation of the EEM in diseased segments. Indeed, in the study by Teo et al, AC-OCT allowed more frequent full EEM contour detection than C-OCT by 2.5-fold.2
Those authors also reported that AC-OCT was able to classify plaque composition with improved sensitivity and specificity over C-OCT (89% and 94% vs. 84% and 92%, respectively).2
The first histological studies assessing the efficacy of C-OCT imaging in assessing plaque morphology showed that this technique had excellent accuracy in detecting different tissue types.12,13
However, more recent reports have raised concerns about the accuracy of C-OCT imaging in detecting plaque composition. In the study by Rieber et al,14
which included 17 ex vivo coronary arteries, C-OCT had moderate agreement for correctly identifying different plaque types (κ=0.67), but 1 year later, Manfrini et al1
demonstrated that one of the most common causes of C-OCT misinterpretation was the limited imaging depth, which does not allow accurate differentiation of lipid from calcific tissue when it is deeply embedded behind thick fibrous tissue. The limited accuracy of C-OCT in assessing plaque composition, as well as the fact that it cannot quantify plaque burden in heavily disease segments, are at least partially responsible for the limited efficacy of this modality in detecting vulnerable plaques that are likely to progress and cause cardiovascular events. Indeed, in the CLIMA study, which included 1,003 patients who had C-OCT imaging of the left anterior descending artery, C-OCT-derived plaque characteristics and in particular, the presence of an minimum lumen area <3.5 mm2, thin cap fibroatheroma phenotype, a lipid arc >180° and macrophage accumulation enabled prediction of the combined endpoint of cardiac death and target segment revascularization with a positive predictive value of 18.9%.15
In the present study, we demonstrated that the AC technique enhances the efficacy of EEM border detection (76% vs. 65.5%) compared with C-OCT; using AC-OCT the EEM border was visible for an arc >180° in 76 (38%) images whereas in the C-OCT images it was visible in just 34 (17%). In addition, we found that AC-OCT was more effective than C-OCT in assessing the calcific tissue area. These findings highlight the potential value of this technique in guiding PCI. AC-OCT could be useful in selecting the correct stent diameter, because it is superior to C-OCT in assessing the EEM area and in identifying calcified lesions that can be treated without the use of debulking techniques, as calcific thickness is a predictor of stent under-expansion.9,16
Further research is required that will provide proof of the concept, and examine, in a large number of lesions, the value of combined AC-OCT/C-OCT over standalone C-OCT imaging in guiding PCI.
On the other hand, AC-OCT falls short in detecting the lipid component. In vivo image analysis demonstrated poor agreement between the estimations of C-OCT and AC-OCT for the lipid component, and ex-vivo validation showed that C-OCT was superior to AC-OCT for the detection of lipid tissue. These findings are in contrast to the results of Teo et al,2
but the discrepancy could be attributed to the fact that in the previous report, plaque composition was based on a computation of the tissue index defined as the ratio of the normalized intensity of the tissue to the lumen intensity, whereas we based plaque characterization on a visual estimation of plaque characteristics using established C-OCT criteria.17
We reported high intra and interobserver agreement in AC-OCT, which was comparable to C-OCT, suggesting that visual analysis of AC-OCT images is feasible and reproducible; however, this approach cannot accurately detect plaque composition. This may be attributed to the increase in noise seen in AC-OCT images, as well as to the fact that the AC technique enhances the OCT signal and thus masks the sudden signal drop-off that is characteristic of lipid tissue, hence impeding accurate differentiation of lipid from fibrotic tissue.
Our analysis also showed that AC-OCT did not enable accurate characterization of neointimal composition in stented segments. This could be at least partially attributed to the stent strut edge artefacts in AC-OCT images that are directed towards the OCT catheter and mask the neointimal tissue. In our study, the incidence of calcific and lipid tissue in AC-OCT was 19% and 82% lower than their incidences in C-OCT. Therefore, AC-OCT should not be considered for the assessment of neointimal composition in stented segments.
Another limitation of AC-OCT was its inability to detect plaque micro-characteristics associated with increased vulnerability, such as macrophages or cholesterol streaks, and it did not allow measurement of the cap thickness.18,19
Considering these limitations, standalone AC-OCT cannot be recommended for assessing plaque vulnerability but can be combined with C-OCT for more complete assessment of native segments and quantification of plaque burden.
Study Limitations
A significant limitation of the present analysis was the absence of calcific tissue in the matched histological and OCT cross-sections, which did not allow evaluation of the efficacy of AC-OCT in detecting the calcific component. However, the high agreement observed between C-OCT and AC-OCT estimations indicated that both approaches had similar efficacy in detecting calcific tissue. Moreover, the incidence of neovessels and cholesterol crystals was low in C-OCT images and thus it was not possible to examine in detail the efficacy of AC-OCT in detecting these features. However, considering the increased noise seen with AC-OCT and judging from the few cases in which cholesterol crystals and neovessels were present it appears that AC-OCT has limited value in detecting cholesterol crystals but can identify the presence of neovessels.
Conclusions
The AC technique had a superior accuracy for delineation of EEM borders compared with C-OCT, which may facilitate optimal stent deployment and more accurate quantification of plaque burden. This novel technique, however, appears to underperform compared with C-OCT in detecting lipid tissue and plaque micro-characteristics in native segments and in assessing neointimal composition in stented segments. Combined C-OCT and AC-OCT imaging may enhance the value of OCT in the assessment of plaque pathology and treatment planning.
Conflicts of Interests
L.R. has received speaker fees and research grants from Abbott Vascular. N.F. holds an appointment with Phillips. All other authors have no conflicts of interests to declare.
Supplementary Files
Please find supplementary file(s);
http://dx.doi.org/10.1253/circj.CJ-19-0630
References
- 1.
Manfrini O, Mont E, Leone O, Arbustini E, Eusebi V, Virmani R, et al. Sources of error and interpretation of plaque morphology by optical coherence tomography. Am J Cardiol 2006; 98: 156–159.
- 2.
Teo JC, Foin N, Otsuka F, Bulluck H, Fam JM, Wong P, et al. Optimization of coronary optical coherence tomography imaging using the attenuation-compensated technique: A validation study. Eur Heart J Cardiovasc Imag 2017; 18: 880–887.
- 3.
Lee R, Foin N, Otsuka F, Wong P, Mari JM, Joner M, et al. Intravascular assessment of arterial disease using compensated OCT in comparison with histology. JACC Cardiovasc Imaging 2016; 9: 321–322.
- 4.
Gnanadesigan M, Hussain AS, White S, Scoltock S, Baumbach A, van der Steen AF, et al. Optical coherence tomography attenuation imaging for lipid core detection: An ex-vivo validation study. Int J Cardiovasc Imag 2017; 33: 5–11.
- 5.
Tearney GJ, Regar E, Akasaka T, Adriaenssens T, Barlis P, Bezerra HG, et al. Consensus standards for acquisition, measurement, and reporting of intravascular optical coherence tomography studies: A report from the International Working Group for Intravascular Optical Coherence Tomography Standardization and Validation. J Am Coll Cardiol 2012; 59: 1058–1072.
- 6.
Radu MD, Yamaji K, Garcia-Garcia HM, Zaugg S, Taniwaki M, Koskinas KC, et al. Variability in the measurement of minimum fibrous cap thickness and reproducibility of fibroatheroma classification by optical coherence tomography using manual versus semi-automatic assessment. EuroIntervention 2016; 12: e987–e997.
- 7.
Vorpahl M, Nakano M, Virmani R. Small black holes in optical frequency domain imaging matches intravascular neoangiogenesis formation in histology. Eur Heart J 2010; 31: 1889.
- 8.
Uemura S, Ishigami K, Soeda T, Okayama S, Sung JH, Nakagawa H, et al. Thin-cap fibroatheroma and microchannel findings in optical coherence tomography correlate with subsequent progression of coronary atheromatous plaques. Eur Heart J 2012; 33: 78–85.
- 9.
Ali ZA, Maehara A, Genereux P, Shlofmitz RA, Fabbiocchi F, Nazif TM, et al. Optical coherence tomography compared with intravascular ultrasound and with angiography to guide coronary stent implantation (ILUMIEN III: OPTIMIZE PCI): A randomised controlled trial. Lancet 2016; 388: 2618–2628.
- 10.
Habara M, Nasu K, Terashima M, Kaneda H, Yokota D, Ko E, et al. Impact of frequency-domain optical coherence tomography guidance for optimal coronary stent implantation in comparison with intravascular ultrasound guidance. Circ Cardiovasc Interv 2012; 5: 193–201.
- 11.
Otake H, Kubo T, Takahashi H, Shinke T, Okamura T, Hibi K, et al. Optical Frequency Domain Imaging Versus Intravascular Ultrasound in Percutaneous Coronary Intervention (OPINION Trial): Results from the OPINION imaging study. JACC Cardiovasc Imaging 2018; 11: 111–123.
- 12.
Yabushita H, Bouma BE, Houser SL, Aretz HT, Jang IK, Schlendorf KH, et al. Characterization of human atherosclerosis by optical coherence tomography. Circulation 2002; 106: 1640–1645.
- 13.
Kume T, Akasaka T, Kawamoto T, Watanabe N, Toyota E, Neishi Y, et al. Assessment of coronary arterial plaque by optical coherence tomography. Am J Cardiol 2006; 97: 1172–1175.
- 14.
Rieber J, Meissner O, Babaryka G, Reim S, Oswald M, Koenig A, et al. Diagnostic accuracy of optical coherence tomography and intravascular ultrasound for the detection and characterization of atherosclerotic plaque composition in ex-vivo coronary specimens: A comparison with histology. Coron Artery Dis 2006; 17: 425–430.
- 15.
Prati F, Romagnoli E, Gatto L, Fineschi M, Fabbiocchi F, Ozaki Y, et al. Relationship between coronary plaque morphology of the left anterior descending artery and 12 months clinical outcome: The CLIMA study. Eur Heart J, doi:10.1093/eurheartj/ehz520.
- 16.
Fujino A, Mintz GS, Matsumura M, Lee T, Kim SY, Hoshino M, et al. A new optical coherence tomography-based calcium scoring system to predict stent underexpansion. EuroIntervention 2018; 13: e2182–e2189.
- 17.
Tearney GJ, Regar E, Akasaka T, Adriaenssens T, Barlis P, Bezerra HG, et al. Consensus standards for acquisition, measurement, and reporting of intravascular optical coherence tomography studies: A report from the International Working Group for Intravascular Optical Coherence Tomography Standardization and Validation. J Am Coll Cardiol 2012; 59: 1058–1072.
- 18.
Abela GS, Aziz K, Vedre A, Pathak DR, Talbott JD, Dejong J. Effect of cholesterol crystals on plaques and intima in arteries of patients with acute coronary and cerebrovascular syndromes. Am J Cardiol 2009; 103: 959–968.
- 19.
Virmani R, Kolodgie FD, Burke AP, Finn AV, Gold HK, Tulenko TN, et al. Atherosclerotic plaque progression and vulnerability to rupture: Angiogenesis as a source of intraplaque hemorrhage. Arterioscler Thromb Vasc Biol 2005; 25: 2054–2061.