Abstract
Background:
Approximately one-third of patients with advanced heart failure (HF) do not respond to cardiac resynchronization therapy (CRT). We investigated whether the left ventricular (LV) conduction pattern on magnetocardiography (MCG) can predict CRT responders.
Methods and Results:
This retrospective study enrolled 56 patients with advanced HF (mean [±SD] LV ejection fraction [LVEF] 23±8%; QRS duration 145±19 ms) and MCG recorded before CRT. MCG-QRS current arrow maps were classified as multidirectional (MDC; n=28) or unidirectional (UDC; n=28) conduction based on a change of either ≥35° or <35°, respectively, in the direction of the maximal current arrow after the QRS peak. Baseline New York Heart Association functional class and LVEF were comparable between the 2 groups, but QRS duration was longer and the presence of complete left bundle branch block and LV dyssynchrony was higher in the UDC than MDC group. Six months after CRT, 30 patients were defined as responders, with significantly more in the UDC than MDC group (89% vs. 14%, respectively; P<0.001). Over a 5-year follow-up, Kaplan-Meyer analysis showed that adverse cardiac events (death or implantation of an LV assist device) were less frequently observed in the UDC than MDC group (6/28 vs. 15/28, respectively; P=0.027). Multivariate analysis revealed that UDC on MCG was the most significant predictor of CRT response (odds ratio 69.8; 95% confidence interval 13.14–669.32; P<0.001).
Conclusions:
Preoperative non-invasive MCG may predict the CRT response and long-term outcome after CRT.
Cardiac resynchronization therapy (CRT) has been shown to ameliorate symptoms and cardiac mortality by correcting left ventricular (LV) dyssynchrony in patients with heart failure (HF) and reduced ejection fraction (EF).1–6
However, CRT is not always effective in approximately one-third of patients.7
Among various indices predicting CRT responders,8
only ventricular conduction delay measured using a standard 12-lead electrocardiogram (ECG) remains of clinical use.9
Although in large multicenter trials the highest response rate is seen among patients with QRS duration >150 ms and left bundle branch block (LBBB) morphology,10,11
the sensitivity and specificity of detecting CRT responders based on QRS duration and ECG morphology are not sufficient.
An abundance of scars may negate the effect of CRT by causing loss of LV capture or by interfering with the propagation of the paced activation to the surrounding myocardium; thus, larger baseline LV dyssynchrony has predicted superior long-term survival, whereas a discordant LV lead position and myocardial scarring predicted worse outcomes after CRT.12–14
Invasive LV endocardial mapping can reveal the various degrees of LV activation patterns and the distribution of myocardial scar and fibrosis formation, but a surface ECG can only recognize LBBB morphology or non-specific intraventricular conduction disturbance.15,16
Therefore, a non-invasive and detailed measurement of the LV electrophysiological substrates would improve detection of CRT responders.
Magnetocardiography (MCG) is a non-invasive electromagnetic mapping technique to measure magnetic fields that are generated by electric currents flowing in the heart.17
MCG may be a suitable tool for measuring LV electrophysiological substrates because of its various advantages, such as high spatial resolution, immunity to the various conductivities of intervening tissues, and effortless non-contact mapping.18–20
We hypothesized that the LV conduction pattern demonstrated by MCG could be used to predict the CRT responders in patients with advanced HF.
Methods
Study Design and Population
This study retrospectively enrolled 60 consecutive patients in whom MCG had been recorded before CRT device implantation between May 2007 and September 2013. Indications for CRT were based on the 2005 American College of Cardiology (ACC)/American Heart Association (AHA) guidelines,21
in which patients with LVEF ≤35%, a New York Heart Association (NYHA) functional class of II or higher, and a QRS duration of ≥120 ms on 12-lead ECG are considered to have a Class I indication. Ischemic cardiomyopathy (ICM) was defined as HF caused by having coronary lesions with a diameter stenosis >50% or having prior myocardial infarction.
The Institutional Review Board at the National Cerebral and Cardiovascular Center approved this MCG study and waived the requirement for individual consent (M23-050, M24-050-8). The research was conducted in accordance with the Declaration of Helsinki.
Device Implantation
All patients received the right ventricular (RV) lead at the apex. The positions of the LV lead were determined individually by optimizing lead stability and pacing threshold, and by avoiding phrenic nerve stimulation, without taking LV conduction patterns into consideration. The LV lead locations were classified as being positioned into 5 equal parts: namely anterior, anterolateral, lateral, posterolateral, and posterior segment using the left anterior oblique view, comparable to the short-axis view of the heart.22,23
Transthoracic Echocardiography
All patients underwent transthoracic echocardiography before and 6 months after CRT device implantation. LV end systolic volume (LVESV) was measured by the modified Simpson method. Inter- and intraventricular dyssynchrony were evaluated by 2 independent cardiologists specialized in echocardiography. Interventricular dyssynchrony was defined as a mechanical delay ≥40 ms between the LV and RV pre-ejection interval. Intraventricular dyssynchrony was defined as the presence of overlap between the end of the lateral wall contraction and the onset of LV filling.
Measurement and Analysis of MCG
Detailed MCG recording methods have been described previously.17–20
Briefly, we used a 64-channel MCG system (MC-6400; Hitachi High-Technologies, Tokyo, Japan) with highly sensitive superconducting quantum interference device (SQUID) sensors arranged in an 8×8 matrix with 25-mm pitch and a measurement area of 175 mm×175 mm. The magnetic fields measured were then mathematically transformed into electrical currents in accordance with the standard procedure, and time-domain waveforms of their magnitudes were drawn for each channel. We focused on the waveform with maximal amplitude, which presumably reflected LV activity. We defined the offset of the QRS complex as the minimum amplitude point, and onset was determined automatically by the simultaneously recorded ECG.
The MCG current-arrow maps were analyzed at 5-ms intervals. We analyzed the angle using the change in the maximum current arrow (∆axis) between the peak and 40 ms after the QRS peak on the ECG.
Follow-up
Short- and long-term outcomes were evaluated by reviewing medical records. HF medications were adjusted as required clinically, and various adverse events (hospitalization, death, lethal arrhythmias, and LV assisted device impkantation) were recorded. Based on the 2013 ACCF/AHA guidelines, which state that half of all patients with HF will die within 5 years,24
the study participants were followed-up for 5 years.
The primary endpoint was the response to CRT (CRT responder), which was defined as either a decrease in LVESV by >15% or an increase in LVEF by >10% 6 months after CRT device implantation compared with baseline. A secondary endpoint was major adverse cardiac events (MACE), including a composite of cardiac death and LV assisted device (LVAD) implantation, hospitalization for HF, and lethal arrhythmia within the 5-year follow-up period.
Statistical Analysis
Statistical analysis was performed using JMP version 11.0 (SAS Institute, Cary, NC, USA) and R statistical software (R Foundation for Statistical Computing, Vienna, Austria).25
Normally distributed continuous data are presented as the mean±SD and were compared using Student’s t-test. Non-normally distributed continuous data are presented as the median and interquartile range (IQR) and were compared using the Mann-Whitney U-test. Categorical variables are expressed as percentages and were compared using Fisher’s exact test or the Chi-squared test, as appropriate. Receiver operating characteristics (ROC) curve analysis was used to define the cut-off values for ∆axis that best distinguished between CRT responders and non-responders. Kaplan-Meier methods were used to estimate survival curves for follow-up events. Multivariate logistic regression analysis with adjustment for age and sex was conducted to assess factors that were associated with the response to CRT. Two-sided P<0.05 was considered significant.
Results
Patient Characteristics
Of the 60 patients who underwent MCG, 4 were excluded because of a complete right bundle branch block (CRBBB) pattern (n=3) and failed CRT implantation (n=1), leaving 56 patients for analysis. As shown in
Table 1, 45 (80%) patients were male, mean age was 61±15 years , NYHA class was 2.6±0.7, LVEF was 23±8%, and the QRS duration was 145±19 ms. Twelve patients (21%) had a history of atrial fibrillation, whereas 10 patients (18%) had sustained ventricular tachycardia or ventricular fibrillation (VT/VF). Fifty-one patients (91%) were implanted with a CRT-defibrillator (D) and only 5 (9%) were implanted with a CRT-pacemaker (P) for the primary prevention of sudden cardiac death. Many patients (n=34; 61%) had dilated cardiomyopathy, with only 10 (18%) having ICM.
Table 1.
Baseline Characteristics Overall and in Patients With UDC and MDC Conduction Pattern Separately
| |
Overall
(n=56) |
UDC
(n=28) |
MDC
(n=28) |
P value |
| Age (years) |
61±15 |
65±13 |
58±17 |
0.085 |
| Male sex |
45 (80) |
21 (75) |
24 (86) |
0.503 |
| BMI (kg/m2) |
21.1±3.6 |
21.4±2.6 |
20.9±4.3 |
0.606 |
| BSA (m2) |
1.65±0.21 |
1.66±0.20 |
1.64±0.22 |
0.870 |
| Etiology |
| Ischemic CM |
10 (18) |
3 (11) |
7 (25) |
0.296 |
| Dilated CM |
34 (61) |
21 (75) |
12 (43) |
0.029 |
| Hypertrophic CM |
7 (13) |
1 (4) |
7 (25) |
0.051 |
| Other |
5 (9) |
3 (11) |
2 (7) |
1.000 |
| NYHA functional classA |
2.6±0.7 |
2.6±0.6 |
2.7±0.7 |
0.696 |
| History of arrhythmia |
| AF |
12 (21) |
6 (21) |
6 (21) |
1.000 |
| VT/VF |
10 (18) |
4 (14) |
6 (21) |
0.729 |
| Laboratory data |
| Hemoglobin (g/dL) |
12.5±2.1 |
12.5±1.9 |
12.5±2.2 |
0.957 |
| Creatinine (mg/dL) |
1.6±1.9 |
1.7±2.3 |
1.5±1.4 |
0.677 |
| BNP (pg/mL) |
570±664 |
599±843 |
542±415 |
0.750 |
| 12-lead ECG findings |
| QRS duration (ms) |
145±19 |
156±26 |
134±15 |
<0.001 |
| CLBBB |
32 (57) |
22 (79) |
10 (36) |
0.003 |
| IVCD |
24 (43) |
6 (21) |
18 (64) |
0.003 |
| Echocardiography data |
| LVESV (mL) |
181±85 |
194±94 |
167±74 |
0.230 |
| LVEF (%) |
23±8 |
22±7 |
24±9 |
0.314 |
| Interventricular dyssynchrony |
17 (30) |
14 (50) |
3 (11) |
0.003 |
| Intraventricular dyssynchrony |
25 (45) |
19 (68) |
6 (21) |
0.001 |
| Medications |
| Diuretics |
44 (79) |
21 (75) |
23 (82) |
0.746 |
| β-blockers |
49 (88) |
23 (82) |
26 (93) |
0.422 |
| ACEI/ARBs |
42 (75) |
22 (79) |
20 (71) |
0.760 |
| Amiodarone/sotalol |
21 (38) |
10 (36) |
11 (39) |
1.000 |
Values are given as the mean±SD or n (%). ANew York Heart Association (NYHA) functional class was determined before implantation of a cardiac resynchronization therapy (CRT) device. ACEI, Angiotensin-converting enzyme inhibitor; AF, atrial fibrillation; ARBs, angiotensin receptor blockers; BMI, body mass index; BNP, B-type natriuretic peptide; BSA, body surface area; CLBBB, complete left bundle branch block; CM, cardiomyopathy; IVCD, intraventricular conduction disorder; LVEF, left ventricular ejection fraction; LVESV, left ventricular end-systolic volume; MDC, multidirectional; UDC, unidirectional; VF, ventricular fibrillation; VT, ventricular tachycardia.
Figure 1
shows MCG current arrow maps from 2 patients. The change in the largest current arrow vector (∆axis) was smaller (25°) in Patient 1 (Figure 1A) and larger (168°) in Patient 2 (Figure 1B).
Figure 2A
shows the association between the ∆axis on the MCG and QRS duration on the ECG. There was no correlation between these 2 parameters.


Of 56 patients who were implanted with a CRT device, 28 (50%) were considered to be CRT responders. Therefore, we further analyzed the association of MCG and ECG with CRT response. As shown in
Figure 2B,C, ROC analysis revealed that the ∆axis on the MCG was better able to predict CRT responders than QRS duration on the ECG. The area under curve (AUC) for the ∆axis on the MCG and QRS duration on the ECG was 0.852 and 0.711, respectively, and the cut-off values were 35° and 160 ms, respectively. Therefore, we classified the MCG-QRS current arrow map as multidirectional conduction (MDC) or unidirectional conduction (UDC) using a ∆axis of either ≥35° or <35°, respectively.
Comparisons Between the UDC and MDC Groups
Of the 56 patients, 28 each were classified as having a UDC or MDC pattern on the MCG current-arrow map.
Table 1
compares patients’ clinical characteristics between the UDC and MDC groups. Age, sex, prevalence of ICM, B-type natriuretic peptide (BNP), and parameters measured by echocardiogram (LVESV, LVEF) were comparable between the 2 groups. Conversely, the frequency of dilated cardiomyopathy was higher in the UDC than MDC group (75% vs. 43%, respectively; P<0.05), which is consistent with findings for CRT responders vs. non-responders (Supplementary Table 1). Furthermore, in the UDC group, QRS duration was significantly longer (156±26 vs. 134±15 ms; P<0.001) and the prevalence of CLBBB was significantly higher (79% vs. 36%; P=0.003) than in the MDC group.
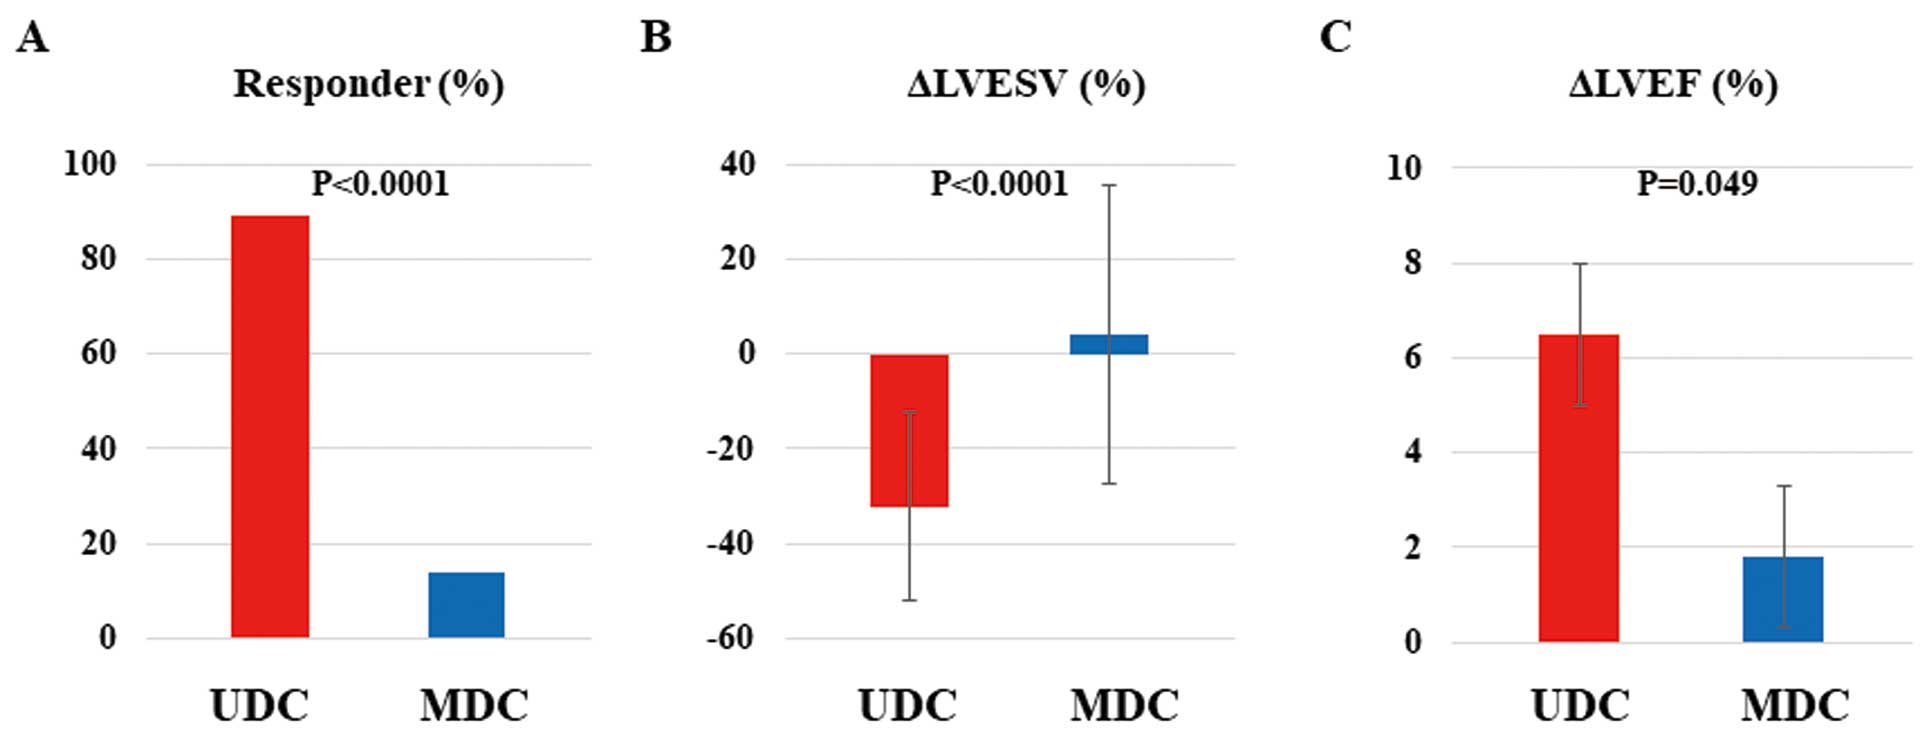
Figure 3
shows CRT effectiveness at 6 months after CRT device implantation. Of the 56 patients with an implanted CRT device, 30 (54%) were considered to be CRT responders, and this prevalence was much higher in the UDC than MDC group (89% vs. 14%, respectively; P<0.0001;
Figure 3A). Improvements in LVESV and LVEF were significantly greater in the UDC than MDC group (∆LVESV, −32.2±19.8 vs. 4.0±31.4%, respectively [P<0.0001]; ∆LVEF, 6.4±7.8% vs. 1.8±8.5%, respectively [P=0.049];
Figure 3B,C).
Long-Term Outcomes
Table 2
summarizes the occurrence of MACE during the 5-year follow-up in all patients. In the MDC group, 15 of 28 patients experienced MACE, such as cardiac death in 12 patients (43%) and LVAD implantation in 3 (11%). However, in the UDC group, 6 patients (21%) died after CRT implantation. In the present study, only 5 patients received a CRT-P, and 4 of these patients died due to worsening of advanced HF during follow-up, including 1 with LVAD implantation. None of the patients died suddenly due to fatal ventricular arrhythmias. Thus, either CRT-P or CRT-D did not directly affect the total mortality of patients.
Table 2.
Major Adverse Cardiac Events During the 5-Year Follow-up Period Overall and in Patients With UDC and MDC Conduction Pattern Separately
| |
Overall
(n=56) |
UDC
(n=28) |
MDC
(n=28) |
P value |
| Major adverse cardiac events |
21 (38) |
6 (21) |
15 (54) |
0.026 |
| Cardiac death |
18 (31) |
6 (21) |
12 (43) |
0.152 |
| LVAD implantation |
3 (5) |
0 (0) |
3 (11) |
0.236 |
| Hospitalization for CHF |
25 (45) |
10 (36) |
15 (54) |
0.282 |
| Lethal arrhythmia |
12 (21) |
5 (18) |
7 (25) |
0.746 |
| AF |
1 (2) |
1 (4) |
0 (0) |
1.000 |
Data are given as n (%). CHF, congestive heart failure; LVAD, left ventricular assist device. Other abbreviations as in Table 1.
Kaplan-Meier analysis showed a significantly higher incidence of MACE in the MDC than UDC group (hazard ratio [HR] 2.79; 95% confidence interval [CI] 1.13–7.84; P=0.027;
Figure 4A). Furthermore, 11 patients were hospitalized for HF in the UDC group, compared with 17 in the MDC group (P=0.066, log-rank test;
Figure 4B). Conversely, the occurrence of VT/VF events was similar between the UDC and MDC groups (Figure 4C).
Prediction of CRT Responders Using MCG and Other Clinical Indices
Table 3
shows the sensitivity and specificity of different indices for CRT responders. UDC on MCG had a higher sensitivity (89%; 95% CI 71–98), specificity (84%; 95% CI 66–95), positive predictive value (83%; 95% CI 64–94), and negative predictive value (90%; 95% CI 73–98) for CRT response that previous ECG- and echocardiography-based predictors.
Table 3.
Factors Predicting Cardiac Resynchronization Therapy Responders
| |
Sensitivity
(%) |
Specificity
(%) |
PPV
(%) |
NPV
(%) |
| Δaxis <35° (UDC) on MCG |
89 (71–98) |
84 (66–95) |
83 (64–94) |
90 (73–98) |
| QRS ≥160 ms on ECG |
81 (62–94) |
58 (39–75) |
63 (45–79) |
78 (56–93) |
| CLBBB |
64 (42–81) |
71 (52–86) |
65 (44–83) |
69 (50–84) |
| Interventricular dyssynchrony |
96 (81–100) |
52 (33–70) |
63 (47–78) |
94 (71–100) |
| Intraventricular dyssynchrony |
78 (58–91) |
65 (45–81) |
66 (47–81) |
77 (56–91) |
Δaxis, change in the maximum current arrow; CLBBB, complete left bundle branch block; ECG, electrocardiography; MCG, magnetocardiography; NPV, negative predictive value; PPV, positive predictive value; UDC, unidirectional conduction pattern.
In the multivariate logistic regression analysis, ∆axis <35° (UDC) on MCG was the most significant predictor of a CRT responder (odds ratio 69.8; 95% CI 13.14–669.32; P<0.001) among all previous ECG- and echocardiography-based indices (Table 4).
Table 4.
Univariate and Multivariate Analyses for Factors Predicting Cardiac Resynchronization Therapy Responders
| |
Univariate analysis |
Multivariate analysisA |
| OR |
95% CI |
P value |
OR |
95% CI |
P value |
| Δaxis <35° (UDC) on MCG |
50.00 |
11.62–300.52 |
<0.001 |
69.8 |
13.14–669.32 |
<0.001 |
| QRS duration ≥160 ms on ECG |
7.20 |
2.23–26.81 |
<0.001 |
3.90 |
1.29–12.65 |
0.008 |
| CLBBB on ECG |
5.34 |
1.75–17.93 |
0.003 |
1.36 |
0.08–15.04 |
0.019 |
| Interventricular dyssynchrony |
31.9 |
5.59–609.83 |
<0.001 |
24.07 |
4.15–460.31 |
0.003 |
| Intraventricular dyssynchrony |
6.65 |
2.12–23.3 |
<0.001 |
5.30 |
1.64–19.00 |
0.007 |
A
Adjusted for age and sex. CI, confidence interval; OR, odds ratio. Other abbreviations as in Table 3.
Discussion
The present study is the first to demonstrate MCG-based non-invasive prediction of CRT responders. A ∆axis <35° (UDC pattern) on MCG was significantly associated with being a CRT responder and a better prognosis after CRT than a ∆axis ≥35° (MDC pattern). The MCG index was also a predictor of long-term mortality in patients with HF after CRT.
Prediction of CRT Response by MCG
Standard 12-lead ECG is an essential tool to determine the indication for CRT because the presence of LBBB and a QRS duration >150 ms are Class I recommendations for CRT;26
both were the best predictors of a CRT response in a large study that analyzed 24,169 patients.10
However, the accuracy of ECG predications is not always high because the LBBB pattern on an ECG may contain various intraventricular conduction patterns in patients with LV dysfunction. Conversely, mechanical dyssynchrony measured by transthoracic echocardiography is also considered to be able to predict CRT responders. However, several single-center8
and multicenter27
randomized trials failed to demonstrate the ability to predict a CRT responder using mechanical dyssynchrony measured using echocardiography.
In the present study, MCG with a high spatiotemporal resolution showed the detailed intraventricular conduction pattern, leading to prediction of CRT responders in dyssynchronous HF. In some cases, there could be a discrepancy between MCG and ECG findings. As shown in
Figure 1C, the UDC pattern was consistent with a response to CRT even though the ECG showed an intraventricular conduction disturbance that was not good for CRT. The surface ECG can be reflected by the electrical potential difference in electrodes caused by propagation of extracellular currents from the myocardium to the body surface, which is distorted by the electrical conductance of various organs, such as the lungs and skin. Compared with standard 12-lead ECG, MCG has a higher spatial resolution and different sensitivities, especially to abnormal currents consisting of tangential components.20
Furthermore, we compared CRT responders and non-responders, as well as patients with and without MACE. The CRT responders had a higher prevalence of the UDC pattern on MCG, a CLBBB pattern and longer QRS duration on the ECG, and inter- and intraventricular dyssynchrony on transthoracic echocardiography than CRT non-responders (Supplementary Table 1). Conversely, there were no differences in ECG findings between patients with and without MACE (Supplementary Table 2). We estimated that prediction of MACE is one of the advantages of MCG over ECG.
Mechanisms of Multidirectional Conduction
A previous study using invasive 3-dimensional (3D) endocardial mapping reported that patients with HF and LBBB QRS morphology had 2 conduction patterns: a homogeneous propagation pattern (Type I) or a U-shaped pattern (Type II) because of conduction block.16
Patients with the Type II pattern may be CRT responders and have better long-term outcomes than patients with homogeneous propagation.28
However, our results from non-invasive monitoring showed that patients with an MDC pattern had significantly poorer CRT response and outcome than those with a UDC pattern. This discrepancy may be due to differences in mapping methods: only the endocardium was assessed using 3D catheter mapping, whereas the MCG reflected whole myocardial electrical excitation. Furthermore, the conduction pattern in the endocardium and epicardium is sometimes different because of a complex fibrosis-induced change in conduction in patients with LV dysfunction.
However, the amount of scar area was associated with the CRT response,29,30
with a cut-off value of 15% of total scar tissue detected by delayed enhanced magnetic resonance imaging (MRI) having a sensitivity and specificity of 85% and 90%, respectively, to predict a CRT response. Moreover, another study reported that transmural scar tissue in the posterolateral LV segments, which is the target region for LV pacing, was important for the CRT response.31
Thus, the amount and location of electrical scar tissue may be important in determining the efficacy of CRT. However, in the present study, many LV pacing leads were located in posterior or posterolateral regions, and there was no significant difference in LV lead location between CRT responders and non-responders (Supplementary Table 3), thus the LV pacing site did not affect the CRT response. However, myocardial scar in the LV was not fully demonstrated because few patients had undergone cardiac MRI in the present study. Therefore, we only speculate that the MDC pattern, probably due to regional electrical scar (local block), may hamper the CRT response.
Study Limitations
The present study has several limitations. First, this is a single-center, small retrospective study and a multivariable analysis may suffer from overfitting. A multicenter prospective study is needed to evaluate the efficacy of the MCG in predicting the CRT response. Second, because patients could not undergo MCG after CRT implantation, we could not evaluate how the intraventricular conduction pattern changed after CRT. Third, the number of patients with an indication for CRT because of ICM was smaller in this study than that in Western countries.
Conclusions
The change in the LV conduction pattern (∆axis) after the peak of QRS that was detected by MCG was significantly associated with both short- and long-term outcomes in patients with HF after CRT implantation. Although this was a retrospective study, MCG was found to be a powerful and non-invasive tool to predict CRT responders among patients with HF.
Acknowledgments
The authors are grateful to Shuji Hashimoto, Emi Yamashita, Tamami Toyomasa and Yoshiki Yanagi (National Cerebral and Cardiovascular Center, Japan) for technical assistance with MCG recording.
Sources of Funding
This study was supported by the Intramural Research Fund for Cardiovascular Diseases of the National Cerebral and Cardiovascular Center, Japan (22-1-2, 22-1-5, 25-2-1) and a research grant from Magnetic Health Science Foundation (H23 to T.A.).
Disclosures
S.Y. is a member of
Circulation Journal
’ Editorial Team. The remaining authors have no conflicts of interest to disclose.
IRB Information
The Institutional Review Board at the National Cerebral and Cardiovascular Center approved this study and waived the requirement for individual consent (M23-050, M24-050-8).
Supplementary Files
Please find supplementary file(s);
http://dx.doi.org/10.1253/circj.CJ-20-0325
References
- 1.
Cleland JG, Daubert JC, Erdmann E, Freemantle N, Gras D, Kappenberger L, et al. The effect of cardiac resynchronization on morbidity and mortality in heart failure. N Engl J Med 2005; 352: 1539–1549.
- 2.
Cazeau S, Leclercq C, Lavergne T, Walker S, Varma C, Linde C, et al. Effects of multisite biventricular pacing in patients with heart failure and intraventricular conduction delay. N Engl J Med 2001; 344: 873–880.
- 3.
Abraham WT, Fisher WG, Smith AL, Delurgio DB, Leon AR, Loh E, et al. Cardiac resynchronization in chronic heart failure. N Engl J Med 2002; 346: 1845–1853.
- 4.
Bristow MR, Saxon LA, Boehmer J, Krueger S, Kass DA, De Marco T, et al. Cardiac-resynchronization therapy with or without an implantable defibrillator in advanced chronic heart failure. N Engl J Med 2004; 350: 2140–2150.
- 5.
Daubert JC, Saxon L, Adamson PB, Auricchio A, Berger RD, Beshai JF, et al. 2012 EHRA/HRS expert consensus statement on cardiac resynchronization therapy in heart failure: Implant and follow-up recommendations and management. Heart Rhythm 2012; 9: 1524–1576.
- 6.
Brignole M, Auricchio A, Baron-Esquivias G, Bordachar P, Boriani G, Breithardt OA, et al. 2013 ESC guidelines on cardiac pacing and cardiac resynchronization therapy: The Task Force on Cardiac Pacing and Resynchronization Therapy of the European Society of Cardiology (ESC). Developed in collaboration with the European Heart Rhythm Association (EHRA). Eur Heart J 2013; 34: 2281–2329.
- 7.
Daubert C, Behar N, Martins RP, Mabo P, Leclercq C. Avoiding non-responders to cardiac resynchronization therapy: A practical guide. Eur Heart J 2017; 38: 1463–1472.
- 8.
Chung ES, Leon AR, Tavazzi L, Sun JP, Nihoyannopoulos P, Merlino J, et al. Results of the Predictors of Response to CRT (PROSPECT) trial. Circulation 2008; 117: 2608–2616.
- 9.
Sipahi I, Chou JC, Hyden M, Rowland DY, Simon DI, Fang JC. Effect of QRS morphology on clinical event reduction with cardiac resynchronization therapy: Meta-analysis of randomized controlled trials. Am Heart J 2012; 163: 260–267.e3.
- 10.
Peterson PN, Greiner MA, Qualls LG, Al-Khatib SM, Curtis JP, Fonarow GC, et al. QRS duration, bundle-branch block morphology, and outcomes among older patients with heart failure receiving cardiac resynchronization therapy. JAMA 2013; 310: 617–626.
- 11.
Zareba W, Klein H, Cygankiewicz I, Hall WJ, McNitt S, Brown M, et al. Effectiveness of cardiac resynchronization therapy by QRS morphology in the Multicenter Automatic Defibrillator Implantation Trial-Cardiac Resynchronization Therapy (MADIT-CRT). Circulation 2011; 123: 1061–1072.
- 12.
Delgado V, van Bommel RJ, Bertini M, Borleffs CJ, Marsan NA, Arnold CT, et al. Relative merits of left ventricular dyssynchrony, left ventricular lead position, and myocardial scar to predict long-term survival of ischemic heart failure patients undergoing cardiac resynchronization therapy. Circulation 2011; 123: 70–78.
- 13.
Yu Y, Kramer A, Spinelli J, Ding J, Hoersch W, Auricchio A. Biventricular mechanical asynchrony predicts hemodynamic effect of uni- and biventricular pacing. Am J Physiol Heart Circ Physiol 2003; 285: H2788–H2796.
- 14.
Leclercq C, Kass DA. Retiming the failing heart: Principles and current clinical status of cardiac resynchronization. Am J Coll Cardiol 2002; 39: 194–201.
- 15.
Rodriguez LM, Timmermans C, Nabar A, Beatty G, Wellens HJ. Variable patterns of septal activation in patients with left bundle branch block and heart failure. J Cardiovasc Electrophysiol 2003; 14: 135–141.
- 16.
Auricchio A, Fantoni C, Regoli F, Carbucicchio C, Goette A, Geller C, et al. Characterization of left ventricular activation in patients with heart failure and left bundle-branch block. Circulation 2004; 109: 1133–1139.
- 17.
Seki Y, Muneyuki K, Kandori A, Tsukada K, Terao K, Ageyama N. Standardization of magnetocardiography in nonhuman primates. Phys Med Biol 2008; 53: 1609–1618.
- 18.
Kawakami S, Takaki H, Hashimoto S, Kimura Y, Nakashima T, Aiba T, et al. Utility of high-resolution magnetocardiography to predict later cardiac events in nonischemic cardiomyopathy patients with normal QRS duration. Circ J 2016; 81: 44–51.
- 19.
Kimura Y, Takaki H, Inoue YY, Oguchi Y, Nagayama T, Nakashima T, et al. Isolated late activation detected by magnetocardiography predicts future lethal ventricular arrhythmic events in patients with arrhythmogenic right ventricular cardiomyopathy. Circ J 2017; 82: 78–86.
- 20.
Iwakami N, Aiba T, Kamakura S, Takaki H, Furukawa TA, Sato T, et al. Identification of malignant early repolarization pattern by late QRS activity in high-resolution magnetocardiography. Ann Noninvasive Electrocardiol 2020; 25: e12741.
- 21.
Hunt SA, Abraham WT, Chin MH, Feldman AM, Francis GS, Ganiats TG, et al. ACC/AHA 2005 guideline update for the diagnosis and management of chronic heart failure in the adult: A report of the American College of Cardiology/American Heart Association Task Force on Practice Guidelines (Writing Committee to Update the 2001 Guidelines for the Evaluation and Management of Heart Failure): Developed in collaboration with the American College of Chest Physicians and the International Society for Heart and Lung Transplantation: Endorsed by the Heart Rhythm Society. Circulation 2005; 112: e154–e235.
- 22.
Singh JP, Houser S, Heist EK, Ruskin JN. The coronary venous anatomy: A segmental approach to aid cardiac resynchronization therapy. Am J Coll Cardiol 2005; 46: 68–74.
- 23.
Singh JP, Klein HU, Huang DT, Reek S, Kuniss M, Quesada A, et al. Left ventricular lead position and clinical outcome in the multicenter automatic defibrillator implantation trial-cardiac resynchronization therapy (MADIT-CRT) trial. Circulation 2011; 123: 1159–1166.
- 24.
Yancy CW, Jessup M, Bozkurt B, Butler J, Casey DE Jr, Drazner MH, et al. 2013 ACCF/AHA guideline for the management of heart failure: A report of the American College of Cardiology Foundation/American Heart Association Task Force on Practice Guidelines. Am J Coll Cardiol 2013; 62: E147–E239.
- 25.
Stevenson M. Package ‘epiR’. 2020. https://cran.r-project.org/web/packages/epiR/epiR.pdf (accessed August 30, 2020).
- 26.
Brignole M, Auricchio A, Baron-Esquivias G, Bordachar P, Boriani G, Breithardt OA, et al. 2013 ESC guidelines on cardiac pacing and cardiac resynchronization therapy: The task force on cardiac pacing and resynchronization therapy of the European Society of Cardiology (ESC). Developed in collaboration with the European Heart Rhythm Association (EHRA). Europace 2013; 15: 1070–1118.
- 27.
Ruschitzka F, Abraham WT, Singh JP, Bax JJ, Borer JS, Brugada J, et al. Cardiac-resynchronization therapy in heart failure with a narrow QRS complex. N Engl J Med 2013; 369: 1395–1405.
- 28.
Fung JW, Chan JY, Yip GW, Chan HC, Chan WW, Zhang Q et al. Effect of left ventricular endocardial activation pattern on echocardiographic and clinical response to cardiac resynchronization therapy. Heart 2007; 93: 432–437.
- 29.
Chalil S, Foley PW, Muyhaldeen SA, Patel KC, Yousef ZR, Smith RE, et al. Late gadolinium enhancement-cardiovascular magnetic resonance as a predictor of response to cardiac resynchronization therapy in patients with ischaemic cardiomyopathy. Europace 2007; 9: 1031–1037.
- 30.
White JA, Yee R, Yuan X, Krahn A, Skanes A, Parker M, et al. Delayed enhancement magnetic resonance imaging predicts response to cardiac resynchronization therapy in patients with intraventricular dyssynchrony. Am J Coll Cardiol 2006; 48: 1953–1960.
- 31.
Bleeker GB, Kaandorp TA, Lamb HJ, Boersma E, Steendijk P, de Roos A, et al. Effect of posterolateral scar tissue on clinical and echocardiographic improvement after cardiac resynchronization therapy. Circulation 2006; 113: 969–976.