Abstract
Background:
Recently, an interoperative catheter electrode mapping system, termed ExTRa Mapping (EXT), was developed for precise diagnosis and effective treatment of non-paroxysmal atrial fibrillations (non-PAF). However, the mapping accuracy of EXT is still unclear.
Methods and Results:
In this study, the reliability of the EXT in comparison with that of high-resolution optical membrane potential mapping was compared. Spiral wave re-entries (SWRs) were induced in the excised rabbit hearts (n=8, 42 episodes). Electrical signals were measured by electrodes on a transparent silicone plate, with the same arrangement as in the clinical catheter, and fluorescence signals were recorded simultaneously across the plate. Based on the phase maps derived by EXT, activation patterns (one-directed propagations: 26, rotational activities: 16) were identified correctly with 95% accuracy (40/42), and the correlation coefficient of the ratio of the non-passive period was 0.95. In the rotational episodes (15), the mean position error of the centers of gravity of the SWR trajectory (2,000 ms) was 2.0 mm. For the one-directional episodes (25), the correlation coefficient of the directions of one-way propagation was 0.99.
Conclusions:
The phase map sequence by EXT is consistent with that by the analyses of high-resolution optical mapping. EXT is reliable for analyzing the activation pattern in the region of interest.
Atrial fibrillation (AF) is one of the most common arrhythmias, particularly in aging societies. Pulmonary vein isolation (PVI), proposed by Haissaguerre et al, is an established ablation strategy currently used for the treatment of AF.1–4
While the success rate of PVI for paroxysmal AF (PAF) is adequate, PVI ablation alone for persistent or long-standing persistent AF; that is, non-paroxysmal AF (non-PAF), which often accompanies remodeling of the atrial tissue, is still limited.5
A reliable ablation strategy has not yet been established for non-PAF patients.
For a more precise diagnosis and effective treatment of non-PAF, a variety of diagnostic techniques have been proposed.6–11
For example, body surface mapping is a non-invasive diagnostic method that estimates the activation pattern of the atrial tissue non-invasively from multiple body surface electrode signals.12
Complex fractionated atrial electrogram (CFAE) mapping and low-voltage area (LVA) mapping are more direct methods that identify the ectopic site of the pathological atrial tissue from the waveform feature of a single intra-cardiac bipolar electrogram.13–16
Recently, for enriched and more intuitive visualization, catheter mapping methods using designated a high-density electrode catheter have been proposed.6,11
Phase mapping using ExTRa Mapping (EXT) is one such high-density mapping method that has been specifically designed for intraoperative high-resolution and online, real-time visualization of atrial activation dynamics. By using the spiral-shaped 20-pole electrode catheter, EXT estimates the phase map sequence inside the region of interest (ROI) under the mapping catheter to judge the complexity of the activation in the region. In a previous clinical study, the effectiveness of the EXT-guided, non-PAF ablation was demonstrated.17
However, similar to other multielectrode mapping methods, the accuracy of the estimated activation patterns has not yet been sufficiently verified.
Here, we investigate the accuracy of EXT through ex vivo experiments of simultaneous measurement using high-resolution optical membrane potential mapping (OPT). SWRs induced in excised rabbit hearts were measured using both mapping methods, and the activation pattern estimated by EXT was compared with that estimated by OPT.
Methods
Experimental Animal Model
The protocol followed in this study was approved by the Institutional Animal Care and Use Committee of the University of Tokyo. The experimental models have been described in other studies.18–20
Hearts of Japanese white rabbits (weight: 1.7–2.0 kg) of both sexes were isolated and connected to a Langendorff perfusion apparatus with Krebs–Ringer solution. The endocardial wall of the left ventricle was destroyed by performing cryoablation of the cardiac tissues from the endocardial side to create a 2D preparation. The cryoablation agent utilized was a cryoprobe cooled with liquid nitrogen. The heart was stained with the voltage-sensitive dye, di-4-ANEPPS (0.2 μmol/L). Then, 2,3-butanedione monoxime (15 μmol/L) was added to the perfusate to inhibit heart contractions. Rapid pacing stimulations (2–5 V, 120–200 ms interval) were applied from the linear catheter (Livewire; St. Jude Medical Inc. St Paul, MN, USA) inserted in the right ventricular chamber to induce spiral wave re-entries.
Simultaneous Mapping System
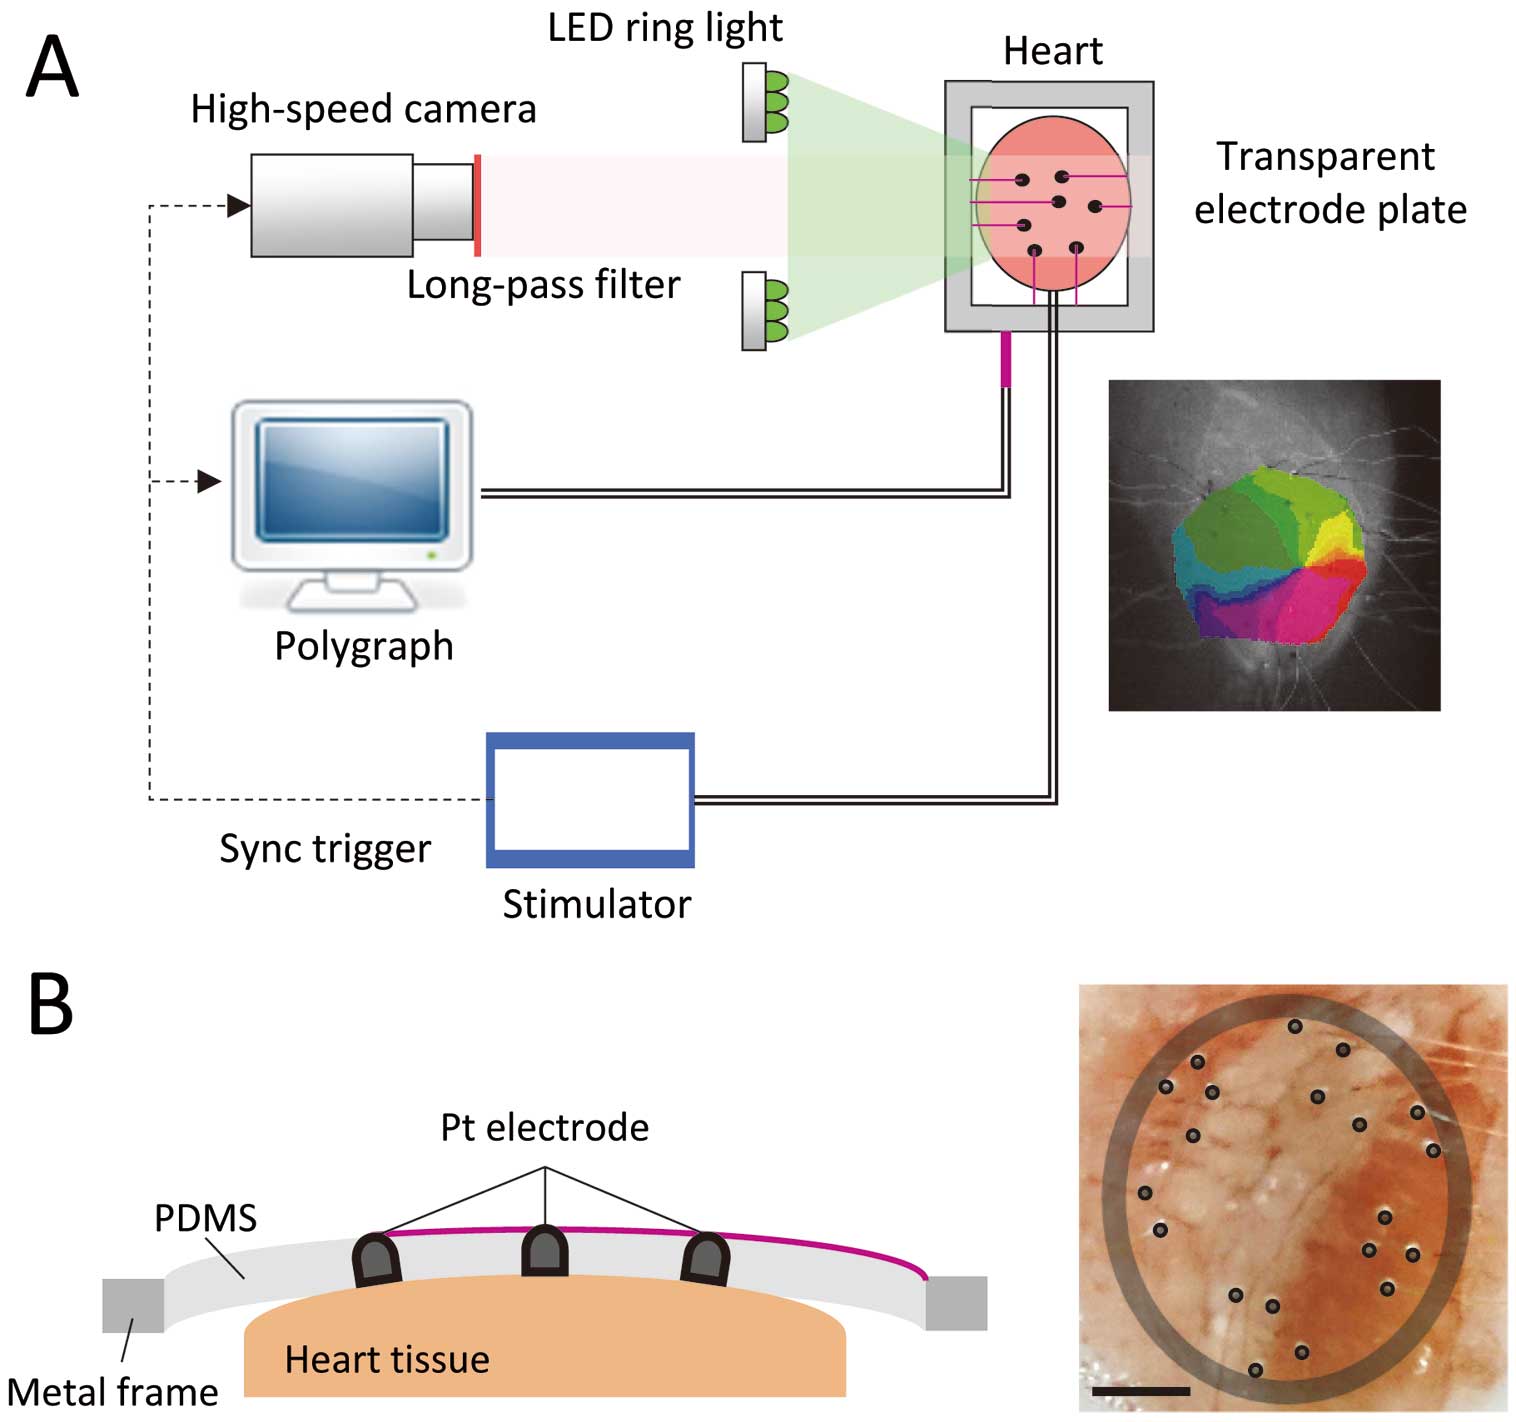
Figure 1A
shows the schematic diagram of the developed simultaneous mapping system. Electrical signals at the epicardial ventricular surface of rabbit heart samples were measured on the electrodes located on a transparent silicon plate (PDMS, 1-mm thickness) held by a metal frame (Figure 1B, Left). The arrangement of the electrodes was made similar to that of a multi-electrode catheter (REFLEXION HD; St. Jude Medical) clinically used for EXT, with 70% scale, taking into consideration the difference in the conduction velocity of the rabbit ventricle (40 cm/s) and human atrium (63 cm/s) (Figure 1B, Right). Regional electrograms were recorded and analyzed on a polygraph (RMC-5000; Nihon Kohden, Tokyo, Japan). Simultaneously, the optical signal through the transparent electrode plate was recorded by a high-speed camera (SA4; Photoron, Tokyo, Japan) with 1,000 frames/s. The detail of the optical mapping system has been described in previous studies.20–22
Both optical and electrical measurements were synchronized by the external trigger generated by the stimulator (SEC-5104; Nihon Kohden).
From the recorded electrode signals, the phase map sequences, with a speed of 4 ms/frame, were estimated by the ExTRa MappingTM
software (RMC-5000; Nihon Kohden). Briefly, this algorithm estimates phase maps of the region of the mapping catheter by estimating the phase value at each point using a numerical simulation model of a cardiac cell23
and spaciotemporal interpolation by specialized artificial intelligence.17
The corresponding phase maps were also derived from the OPT signals. The details of the algorithm are described in other studies.24–26
The phase value of each pixel in the camera image was calculated by applying reverse normalization and Hilbert transform to the OPT signal.
Coordinate Transformation
The derived phase maps were defined on different coordinate systems; that is, the coordinate systems of OPT and EXT. To compare these phase maps, coordinate transformation matrices were derived from the coordinates of 4 corresponding electrodes by using estimation of the perspective transformation matrix.
Detection of SWR Centers
The Center of the SWR is an important feature point for judging the complexity of excitation of the measured region. From the derived phase maps, the phase singularities (PSs) corresponding to the centers of the SWRs were detected automatically by using phase variance analysis.25
Briefly, this algorithm detects the position of PSs as the point around which the local variance of phase values is large.
Similarity of Excitation Complexity
From the detection results of PSs, the similarity between the sequences of the EXT phase maps and OPT phase maps were evaluated quantitatively. Optical phase maps were transformed into the EXT image coordinates and down-sampled to 4 ms/frame to allow comparison with EXT results.
The objective of multi-electrode catheter mapping is to identify the region in which the SWR can be observed with high probability. To quantify this probability, we defined an index termed the non-passive ratio (%NP), as follows.
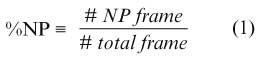
The non-passive (NP) frame was defined as the frame in which at least one PS was detected.
Similarity of the Average Direction of Phase Propagation
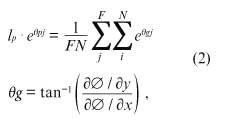
To compare the directions of 1-way propagation in the passive regions between EXT and OPT, the average direction of propagation on each phase map was calculated as follows:
where
lp
and θp
correspond to the average velocity and direction of phase propagation, respectively, ∅ is the phase value on each pixel,
F
is the total number of the frames in each episode (494 frames, 4 ms/frame), and
N
is the number of pixels in the measurement region (5,718 pixels).
Similarity of the Average Relative Position of SWR
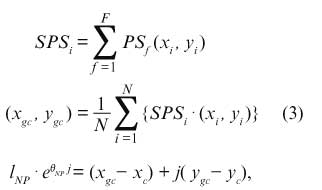
To evaluate the similarity of the phase maps of NP episodes, the center of gravity (COG) of the SWR trajectory was calculated and compared as follows:
where
F
is the total number of the frames in each episode (494 frames, 4 ms/frame), and
PSf
is the binary image of PSs at the
f-th frame.
N
is the total number of the pixels in the measurement region (5,718 pixels), and (xgc,
ygc) is the position of the COG. To evaluate the similarity of the relative position, the polar coordinates of the COG (lNP, θNP) from the center of the region (xc,
yc) were calculated and compared.
Statistical Analysis
For quantitative evaluation of the similarities between OPT and EXT, correlation coefficients of the above described 4 indices (%
NP, θg,
lNP, θNP) were calculated. Moreover, each episode was classified into 2 categories by thresholding %NP. Considering that the objective of EXT is the detection of the NP area, we defined an episode with %NP ≥0.5 as a positive NP episode, and an episode with %NP <0.5 as a negative NP episode. The sensitivity and specificity of NP episodes by EXT were compared with those of OPT.
Results
Ventricular Tachyarrhythmia (VT) and SWR
VTs were induced in 8 hearts by rapid pacing from the right ventricular endocardium. Video images of excitation during long-lasting VTs (more than 30 s) were analyzed. From 8 heart samples, 58 episodes were recorded. Among the episodes from the same heart sample, the electrode position was modified, and VT was re-induced. Sixteen episodes out of 58 episodes were removed from the comparison target due to the bad signal quality of the optical measurement. In the remaining 42 episodes, certain forms of SWR (single-loop or figure-of-eight re-entry) were documented in 16 (38%) episodes. The remaining 26 VT episodes showed 1-way propagation of wave fronts traversing the observation areas.
Activation Patterns During Ventricular Tachyarrhythmia
Figure 2
shows representative examples of comparisons between EXT and OPT. OPT phase maps were transformed onto the EXT image coordinate system. In the passive case (Figure 2A), no PS was observed and 1-way propagation of a planar wave from left to right was observed in both phase maps. In contrast, in the NP case (Figure 2B), a clockwise spiral wave propagation with its center meandering around the right side of the region was observed in both measurements. In
Figure 2B, the white lines indicate the wave front, and the black dots indicate the PS pixels derived from the phase variance analysis. In another non-passive case with a complex excitation pattern (Figure 2C), a wave-break of 1-way propagation from left-bottom to right-top (white arrow in 0 ms) and subsequent figure-of-eight re-entries: a pair of rotations with the opposite directions (white curved arrows in 40 ms and 80 ms), were observed in OPT results. Also, in EXT results, wave-break and subsequent figure-of-eight re-entries were observed at similar timings and locations.
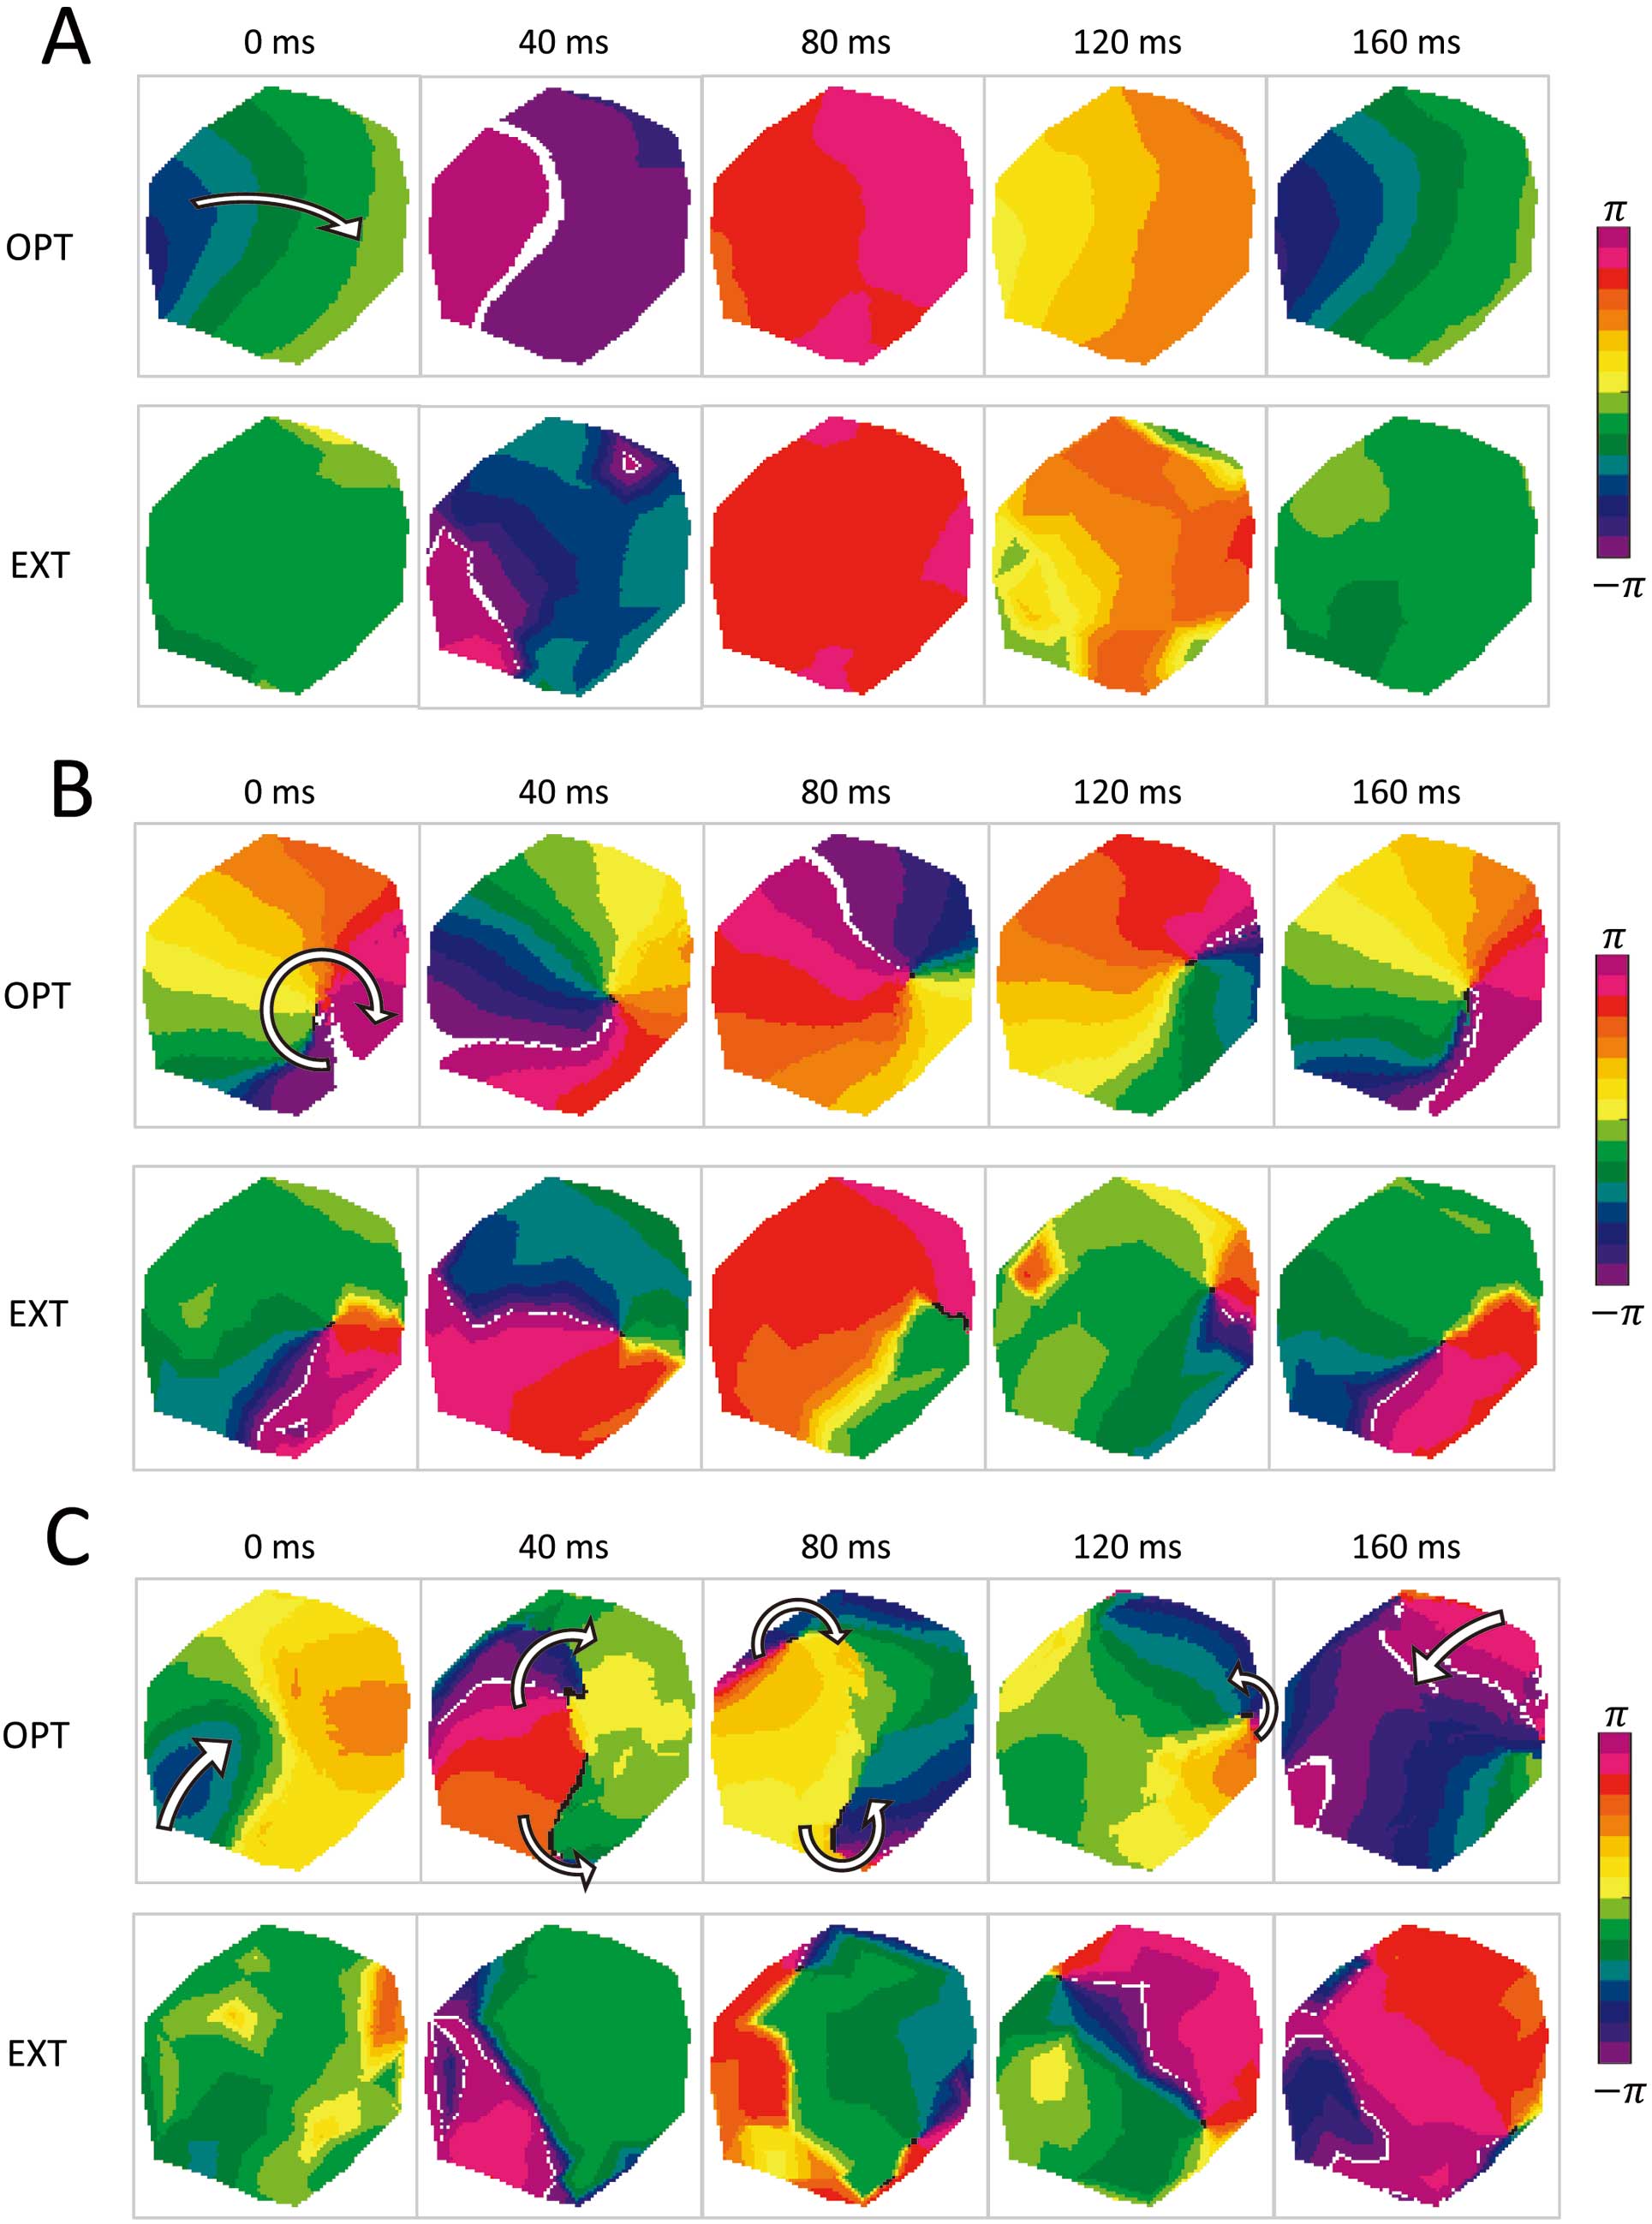
Figure 3
shows the quantitative evaluation results of similarities between EXT and OPT, and
Table
shows its summary.
Figure 3A
shows the scatter plot of %NP of EXT and OPT in each episode. The correlation coefficient of %NP of EXT and OPT was 0.95 (n=42). The sensitivity and specificity of the NP episode with a threshold of %NP=0.5 were 0.94 (15/16) and 0.94 (15/16), respectively. These results indicate that EXT mapping can categorize the excitation complexity in the measurement region with some accuracy.
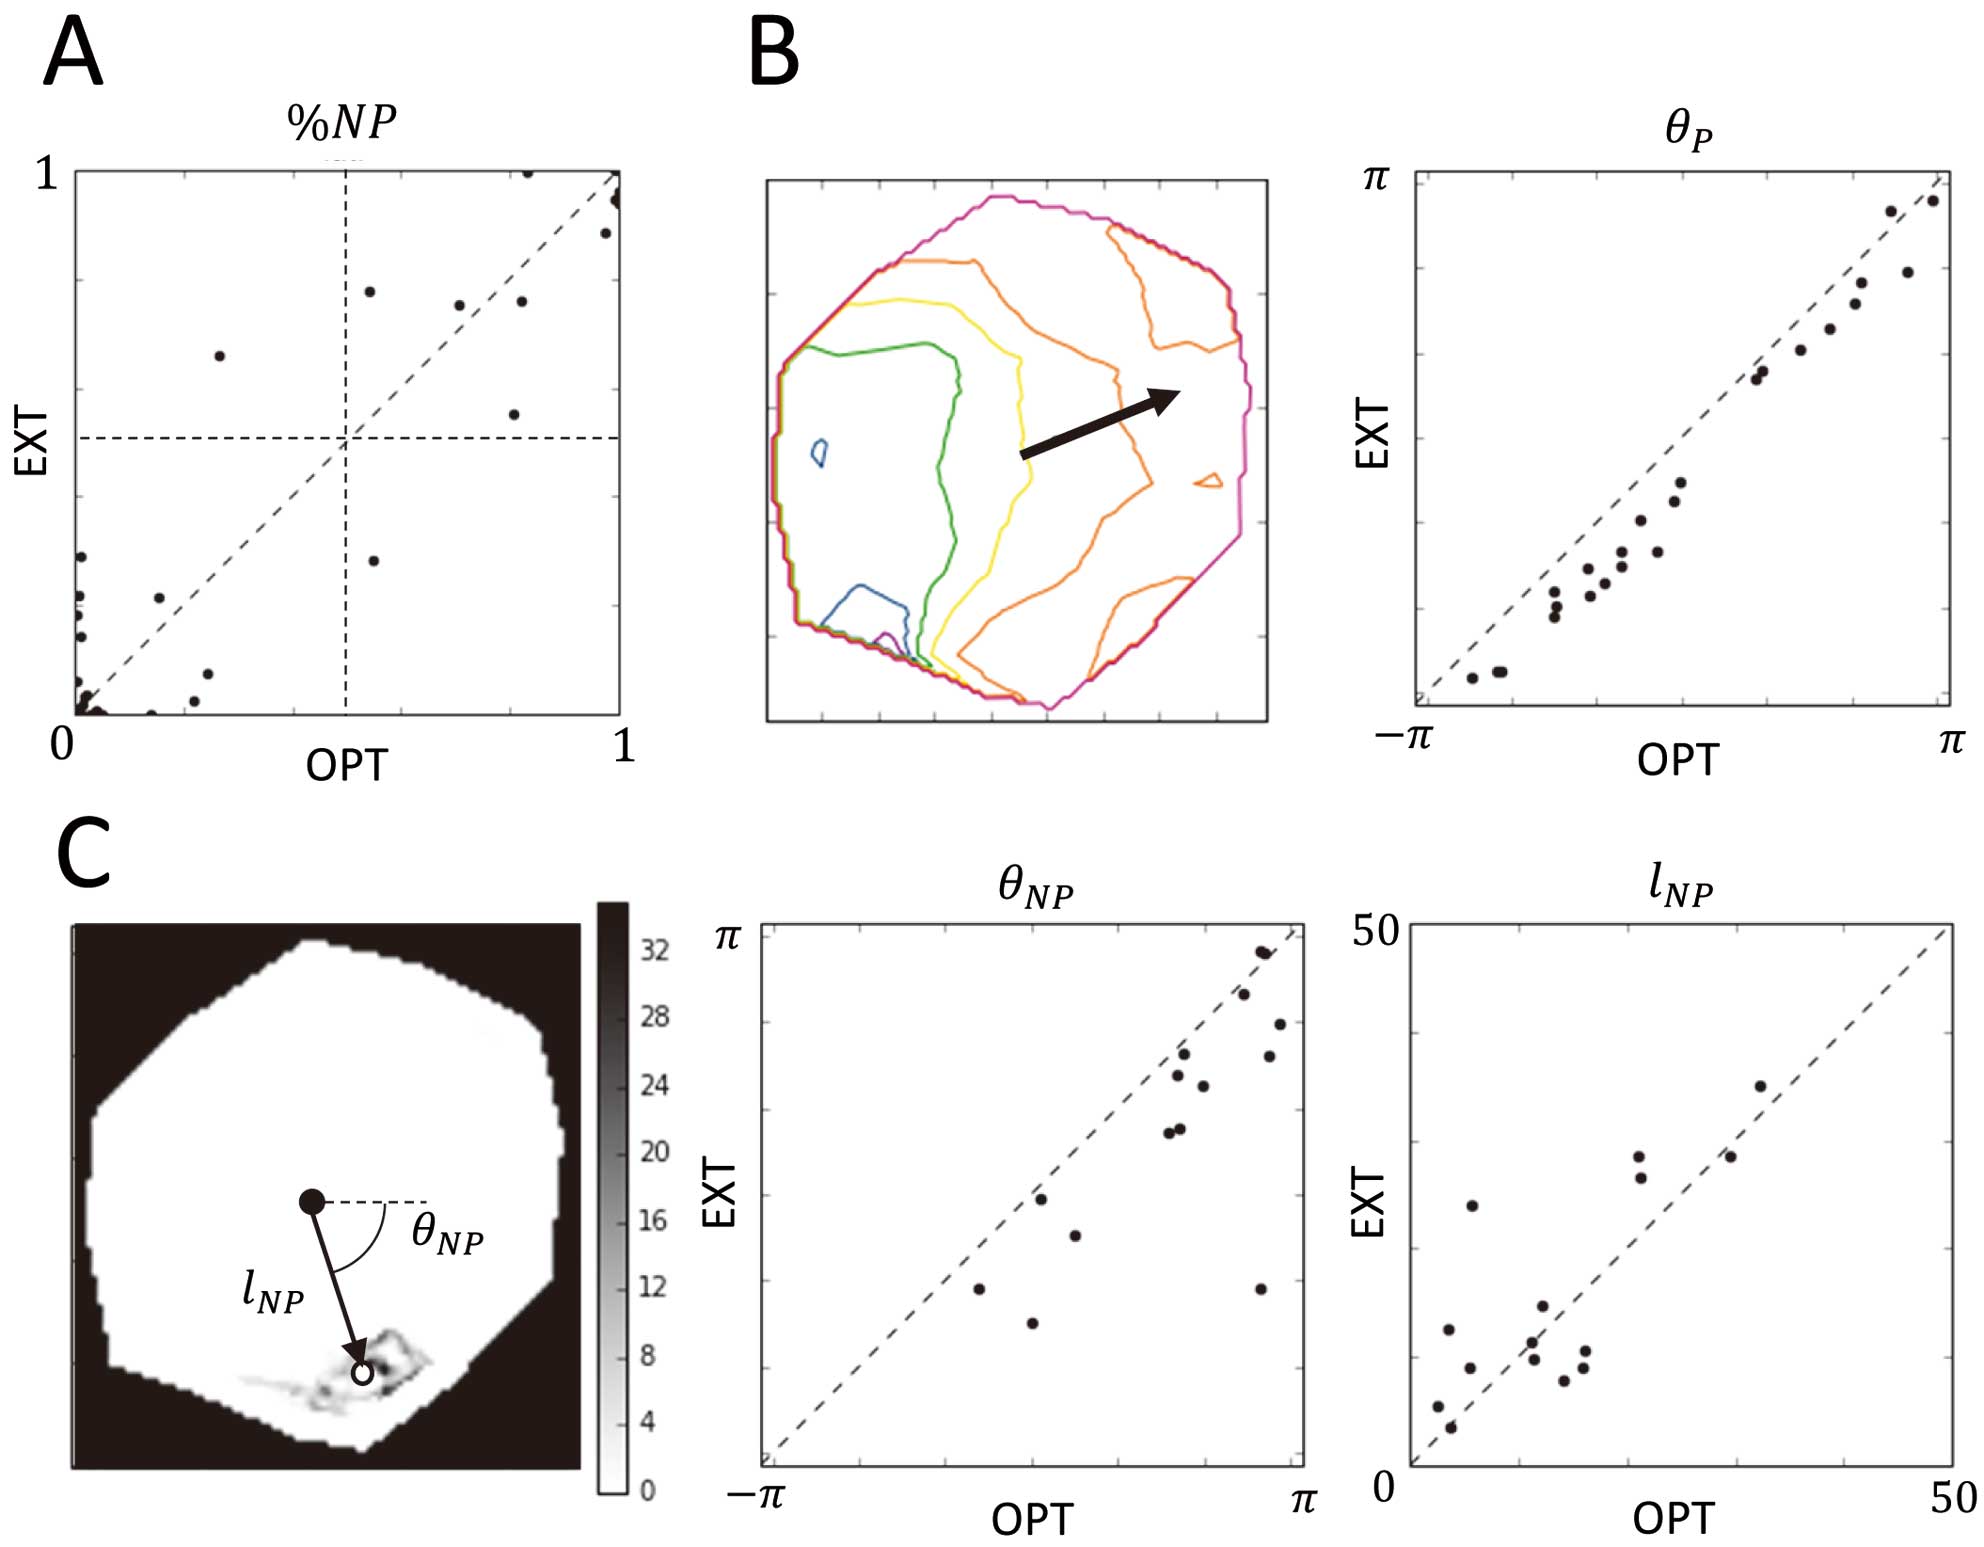
Table.
Results of Quantitative Evaluation of the Similarity Between ExTRa and Optical Membrane Potential Mapping
| Index |
Value |
| Correlation coefficient of %NP (N=42) |
0.95 |
| Sensitivity of NP episodes (%NP >0.5) |
0.94 (15/16) |
| Specificity of NP episodes (%NP >0.5) |
0.94 (15/16) |
| Correlation coefficient of average propagation direction θg (N=25) |
0.99 |
| Correlation coefficient of average SWR position relative to the center of region (N=15) |
| θNP |
0.74 |
| lNP |
0.76 |
| Mean distance of COGs of SWR (N=15) |
2 mm |
COG, center of gravity; NP, non-passive; SWR, spiral wave re-entry.
Figure 3B
shows the results of evaluation of the similarity of the average propagation direction in the true-negative (passive) cases (n=25). In the left-hand side image, the black arrow with its origin on the center of the region indicates the calculated average direction of propagation on a frame. The correlation coefficients of
lP
and θP
were 0.77 and 0.99, respectively. The right-hand side image of
Figure 3B
show scatter plots of θP
of OPT and EXT. The high correlation coefficient of the θP
indicates that EXT mapping can visualize 1-way propagation with proper direction.
Figure 3C
shows the results of evaluation of the similarity of the average SWR position in the true-positive NP cases (n=15). The left-hand side image shows an example of a PS trajectory image derived by accumulating detection results of PS on each frame along the time axis (SPS in Equation (3)). The dark area in the region (bottom) denotes that PSs were detected frequently around it. The white dot indicates the center of gravity of the SWR during the episode, and the black dot represents the center of the measurement region. The right-hand side graphs show the similarity of the relative position of the SWR from the center of the measurement region between EXT and OPT. Correlation coefficients of the polar coordinates θNP
and
lNP
were 0.74 and 0.76, respectively. The mean distance of the COGs of EXT and OPT was 2.0 mm. These results indicate that EXT can detect the average SWR position in the measurement region with some accuracy.
Discussion
The aim of this study was to validate phase mapping by using EXT, a diagnosis system developed by Ashihara’s group,17
for intraoperative visualization of the activation pattern for better ablation therapies. We developed an experimental system of simultaneous optical and electrical measurements using a transparent silicone electrode plate. Using this system, we performed the first experiment comparing EXT with OPT. The results of the measurement of those mapping methods of VTs on extracted rabbit hearts have revealed that EXT is able to visualize the activation pattern of both planar and spiral wave propagation in a manner consistent with OPT (Figure 2).
Reliability of EXT
Quantitative analysis of the similarity between OPT and EXT have revealed that EXT is able to judge the complexity of the excitation pattern with high accuracy (95%, 40/42) by calculating the index %NP in Equation (1). Moreover, the features of the activation pattern visualized by EXT, the propagation direction for passive cases, and the average SWR position for NP cases were also similar to those of the OPT measurement results (Table
and
Figure 3). These results suggest that EXT has good reliability to diagnose the excitation pattern and its complexity in the measurement region.
In contrast, by thresholding the %NP of EXT and OPT results with %NP=0.5, one false-positive and one false-negative erroneous detection of NP (Figure 3A) were observed in 42 episodes. In the false-negative NP case (the dot in the right bottom quadrant in
Figure 3A), a PS meandering around the boundary of the measurement region and iteratively entering and exiting the measurement region was observed in OPT. This error case suggests that care should be taken when interpreting %NP in cases where PSs are meandering around the boundary of the measurement region. In the false-positive NP case (the dot in the left top quadrant in
Figure 3A), the signal of the electrode around the center of the measurement region was not measured properly (Supplementary Figure). A possible reason for this issue was that the electrode was not properly attached to the heart surface due to the complex curvature of this surface. This error case suggests that attachment of the catheter electrodes is important to ensure reliable EXT results.
Simultaneous Measurement System
Not limited to the EXT, simultaneous measurement experiments are essential for validating electrode mapping methods. In a previous study, clinically applicable catheters were adopted for simultaneous measurement, but occlusion due to the shaft of the catheter may make the comparison difficult.27
In another study, a plaque with multiple electrode array was used for multiple stimulations,28
but the pressure caused by the planar plate pushing on the round heart surface may cause undesirable effects on the activation pattern in the region. To avoid these problems, we developed a transparent and flexible silicone electrode plate for simultaneous measurement (Figure 1), which enabled stable simultaneous measurement of electrical and optical measurements in most episodes. The developed system may also be valuable for validation of other electrode mapping systems.
Study Limitations
The aim of this study is to validate the ability of EXT to analyze the excitation pattern in the measurement region from the catheter electrode signals. There are several differences between the performed animal experiments and clinical measurements. Although EXT is an algorithm designed for visualization of excitation using a human non-PAF atrial myocyte model17,23
and the endocardial mapping catheter, we measured the rabbit ventricular epicardial surface in this validation study. In the developed simultaneous mapping system, the arrangement of the electrodes was at a 70% scale of the original catheter, taking into consideration the difference of the conduction velocity. These variations, due to the differences in the animal species, may affect the results. Although blood exists around the electrodes in real EXT, the electrodes in this study were attached to the surface of the sample perfused in the air. The epicardial surface of the rabbit ventricle wall is smoother than the endocardial surface of the human atrial wall; these differences in measurement conditions may also affect the electrode signal.
In contrast, even with the above differences, the observed excitation patterns in the measurement region had no significant difference from clinical EXT measurements in terms of its complexity, as shown in
Figure 3. The measured electrogram waveforms were also similar to clinical measurements. Thus, we believe that the experiment results support our conclusion that ExTRa mapping has reliability for analyzing the activation pattern from electrode signals.
In the future, simultaneous measurement experiments using whole heart samples from large animals and clinical endocardial mapping catheters are necessary for more reliable validation. Furthermore, ablation experiments using developed simultaneous OPT and EXT mapping systems are necessary to evaluate and improve the efficacy of the ablation outcomes based on EXT diagnosis.
Conclusions
In this study, we evaluated the reliability of phase mapping by using EXT in comparison with simultaneous measurement of high-resolution OPT. The evaluation results revealed that the phase map sequence of EXT is consistent with the analysis of high-resolution optical mapping. EXT has some reliability for analyzing the activation pattern in the ROI.
Disclosures
N.T., T.A., I.S., and M.Y. received a research grant from Nihon Kohden Corporation. N.T., T.A., I.S., and M.Y. received research grant from Nihon Kohden Corporation. N.T., I.S., and M.Y. received research grants from Biosense Webster Inc.
Acknowledgments
This study was supported by Grants-in Aid for Scientific Research (18H02802) to M.Y., (18K18357) N.T., and (18H04161) I.S., from the Japanese Society for Promotion of Science in Japan; Nihon Kohden collaborative grants supported M.Y., N.T., I.S., and T.A.
Supplementary Files
Please find supplementary file(s);
http://dx.doi.org/10.1253/circj.CJ-19-1020
References
- 1.
Haïssaguerre M, Jaïs P, Shah DC, Takahashi A, Hocini M, Quiniou G, et al. Spontaneous initiation of atrial fibrillation by ectopic beats originating in the pulmonary veins. N Engl J Med 1998; 339: 659–666.
- 2.
Haïssaguerre M, Sanders P, Hocini M, Takahashi Y, Rotter M, Sacher F, et al. Catheter ablation of long-lasting persistent atrial fibrillation: Critical structures for termination. J Cardiovasc Electrophysiol 2005; 16: 1125–1137.
- 3.
Takahashi Y, O’Neill MD, Hocini M, Reant P, Jonsson A, Jaïs P, et al. Effects of stepwise ablation of chronic atrial fibrillation on atrial electrical and mechanical properties. J Am Coll Cardiol 2007; 49: 1306–1314.
- 4.
O’Neill MD, Jaïs P, Takahashi Y, Jönsson A, Sacher F, Hocini M, et al. The stepwise ablation approach for chronic atrial fibrillation: Evidence for a cumulative effect. J Interv Card Electrophysiol 2006; 16: 153–167.
- 5.
Verma A, Jiang CY, Betts TR, Chen J, Deisenhofer I, Mantovan R, et al. Approaches to catheter ablation for persistent atrial fibrillation. N Engl J Med 2015; 372: 1812–1822.
- 6.
Narayan SM, Krummen DE, Shivkumar K, Clopton P, Rappel WJ, Miller JM. Treatment of atrial fibrillation by the ablation of localized sources: CONFIRM (Conventional Ablation for Atrial Fibrillation With or Without Focal Impulse and Rotor Modulation) trial. J Am Coll Cardiol 2012; 60: 628–636.
- 7.
Boyle PM, Zghaib T, Zahid S, Ali RL, Deng D, Franceschi WH, et al. Computationally guided personalized targeted ablation of persistent atrial fibrillation. Nat Biomed Eng 2019; 3: 870–879.
- 8.
Narayan SM, Baykaner T, Krummen D, Shivkumar K, Clopton P, Miller J. Firm ablation at rotors and focal sources has similarly high efficacy for paroxysmal and persistent atrial fibrillation. J Am Coll Cardiol 2013; 61: E328.
- 9.
Sanders P, Berenfeld O, Hocini M, Jaïs P, Vaidyanathan R, Hsu LF, et al. Spectral analysis identifies sites of high-frequency activity maintaining atrial fibrillation in humans. Circulation 2005; 112: 789–797.
- 10.
Atienza F, Almendral J, Jalife J, Zlochiver S, Ploutz-Snyder R, Torrecilla EG, et al. Real-time dominant frequency mapping and ablation of dominant frequency sites in atrial fibrillation with left-to-right frequency gradients predicts long-term maintenance of sinus rhythm. Heart Rhythm 2009; 6: 33–40.
- 11.
Seitz J, Bars C, Théodore G, Beurtheret S, Lellouche N, Bremondy M, et al. AF ablation guided by spatiotemporal electrogram dispersion without pulmonary vein isolation: A wholly patient-tailored approach. J Am Coll Cardiol 2017; 69: 303–321.
- 12.
Haissaguerre M, Hocini M, Denis A, Shah AJ, Komatsu Y, Yamashita S, et al. Driver domains in persistent atrial fibrillation. Circulation 2014; 130: 530–538.
- 13.
Oakes RS, Badger TJ, Kholmovski EG, Akoum N, Burgon NS, Fish EN, et al. Detection and quantification of left atrial structural remodeling with delayed-enhancement magnetic resonance imaging in patients with atrial fibrillation. Circulation 2009; 119: 1758–1767.
- 14.
Konings KTS, Smeets JLRM, Penn OC, Wellens HJJ, Allessie MA. Configuration of unipolar atrial electrograms during electrically induced atrial fibrillation in humans. Circulation 1997; 95: 1231–1241.
- 15.
Koonlawee N, John M, Erol K, Mark S, Buncha S, Thaveekiat V, et al. A new approach for catheter ablation of atrial fibrillation: Mapping of the electrophysiologic substrate. J Am Coll Cardiol 2004; 43: 2044–2053.
- 16.
Kumagai K, Sakamoto T, Nakamura K, Nishiuchi S, Hayano M, Hayashi T, et al. Combined dominant frequency and complex fractionated atrial electrogram ablation after circumferential pulmonary vein isolation of atrial fibrillation. J Cardiovasc Electrophysiol 2013; 24: 975–983.
- 17.
Sakata K, Okuyama Y, Ozawa T, Haraguchi R, Nakazawa K, Tsuchiya T, et al. Not all rotors, effective ablation targets for nonparoxysmal atrial fibrillation, are included in areas suggested by conventional indirect indicators of atrial fibrillation drivers: ExTRa Mapping project. J Arrhythmia 2018; 34: 176–184.
- 18.
Ishiguro YS, Honjo H, Opthof T, Okuno Y, Nakagawa H, Yamazaki M, et al. Early termination of spiral wave reentry by combined blockade of Na+ and L-type Ca2+ currents in a perfused two-dimensional epicardial layer of rabbit ventricular myocardium. Heart Rhythm 2009; 6: 684–692.
- 19.
Yamazaki M, Honjo H, Ashihara T, Harada M, Sakuma I, Nakazawa K, et al. Regional cooling facilitates termination of spiral-wave reentry through unpinning of rotors in rabbit hearts. Heart Rhythm 2012; 9: 107–114.
- 20.
Yamazaki M, Honjo H, Nakagawa H, Ishiguro Y, Okuno Y, Amino M, et al. Mechanisms of destabilization and early termination of spiral wave reentry in the ventricle by a class III antiarrhythmic agent, nifekalant. Am J Physiol Circ Physiol 2007; 292: H539–H548.
- 21.
Amino M, Yamazaki M, Nakagawa H, Honjo H, Okuno Y, Yoshioka K, et al. Combined effects of nifekalant and lidocaine on the spiral-type re-entry in a perfused 2-dimensional layer of rabbit ventricular myocardium. Circ J 2005; 69: 576–584.
- 22.
Kodama I, Honjo H, Yamazaki M, Nakagawa H, Ishiguro Y, Okuno Y, et al. Optical imaging of spiral waves: Pharmacological modification of spiral-type excitations in a 2-dimensional layer of ventricular myocardium. J Electrocardiol 2005; 38: 126–130.
- 23.
Ashihara T, Haraguchi R, Nakazawa K, Namba T, Ikeda T, Nakazawa Y, et al. The role of fibroblasts in complex fractionated electrograms during persistent/permanent atrial fibrillation: Implications for electrogram-based catheter ablation. Circ Res 2012; 110: 275–284.
- 24.
Gray RA, Pertsov AM, Jalife J. Spatial and temporal organization during cardiac fibrillation. Nature 1998; 392: 75–78.
- 25.
Tomii N, Yamazaki M, Arafune T, Honjo H, Shibata N, Sakuma I. Detection algorithm of phase singularity using phase variance analysis for epicardial optical mapping data. IEEE Trans Biomed Eng 2016; 63: 1795–1803.
- 26.
Tomii N, Yamazaki M, Arafune T, Kamiya K, Nakazawa K, Honjo H, et al. Interaction of phase singularities on spiral wave tail: Reconsideration of capturing the excitable gap. Am J Physiol Circ Physiol 2018; 315: 318–326.
- 27.
Berenfeld O, Ennis S, Hwang E, Hooven B, Grzeda K, Mironov S, et al. Time- and frequency-domain analyses of atrial fibrillation activation rate: The optical mapping reference. Heart Rhythm 2011; 8: 1758–1765.
- 28.
Johnson PL, Newton JC, Rollins DL, Knisley SB, Ideker RE, Smith WM. Intelligent multichannel stimulator for the study of cardiac arrhythmias. Ann Biomed Eng 2002; 30: 180–191.
