Abstract
Background:
Optical coherence tomography (OCT) provides valuable information to guide percutaneous coronary intervention (PCI) in acute coronary syndrome (ACS) regarding lesion preparation, stent sizing, and optimization. The aim of the present study was to compare lumen expansion of stent-treated lesions immediately after the procedure for ACS between OCT-guided PCI and angiography-guided PCI.
Methods and Results:
This study investigated stent-treated lesions immediately after PCI for ACS by using quantitative coronary angiography in 390 patients; 260 patients with OCT-guided PCI and 130 patients with angiography-guided PCI. Before stenting, the frequency of pre-dilatation and thrombus aspiration were not different between the OCT-guided and angiography-guided PCI groups. Stent diameter was significantly larger as a result of OCT-guided PCI (3.11±0.44 mm vs. 2.99±0.45 mm, P=0.011). In post-dilatation, balloon pressure-up (48% vs. 31%, P=0.001) and balloon diameter-up (33% vs. 6%, P<0.001) were more frequently performed in the OCT-guided PCI group. Minimum lumen diameter (2.55±0.35 mm vs. 2.13±0.50 mm, P<0.001) and acute lumen gain (2.18±0.54 mm vs. 1.72±0.63 mm, P<0.001) were significantly larger in the OCT-guided PCI group. Percent diameter stenosis (14±4% vs. 24±10%, P<0.001) and percent area stenosis (15±5% vs. 35±17%, P<0.001) were significantly smaller in the OCT-guided PCI group.
Conclusions:
OCT-guided PCI potentially results in larger lumen expansion of stent-treated lesions immediately after PCI in the treatment of ACS compared with angiography-guided PCI.
Optical coherence tomography (OCT) is a catheter-based imaging modality that provides high resolution images of the coronary artery. OCT allows us to assess coronary lumen geometry, lesion morphology, and plaque tissue characteristics.1
During percutaneous coronary intervention (PCI), OCT helps guide the procedure for lesion preparation, stent sizing, and stent optimization.1
OCT can be used in the treatment of acute coronary syndrome (ACS). ACS has more complex culprit lesion morphologies and a larger extent of coronary atherosclerosis compared with stable coronary artery disease.2
The detailed vascular information obtained by OCT may affect PCI in the treatment of ACS,3
and may improve acute results and late outcomes of PCI.
Stent expansion immediately after PCI is a strong predictor of late outcomes of PCI.4
Previous studies have demonstrated that OCT can accurately measure lumen diameter, whereas angiography measures 5% smaller than the actual diameter.5
Therefore, OCT guidance may contribute to larger balloon/stent selection and may lead to better stent expansion compared with angiography-alone guidance.
The aim of the present study was to compare the lumen expansion of stent-treated lesions immediately after the procedure in ACS between OCT-guided PCI and angiography-guided PCI using quantitative coronary angiography.
Methods
Study Population
Between January 2009 and December 2018, there were 1,455 ACS patients who underwent PCI using stents at Wakayama Medical University, Wakayama, Japan. Of these, 130 patients underwent PCI with angiography-alone guidance. Of the remaining 1,325 patients who underwent PCI with intravascular imaging guidance, we identified the latest consecutive 260 patients with OCT guidance. To reduce selection bias in the OCT-guided PCI group and boost the statistical power of the test, the number of study participants in the OCT-guided PCI group was set to twice that of the angiography-guided PCI group. The present study compared angiographic acute results and 1-year clinical outcomes between the OCT-guided PCI and angiography-guided PCI groups.
ACS was determined on the basis of the fourth universal definition of myocardial infarction6
and the Canadian Cardiovascular Society grading of angina pectoris,7
and was defined as ischemic discomfort presenting with new ST-T segment changes on the electrocardiogram and elevated troponin levels (i.e., ST-elevation myocardial infarction [STEMI] or non-ST elevation myocardial infarction [NSTEMI]) or ischemic discomfort that was Canadian Cardiovascular Society class 3 or 4 without troponin elevation (i.e., unstable angina). The culprit lesion of ACS was identified by the operator at the time of PCI on the basis of angiographic lesion morphology, as well as electrocardiographic findings and echocardiographic results.
The use of OCT was at the operator’s discretion. OCT was performed using ILUMIEN OPTIS (Abbott Vascular, Santa Clara, CA, USA), as reported previously.8–12
OCT images were acquired during an intracoronary injection of contrast media using an injector pump. OCT-guided PCI was performed according to the OPINION and COCOA criteria.8–12
Pre-dilatation and/or thrombus aspiration were performed in the total or subtotal occlusion on angiography. Repetitive thrombus aspiration was performed in the thrombus-rich lesions (identified by OCT images of a high thrombus burden that interferes with the assessment of the culprit lesion morphology and distal vessel dimensions). Balloon size and inflation pressure for pre-dilatation were increased in severe calcified lesions. Proximal and distal reference sites adjacent to the lesion were determined at coronary segments with normal-looking lumen and no lipid-rich plaque. Stent diameter was determined to be 0–0.5 mm larger than the distal reference lumen diameter. Stent length was determined by measuring distance from the distal to proximal reference site. Stent landing zone was navigated by using an OCT-angiography co-registration system. Post-dilatation was performed aiming to achieve a stent expansion index (defined as minimum stent area/average reference lumen area) >0.9 without major tissue protrusion and stent malapposition. An additional stent was used to treat major stent-edge dissection. Thrombus aspiration was conducted to remove intra-stent thrombus protrusion with potential to provoke flow disturbance. All operators who performed OCT-guided PCI were educated about the OPINION and COCOA criteria, and at least 1 experienced OCT specialist helped operators during the procedure.
Angiography-guided PCI was performed by operators with little or no experience of using OCT. Angiography-guided PCI was performed according to our local standard practice without any intravascular imaging guidance. Pre-dilatation, thrombus aspiration and distal protection were performed at the operator’s discretion. Stent size and length were determined by visual estimation on the coronary angiogram. Post-dilation with larger balloon and/or higher inflation pressure was performed if the lumen expansion was insufficient. An additional stent was used if there was a dissection or residual stenosis at the implanted stent edge.
The present study was approved by the institutional review board, and written informed consent was waived by the institutional review board because of the retrospective design of the study.
PCI
PCI procedural data were collected by reviewing medical records. Procedure changes based on the OCT or angiography findings included balloon pressure-up, balloon diameter-up, repeat thrombus aspiration, distal protection, and additional stent implantation. Drug-eluting stents (DES) included 153 XIENCE (Abbott Vascular), 67 SYNERGY (Boston Scientific, Marlborough, MA, USA), 65 ULTIMASTER (Terumo, Tokyo, Japan), and 6 ORSIRO (Biotronik, Bülach, Switzerland). Bare-metal stent (BMS) included 99 VISION (Abbott Vascular).
Angiographic Analysis
Quantitative coronary angiographic analysis was performed using a validated automated edge detection algorithm (QAngio XA 3D 1.0.28.4; Medis Medical Imaging System, Leiden, The Netherlands) by an experienced investigator (A.K.M.K.). The reference lumen diameter, minimum lumen diameter, percent diameter stenosis ([1−minimum lumen diameter/reference lumen diameter]×100), percent area stenosis ([1−minimum lumen area/reference lumen area]×100], lesion length, and acute lumen gain (minimum lumen diameter immediately after PCI−minimum lumen diameter before PCI) were calculated. Bifurcation lesion (defined as a lesion located in a bifurcation point with a side branch >2 mm in diameter), severe calcification (defined by radiopacities compromising both sides of the arterial lumen on an X-ray fluoroscopic image without cardiac motion before contrast injection) and aorto-ostial disease (defined as a lesion that begins within 3 mm of the origin of a major epicardial artery) were identified. Thrombolysis In Myocardial Infarction (TIMI) flow grade was assessed as reported previously.13
No-reflow phenomenon was defined as TIMI flow grade 0, 1 or 2 without mechanical obstruction on the final angiogram.13
Distal embolization was defined as the angiographic cut-off of the distal branch or vessel on the final angiogram. Stent edge dissection (defined by a coronary lumen separation in 5-mm distally or proximally to the stent edges) and side branch occlusion were assessed on the final angiogram. Total volume of contrast media during the procedure was evaluated.
Clinical Outcomes
Clinical outcomes were investigated through medical records review and/or telephone interview with patients. Peri-procedural events included contrast-induced nephropathy and stroke. Contrast-induced nephropathy was defined by an absolute (≥0.5 mg/dL) or a relative increase (≥25%) in serum creatinine at 48–72 h after PCI compared to baseline serum creatinine values.8
Peri-procedural stroke was defined as a stroke (defined later) that occurred between admission to the catheter laboratory and 48 h after PCI. Late events included major adverse cardiovascular events (MACE) that was defined as a composite of cardiac death, MI, clinical-driven target-lesion revascularization (TLR), and stroke during 1-year follow up. Cardiac death was defined as any death not clearly attributable to a non-cardiac cause.6
MI included type 1 MI (spontaneous) and type 4 MI (PCI-related, stent thrombosis or restenosis) according to the fourth universal definition of myocardial infarction.6
TLR was defined as repeat revascularization of the PCI-treated lesions and was considered to be clinically driven if revascularization was performed on a patient who had a positive result on a functional ischemia test and clinical symptoms such as chest pain.8
Stroke was defined as a sudden onset of neurological deficit resulting from vascular lesions of the brain and persisting for >24 h.8
Statistical Analysis
Statistical analysis was performed by using JMP 13.0 (SAS Institute, Cary, NC, USA). Categorical variables were presented as frequency and percentage and were compared by using a chi-squared test or Fisher’s exact test (if an expected cell count was <5). Continuous variables were presented as mean±standard deviation and were compared by using an unpaired Student’s t-test. The Cox proportional hazards model was used to calculate the hazard ratio (HR) and 95% confidence intervals (95% CI) for the between-group comparisons of clinical outcome. P<0.05 was considered statistically significant.
Results
Patient Characteristics
Baseline clinical characteristics of patients were not different between the OCT-guided PCI and angiography-guided PCI groups, except for age (70±13 years vs. 73±11 years, P=0.040;
Table 1).
Table 1.
Patient Clinical Characteristics
| |
OCT-PCI
(n=260) |
Angio-PCI
(n=130) |
P value |
| Age, years |
70±13 |
73±11 |
0.040 |
| Male sex |
176 (68) |
90 (69) |
0.758 |
| Coronary risk factors |
| Hypertension |
219 (84) |
109 (84) |
0.922 |
| Diabetes mellitus |
101 (39) |
61 (47) |
0.127 |
| Dyslipidemia |
196 (75) |
97 (75) |
0.868 |
| Current smoking |
78 (30) |
50 (38) |
0.093 |
| Family history of CAD |
39 (15) |
14 (11) |
0.250 |
| Obesity (BMI ≥25 kg/m2) |
65 (25) |
33 (25) |
0.934 |
| Hemodialysis |
9 (3) |
9 (7) |
0.125 |
| CKD (eGFR <30 mL/min/1.73 m2) |
24 (9) |
20 (15) |
0.076 |
| Clinical presentation |
|
|
0.638 |
| STEMI |
200 (77) |
97 (75) |
|
| NSTEMI |
42 (16) |
18 (14) |
|
| UAP |
18 (7) |
15 (12) |
|
| Medications after PCI |
| DAPT |
252 (97) |
130 (100) |
0.056 |
| Statin |
227 (87) |
104 (80) |
0.072 |
| Others |
| LVEF, % |
46±9 |
45±12 |
0.168 |
| LDL-C, mg/dL |
108±40 |
103±38 |
0.226 |
Values are presented as number (%) or mean±standard deviation. Serum LDL-C level was measured after PCI. LVEF was measured on echocardiography before PCI. Angio, angiography; BMI, body mass index; CAD, coronary artery disease; CKD, chronic kidney disease; DAPT, dual anti-platelet therapy; eGFR, estimated glomerular filtration rate; LDL-C, low-density lipoprotein cholesterol; LVEF, left ventricular ejection fraction; NSTEMI, non-ST-elevation myocardial infarction; OCT, optical coherence tomography; PCI, percutaneous coronary intervention; STEMI, ST-elevation myocardial infarction; UAP, unstable angina pectoris.
Angiographic findings before PCI are shown in
Table 2. The culprit vessel and the culprit lesion location were not different between the 2 groups. Reference lumen diameter, minimum lumen diameter, percent diameter stenosis and lesion length were not different between the 2 groups, although percent area stenosis was significantly smaller in the OCT-guided PCI compared with the angiography-guided PCI groups (91±12% vs. 94±9%, P=0.022). The frequency of TIMI flow grade 0, 1 or 2, bifurcation lesion, severe calcification, and aorto-ostial disease were comparable between the 2 groups.
Table 2.
Angiographic Findings Before PCI
| |
OCT-PCI
(n=260) |
Angio-PCI
(n=130) |
P value |
| Vessels |
|
|
0.121 |
| LAD |
133 (51) |
53 (41) |
|
| LCX |
31 (12) |
20 (15) |
|
| RCA |
90 (35) |
50 (39) |
|
| LMCA |
6 (2) |
7 (5) |
|
| Lesion location |
|
|
0.233 |
| Proximal |
126 (49) |
63 (48) |
|
| Mid |
96 (37) |
40 (31) |
|
| Distal |
38 (15) |
27 (21) |
|
| QCA |
| Reference lumen diameter, mm |
2.62±0.47 |
2.56±0.61 |
0.257 |
| Minimum lumen diameter, mm |
0.38±0.38 |
0.41±0.42 |
0.387 |
| Percent diameter stenosis, % |
84±17 |
84±17 |
0.890 |
| Percent area stenosis, % |
91±12 |
94±9 |
0.022 |
| Lesion length, mm |
24±8 |
22±8 |
0.065 |
| TIMI flow grade |
|
|
0.869 |
| 0 |
108 (42) |
54 (42) |
|
| 1 |
24 (9) |
10 (8) |
|
| 2 |
63 (24) |
33 (25) |
|
| 3 |
65 (25) |
33 (25) |
|
| Bifurcation lesion |
56 (22) |
37 (28) |
0.130 |
| Severe calcification |
39 (15) |
17 (13) |
0.610 |
| Aorto-ostial disease |
2 (1) |
2 (2) |
0.863 |
Values are presented as number (%) or mean±standard deviation. LAD, left anterior descending artery; LCX, left circumflex artery; LMCA, left main coronary artery; QCA, quantitative coronary angiography; RCA, right coronary artery; TIMI, Thrombolysis in Myocardial Infarction. Other abbreviations as in Table 1.
Procedural characteristics are shown in
Table 3. The frequency of pre-dilatation and thrombus aspiration before stent implantation was not different between OCT-guided PCI and angiography-guided PCI groups. Stent diameter was significantly larger in the OCT-guided PCI group compared with the angiography-guided PCI group (3.11±0.44 mm vs. 2.99±0.45 mm, P=0.011). Stent length was significantly longer in the OCT-guided PCI group compared with the angiography-guided PCI group (24±9 mm vs. 21±9 mm, P=0.013). Multiple stent use was less frequent in the OCT-guided PCI group compared with the angiography-guided PCI group (8% vs. 19%, P=0.001). DES were more frequently used in the OCT-guided PCI group compared with the angiography-guided PCI group (98% vs. 27%, P<0.001). The frequency of post-dilatation was significantly higher in the OCT-guided PCI group compared with the angiography-guided PCI group (64% vs. 52%, P=0.016). Maximum balloon diameter (3.26±0.49 mm vs. 3.04±0.48 mm, P<0.001), balloon-to-artery ratio (1.12±0.12 vs. 1.08±0.14, P=0.003) were significantly larger, and maximum inflation pressure (16±5 atm vs. 14±5 atm, P<0.001) was significantly higher in the OCT-guided PCI group compared with the angiography-guided PCI group.
Table 3.
Procedural Characteristics
| |
OCT-PCI
(n=260) |
Angio-PCI
(n=130) |
P value |
| Pre-stenting |
| Pre-dilatation |
232 (89) |
116 (89) |
1.000 |
| Thrombus aspiration |
93 (36) |
54 (42) |
0.268 |
| Stenting |
| Stent diameter, mm |
3.11±0.44 |
2.99±0.45 |
0.011 |
| Stent length, mm |
24±9 |
21±9 |
0.013 |
| No. of stent |
|
|
0.001 |
| 1 |
240 (92) |
105 (81) |
|
| 2 |
20 (8) |
25 (19) |
|
| Stent type |
|
|
<0.001 |
| DES |
256 (98) |
35 (27) |
|
| BMS |
4 (2) |
95 (73) |
|
| Post-stenting |
| Post-dilatation |
167 (64) |
67 (52) |
0.016 |
| Maximum balloon diameter, mm |
3.26±0.49 |
3.04±0.48 |
<0.001 |
| Balloon-to-artery ratio |
1.12±0.12 |
1.08±0.14 |
0.003 |
| Maximum inflation pressure, atm |
16±5 |
14±5 |
<0.001 |
Values are presented as number (%) or mean±standard deviation. BMS, bare metal stent; DES, drug eluting stent. Other abbreviations as in Table 1.
PCI procedural changes are shown in
Table 4. Before stenting, balloon pressure-up (26% vs. 15%, P=0.020) and balloon diameter-up (33% vs. 15%, P<0.001) were more frequent used in OCT-guided PCI compared with angiography-guided PCI, although repeat thrombus aspiration and distal protection were performed comparably in both groups. After stenting, balloon pressure-up (48% vs. 31%, P=0.001) and balloon diameter-up (33% vs. 6%, P<0.001) were more frequent in the OCT-guided PCI group compared with the angiography-guided PCI group. An additional stent (8% vs. 19%, P=0.001) and thrombus aspiration after stenting (4% vs. 12%, P=0.006) were less frequent in the OCT-guided PCI group compared with the angiography-guided PCI group.
Table 4.
PCI Procedural Changes
| |
OCT-PCI
(n=260) |
Angio-PCI
(n=130) |
P value |
| Pre-stenting |
| Balloon pressure-up |
67 (26) |
20 (15) |
0.020 |
| Balloon diameter-up |
87 (33) |
19 (15) |
<0.001 |
| Repeat thrombus aspiration |
22 (8) |
5 (4) |
0.091 |
| Distal protection |
12 (5) |
3 (2) |
0.264 |
| Post-stenting |
| Balloon pressure-up |
124 (48) |
40 (31) |
0.001 |
| Balloon diameter-up |
87 (33) |
8 (6) |
<0.001 |
| Additional stent |
20 (8) |
25 (19) |
0.001 |
| Thrombus aspiration |
11 (4) |
15 (12) |
0.006 |
Values are presented as number (%). Abbreviations as in Table 1.
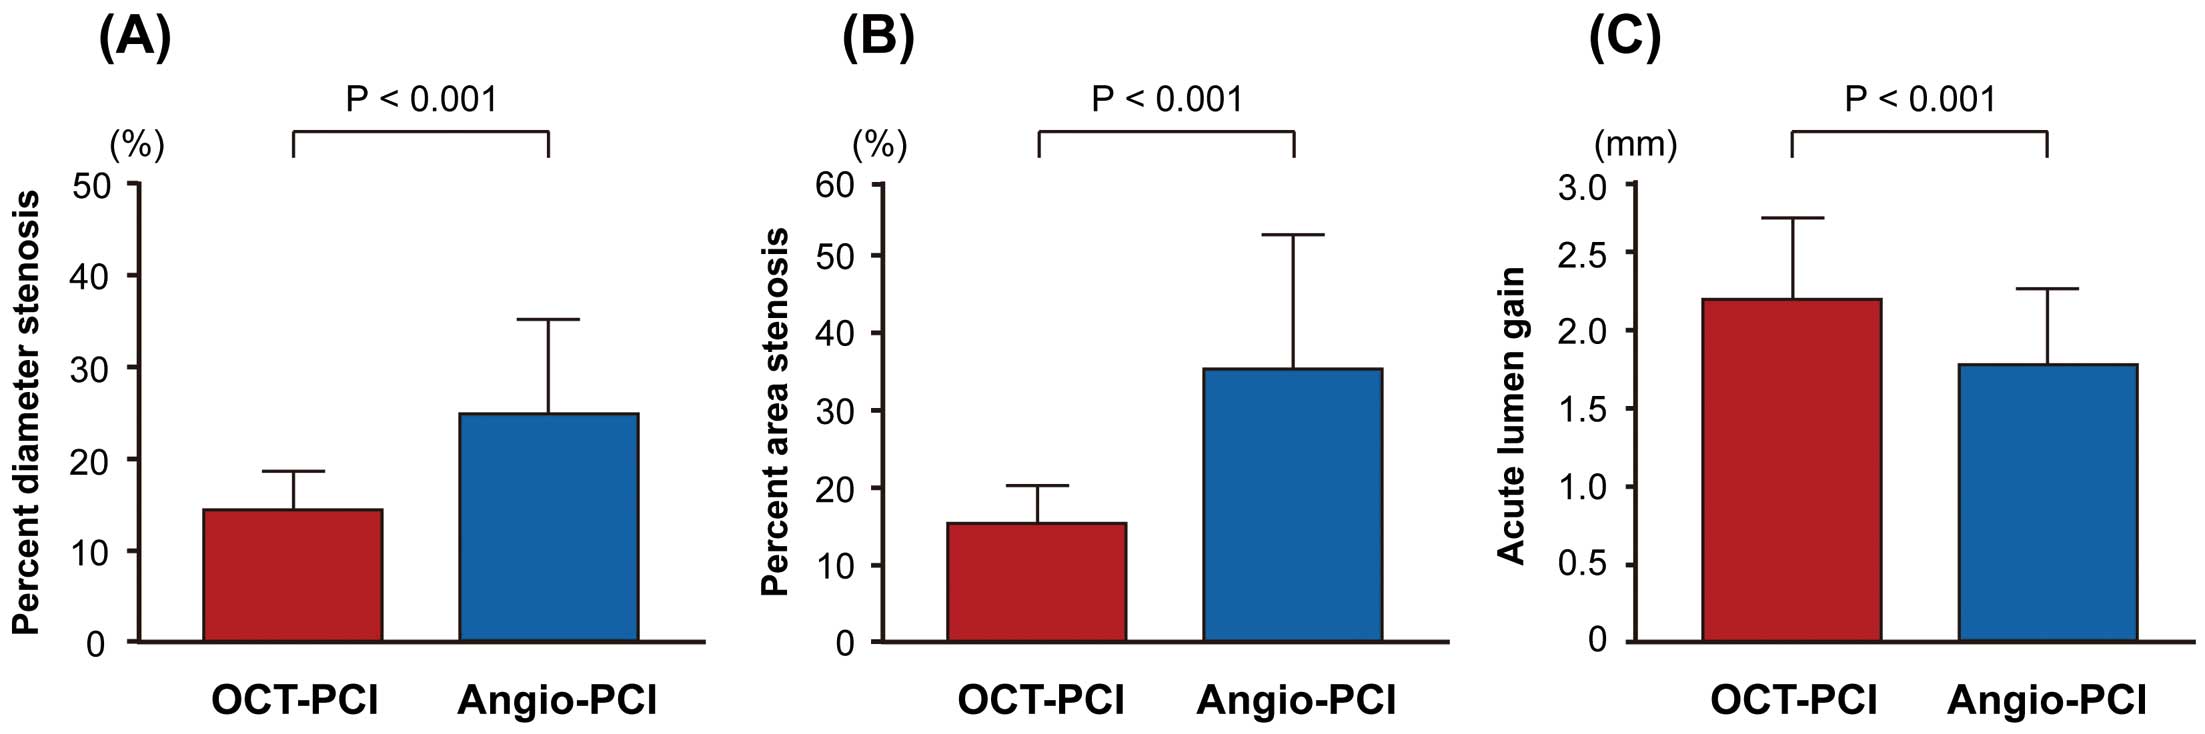
Angiographic findings immediately after PCI are shown in
Table 5
and
Figure. Minimum lumen diameter (2.55±0.35 mm vs. 2.13±0.50 mm, P<0.001) and acute lumen gain (2.18±0.54 mm vs. 1.72±0.63 mm, P<0.001) were significantly larger in the OCT-guided PCI group compared with the angiography-guided PCI group. Percent diameter stenosis (14±4% vs. 24±10%, P<0.001) and percent area stenosis (15±5% vs. 35±17%, P<0.001) were significantly smaller in the OCT-guided PCI group compared with the angiography-guided PCI group. No-reflow (10% vs. 25% P<0.001), distal embolization (5% vs. 11% P=0.022), and stent edge dissection (0% vs. 3%, P=0.005) were less frequently found in the OCT-guided PCI group compared with the angiography-guided PCI group. Side branch occlusion was comparably seen between the 2 groups. Total contrast volume was not different between the OCT-guided PCI and angiography-guided PCI groups.
Table 5.
Angiographic Findings Immediately After PCI
| |
OCT-PCI
(n=260) |
Angio-PCI
(n=130) |
P value |
| QCA |
| Reference lumen diameter, mm |
2.91±0.35 |
2.86±0.58 |
0.220 |
| Minimum lumen diameter, mm |
2.55±0.35 |
2.13±0.50 |
<0.001 |
| Percent diameter stenosis, % |
14±4 |
24±10 |
<0.001 |
| Percent area stenosis, % |
15±5 |
35±17 |
<0.001 |
| Acute lumen gain, mm |
2.18±0.54 |
1.72±0.63 |
<0.001 |
| TIMI flow grade |
|
|
<0.001 |
| 0 |
0 (0) |
0 (0) |
|
| 1 |
0 (0) |
2 (2) |
|
| 2 |
27 (10) |
30 (23) |
|
| 3 |
233 (90) |
98 (75) |
|
| No-reflow |
27 (10) |
32 (25) |
<0.001 |
| Distal embolization |
12 (5) |
14 (11) |
0.022 |
| Stent edge dissection |
0 (0) |
4 (3) |
0.005 |
| Side branch occlusion |
7 (3) |
6 (5) |
0.319 |
| Total contrast volume, mL |
145±56 |
139±67 |
0.374 |
Values are presented as number (%) or mean±standard deviation. Abbreviations as in Tables 1,2.
Clinical outcomes are shown in
Table 6. The frequency of contrast-induced nephropathy was not different between the OCT-guided PCI and angiography-guided PCI groups. There was no peri-procedural stroke in both groups. The frequency of MACE during 1-year follow up was significantly lower in the OCT-guided PCI group compared with the angiography-guided PCI group.
Table 6.
Clinical Outcomes
| |
OCT-PCI
(n=260) |
Angio-PCI
(n=130) |
HR (95% CI) |
P value |
| Peri-procedural events |
| Contrast-induced nephropathy |
10 (4) |
5 (4) |
1.00 (0.81–1.24) |
1.000 |
| Stroke |
0 (0) |
0 (0) |
NA |
NA |
| Late events (1-year) |
| MACE |
13 (5) |
15 (12) |
0.41 (0.20–0.87) |
0.020 |
| Cardiac death |
7 (3) |
8 (6) |
0.43 (0.16–1.19) |
0.103 |
| MI |
2 (1) |
4 (3) |
0.24 (0.04–1.28) |
0.095 |
| Clinically driven TLR |
2 (1) |
2 (2) |
0.46 (0.06–3.25) |
0.435 |
| Stroke |
2 (1) |
1 (1) |
0.95 (0.09–10.53) |
0.970 |
Values are presented as number (%). CI, confidence interval; HR, hazard ratio; MACE, major adverse cardiovascular event; MI, myocardial infarction; NA, not applicable; TLR, target lesion revascularization. Other abbreviations as in Table 1.
Discussion
The main finding of the present study was as follows: OCT-guided PCI showed larger lumen expansion of stent-treated lesions immediately after PCI in patients with ACS compared with angiography-guided PCI. Our data suggest the superiority of OCT-guided PCI over angiography-guided PCI in patients with ACS.
Acute Results
Sufficient stent expansion is one of the key goals of PCI. To date, few studies have compared stent expansion between OCT-guided PCI and angiography-guided PCI.9,10,14,15
The ILUMIEN III Trial (Optical coherence tomography compared with intravascular ultrasound and with angiography to guide coronary stent implantation (ILUMIEN III: OPTIMIZE PCI): a randomised controlled trial) demonstrated the numerically larger OCT-measured minimum stent area in OCT-guided PCI was used compared with angiography-guided PCI.14
The DOCTORS Study (Does Optical Coherence Tomography Optimize Results of Stenting Study) showed the significantly higher fractional flow reserve in the stent-treated vessels in OCT-guided PCI was used compared with angiography-guided PCI.15
The OPINION trial revealed similar angiographic diameter stenosis in the stent-treated lesions between OCT-guided PCI and intravascular ultrasound (IVUS)-guided PCI, while assuming the advantage of IVUS-guided PCI over angiography-guided PCI.9,10
The present study added new evidence to these previous results. Our results clearly showed that OCT-guided PCI provided larger angiographic in-stent minimum lumen diameter compared with angiography-guided PCI.
Procedure Changes
OCT guidance brings changes to the PCI procedure. The ILUMIN I trial reported that physicians’ decision-making of the procedure was affected by OCT imaging prior to PCI in 57% and post-PCI in 27% of the cases.16
The OPINION trial reported that additional PCI procedures for lesion preparation and PCI optimization were conducted in 38% of the cases with OCT guidance.10
In the present study, larger stents, larger balloons and higher inflation pressures were used in OCT-guided PCI compared with angiography-guided PCI. These aggressive procedures induced by OCT guidance might lead to better stent expansion immediately after PCI.
Benefits in ACS
It is well known that OCT contributes to stent sizing with the accurate measurement of lumen, tissue characterization of the culprit plaque, identification of ideal stent-edge landing zone free from lipid plaque, and detection of inadequate stent findings such as underexpansion, malposition, tissue/thrombus protrusion, and dissection.17
In addition to these clinical values, the use of OCT offers several benefits, especially in PCI for ACS. Detection of thrombus is useful for identification of culprit lesions in ACS without angiographically significant stenotic lesions (e.g., myocardial infarction with non-obstructive coronary arteries [MINOCA]).2
Differentiation of plaque rupture, erosion, calcified nodule, and others (e.g., spontaneous coronary artery dissection) allows lesion-specific treatment in ACS.18
Identification of lipid- and/or thrombus-rich lesions limits over-dilatation and reduces the risk of distal embolism and slow/no-reflow.19
Assessment of stent expansion that cannot be estimated by angiographic luminography due to abundant tissue/thrombus protrusions in ACS is useful in determining the endpoint of PCI.4
Late Clinical Outcome
The late clinical outcome of OCT-guided PCI for ACS is of interest. The CLI-OPCI Study (Centro per la Lotta contro l’Infarto-Optimisation of Percutaneous Coronary Intervention study) of 670 PCIs (including 406 [61%] PCI for ACS) retrospectively demonstrated that OCT-guided PCI had a significantly lower 1-year risk of MACE that consisted of cardiac death, MI, and repeat revascularization compared with angiography-guided PCI (9.6% vs. 14.8%, P=0.044).20
A meta-analysis of 31 intravascular imaging studies (including 7 OCT studies that allowed enrollment of ACS) encompassing 17,882 patients showed that the OCT guidance in PCI was associated with a significant reduction of cardiovascular death compared with angiography-alone guidance (HR=0.31; 95% CI=0.13–0.66).21
A subgroup analysis of PCI for ACS (n=37,449) from the Pan-London PCI Cohort study reported that OCT-guided PCI showed a significantly lower mortality at a median of 4.8 years compared with angiography-guided PCI (P=0.002).22
Our data might support these results because sufficient stent expansion is associated with better clinical outcome. However, these previous studies were retrospective and included selection bias. Results from ongoing prospective randomized trials such as COCOA11
and OPINION-ACS12
will provide more credible evidence supporting superiority of OCT over angiography alone in guiding PCI for ACS with respect to the late clinical outcome.
Study Limitations
There are several limitations that should be acknowledged. First, this was a retrospective study. The use of OCT during PCI was at the operator’s discretion. Also, the patient enrollment period was different between OCT-guided PCI and angiography-guided PCI. Hence, there might be a selection bias. However, the baseline characteristics of patients and lesions were comparable between the 2 groups. Second, the proportion of DES and BMS were significantly different between the 2 groups; therefore, caution is needed in interpreting the results regarding late clinical outcome. However, this difference in stent type might not affect the stent expansion immediately after PCI (primary endpoint). Third, the present study did not have clear OCT criteria for post-dilatation, thrombus aspiration and distal protection to prevent no-reflow and/or distal embolization. Further study is needed to determine whether OCT-guided PCI reduces no-reflow and distal embolization. Finally, the fact that we were able to collect limited amounts of information for individual patients and also that the number of studied patients was moderate in size precludes performing propensity score matching to control for confounding.
Conclusions
In this retrospective analysis, OCT-guided PCI was associated with larger lumen expansion of stent-treated lesions immediately after PCI in ACS compared with angiography-guided PCI. These data warrant a large-scale randomized trial to establish whether OCT-guided PCI results in superior clinical outcomes compared to angiography-guided PCI.
Funding Sources
This study received no funding.
Disclosures
T.A. has received lecture fees and research grants from Abbott Vascular. T.K. has received lecture fees from Abbott Vascular.
T.A. is an Editorial Team member of
Circulation Journal. All other authors have no conflicts of interest to declare.
IRB Information
Wakayama Medical University Ethics Committee approved this study (Reference number=2996).
References
- 1.
Räber L, Mintz GS, Koskinas KC, Johnson TW, Holm NR, Onuma Y, et al. ESC Scientific Document Group. Clinical use of intracoronary imaging. Part 1: Guidance and optimization of coronary interventions. An expert consensus document of the European Association of Percutaneous Cardiovascular Interventions. Eur Heart J 2018; 39: 3281–3300.
- 2.
Johnson TW, Räber L, di Mario C, Bourantas C, Jia H, Mattesini A, et al. Clinical use of intracoronary imaging. Part 2: Acute coronary syndromes, ambiguous coronary angiography findings, and guiding interventional decision-making: An expert consensus document of the European Association of Percutaneous Cardiovascular Interventions. Eur Heart J 2019; 40: 2566–2584.
- 3.
Fujii K, Kubo T, Otake H, Nakazawa G, Sonoda S, Hibi K, et al. Expert consensus statement for quantitative measurement and morphological assessment of optical coherence tomography. Cardiovasc Interv Ther 2020; 35: 13–18.
- 4.
Prati F, Romagnoli E, Gatto L, La Manna A, Burzotta F, Limbruno U, et al. Clinical impact of suboptimal stenting and residual intrastent plaque/thrombus protrusion in patients with acute coronary syndrome: The CLI-OPCI ACS Substudy (Centro per la Lotta Contro L’Infarto-Optimization of Percutaneous Coronary Intervention in Acute Coronary Syndrome). Circ Cardiovasc Interv 2016; 9: e003726.
- 5.
Kubo T, Akasaka T, Shite J, Suzuki T, Uemura S, Yu B, et al. OCT compared with IVUS in a coronary lesion assessment: The OPUS-CLASS study. JACC Cardiovasc Imaging 2013; 6: 1095–1104.
- 6.
Thygesen K, Alpert JS, Jaffe AS, Chaitman BR, Bax JJ, Morrow DA, et al. Executive Group on behalf of the Joint European Society of Cardiology (ESC)/American College of Cardiology (ACC)/American Heart Association (AHA)/World Heart Federation (WHF) Task Force for the Universal Definition of Myocardial Infarction. Fourth universal definition of myocardial infarction (2018). J Am Coll Cardiol 2018; 72: 2231–2264.
- 7.
Smith ER. The angina grading system of the Canadian Cardiovascular Society. Can J Cardiol 2002; 18: 439–442.
- 8.
Kubo T, Shinke T, Okamura T, Hibi K, Nakazawa G, Morino Y, et al. Optical frequency domain imaging vs. intravascular ultrasound in percutaneous coronary intervention (OPINION trial): Study protocol for a randomized controlled trial. J Cardiol 2016; 68: 455–460.
- 9.
Kubo T, Shinke T, Okamura T, Hibi K, Nakazawa G, Morino Y, et al; OPINION Investigators. Optical frequency domain imaging vs. intravascular ultrasound in percutaneous coronary intervention (OPINION trial): One-year angiographic and clinical results. Eur Heart J 2017; 38: 3139–3147.
- 10.
Otake H, Kubo T, Takahashi H, Shinke T, Okamura T, Hibi K, et al; OPINION Investigators. Optical frequency domain imaging versus intravascular ultrasound in percutaneous coronary intervention (OPINION trial): Results from the OPINION imaging study. JACC Cardiovasc Imaging 2018; 11: 111–123.
- 11.
Kubo T, Shinke T, Okamura T, Hibi K, Nakazawa G, Morino Y, et al. Comparison between Optical COherence tomography guidance and Angiography guidance in percutaneous coronary intervention (COCOA): Study protocol for a randomized controlled trial. J Cardiol 2018; 72: 170–175.
- 12.
Otake H, Kubo T, Shinke T, Hibi K, Tanaka S, Ishida M, et al. OPtical frequency domain imaging vs. INtravascular ultrasound in percutaneous coronary InterventiON in patients with Acute Coronary Syndrome: Study protocol for a randomized controlled trial. J Cardiol 2020; 76: 317–321.
- 13.
TIMI Study Group. The Thrombolysis in Myocardial Infarction (TIMI) trial: Phase I findings. N Engl J Med 1985; 312: 932–936.
- 14.
Ali ZA, Maehara A, Généreux P, Shlofmitz RA, Fabbiocchi F, Nazif TM, et al; ILUMIEN III: OPTIMIZE PCI Investigators. Optical coherence tomography compared with intravascular ultrasound and with angiography to guide coronary stent implantation (ILUMIEN III: OPTIMIZE PCI): A randomised controlled trial. Lancet 2016; 388: 2618–2628.
- 15.
Meneveau N, Souteyrand G, Motreff P, Caussin C, Amabile N, Ohlmann P, et al. Optical coherence tomography to optimize results of percutaneous coronary intervention in patients with non-ST-elevation acute coronary syndrome: Results of the multicenter, randomized DOCTORS Study (Does Optical Coherence Tomography Optimize Results of Stenting). Circulation 2016; 134: 906–917.
- 16.
Wijns W, Shite J, Jones MR, Lee SW, Price MJ, Fabbiocchi F, et al. Optical coherence tomography imaging during percutaneous coronary intervention impacts physician decision-making: ILUMIEN I study. Eur Heart J 2015; 36: 3346–3355.
- 17.
Ino Y, Kubo T, Matsuo Y, Yamaguchi T, Shiono Y, Shimamura K, et al. Optical coherence tomography predictors for edge restenosis after everolimus-eluting stent implantation. Circ Cardiovasc Interv 2016; 9: e004231.
- 18.
Khalifa AKM, Kubo T, Ino Y, Terada K, Emori H, Higashioka D, et al. Optical coherence tomography comparison of percutaneous coronary intervention among plaque rupture, erosion, and calcified nodule in acute myocardial infarction. Circ J 2020; 84: 911–916.
- 19.
Tanaka A, Imanishi T, Kitabata H, Kubo T, Takarada S, Tanimoto T, et al. Lipid-rich plaque and myocardial perfusion after successful stenting in patients with non-ST-segment elevation acute coronary syndrome: An optical coherence tomography study. Eur Heart J 2009; 30: 1348–1355.
- 20.
Prati F, Di Vito L, Biondi-Zoccai G, Occhipinti M, La Manna A, Tamburino C, et al. Angiography alone versus angiography plus optical coherence tomography to guide decision-making during percutaneous coronary intervention: The Centro per la Lotta contro l’Infarto-Optimisation of Percutaneous Coronary Intervention (CLI-OPCI) study. EuroIntervention 2012; 8: 823–829.
- 21.
Buccheri S, Franchina G, Romano S, Puglisi S, Venuti G, D’Arrigo P, et al. Clinical outcomes following intravascular imaging-guided versus coronary angiography-guided percutaneous coronary intervention with stent implantation: A systematic review and Bayesian network meta-analysis of 31 studies and 17,882 patients. JACC Cardiovasc Interv 2017; 10: 2488–2498.
- 22.
Jones DA, Rathod KS, Koganti S, Hamshere S, Astroulakis Z, Lim P, et al. Angiography alone versus angiography plus optical coherence tomography to guide percutaneous coronary intervention: Outcomes from the Pan-London PCI cohort. JACC Cardiovasc Interv 2018; 11: 1313–1321.