Abstract
Background:
Optical coherence tomographic (OCT) imaging has enabled identification of lipid, with increasing interest in how it may affect coronary interventions and clinical outcomes. This review summarizes the available evidence around OCT identification of lipid and its effect on interventions, clinical events, and the natural history of coronary disease.
Methods and Results:
We conducted a scoping review using the Medline, HealthStar, and Embase databases for articles published between 1996 and 2021. We screened 1,194 articles and identified 51 for inclusion in this study, summarizing the key findings. The literature supports a common OCT definition of lipid as low-signal regions with diffuse borders, validated against histology and other imaging modalities with acceptable intra- and inter-rater reliability. There is evidence that OCT-identified lipid at the site of stent implantation increases the risk of edge dissection, incomplete stent apposition, in-stent tissue protrusion, decreased coronary flow after stenting, side branch occlusion, and post-procedural cardiac biomarker increases. In mostly retrospective studies, lipid indices measured at non-stented sites are associated with plaque progression and the development of recurrent ischemic events.
Conclusions:
There is extensive literature supporting the ability of OCT to identify lipid and demonstrating a substantial impact of lipid on percutaneous coronary intervention outcomes. Future work to prospectively evaluate the effect of the characteristics of lipid-rich plaques on long-term clinical outcomes is needed.
Plaque morphology is recognized as an important factor in the outcome of percutaneous coronary intervention (PCI)1,2
and the natural history of coronary disease.3–5
Although the role of calcified plaque in PCI has received much attention, there has been a relatively limited focus on lipidic plaque. Optical coherence tomographic (OCT) imaging has enabled identification of lipid, and a growing literature base has explored how it may affect the procedural outcomes of PCI, as well as longer-term clinical outcomes.6
To assist the practicing interventionalist in applying this evidence base, we conducted a literature review to summarize the available evidence regarding OCT identification of lipid and its consequences. Our objectives were to review: (1) the reliability and validity of lipid identification by OCT compared with histopathology and other detection modalities; (2) the impact of lipid on in-laboratory and post-laboratory PCI outcomes; and (3) the effect of lipid on recurrent ischemic events in natural history studies of coronary disease.
Methods
To explore the breadth and depth of the literature around the OCT identification of lipid and its consequences, we selected a scoping review methodology.7
This allowed us to summarize the diversity of the literature available and to identify key evidence and gaps without being limited to samples and datasets that can be easily aggregated using more conventional systematic review approaches.8
Search Strategy
With the aid of a librarian, we conducted an OVID search of the Medline, HealthStar, and Embase databases for article published between 1996 and February 2021 using the following keywords: tomography, optical OR tomography, optical coherence/ AND (lipid OR thin cap fibroatheroma OR TCFA). We excluded ophthalmologic studies, non-human studies, studies not published in English and duplicates.
Screening
Articles were screened in duplicate using titles and abstracts by 4 reviewers (M.S., M.A., J.C., G.D.) using an online systematic review platform (https://rayyan.qcri.org/). All reviewers trained on a common set of 50 articles to ensure consistency in inclusion and exclusion criteria. We included empirical data (including case series, cross-sectional, cohort, controlled trials, randomized data, systematic reviews, expert consensus statements, and meta-analyses) pertaining to OCT-identified lipid for the purposes of defining or validating lipid pools, correlating lipid pools with intraprocedural, periprocedural, and long-term clinical outcomes. We excluded intravascular imaging studies without OCT comparison, studies with data only relating to differences in lipid pools based on demographics or clinical variables, studies related to the impact of pharmacologic intervention on lipid pools, studies related to neoatherosclerosis, case reports, review articles, expert consensus, commentaries, animal studies, basic science studies including ex vivo models and computational modeling, and studies related to bioabsorbable scaffolds. In all, 274 articles were screened in triplicate because at least 1 reviewer was undecided; 17 conflicts were resolved through discussion.
Eligibility and Data Extraction
The full text of articles meeting the screening criteria were assessed by 2 reviewers (two of M.S., M.A., J.C., G.D.) for inclusion, with disagreements resolved through consensus. Data were extracted from the full text into 3 predefined tables for reliability and validity evidence and intra- and post-procedural outcomes by a single reviewer (one of M.A., J.C., G.D.) and verified by a second (M.S.).
IRB Information
Ethics approval was not applicable for this study because the data collected were from previously published studies.
Results
The results of the literature search are presented in
Figure 1. In all, 1,194 articles were identified, 920 of which were screened in duplicate and 274 were screened in triplicate because at least 1 reviewer was undecided. Seventeen conflicts were resolved through discussion. Of the 135 articles that underwent full text review, 51 met the criteria for inclusion in the present study.
Reliability and Validity of Lipid and TCFA Detection by OCT
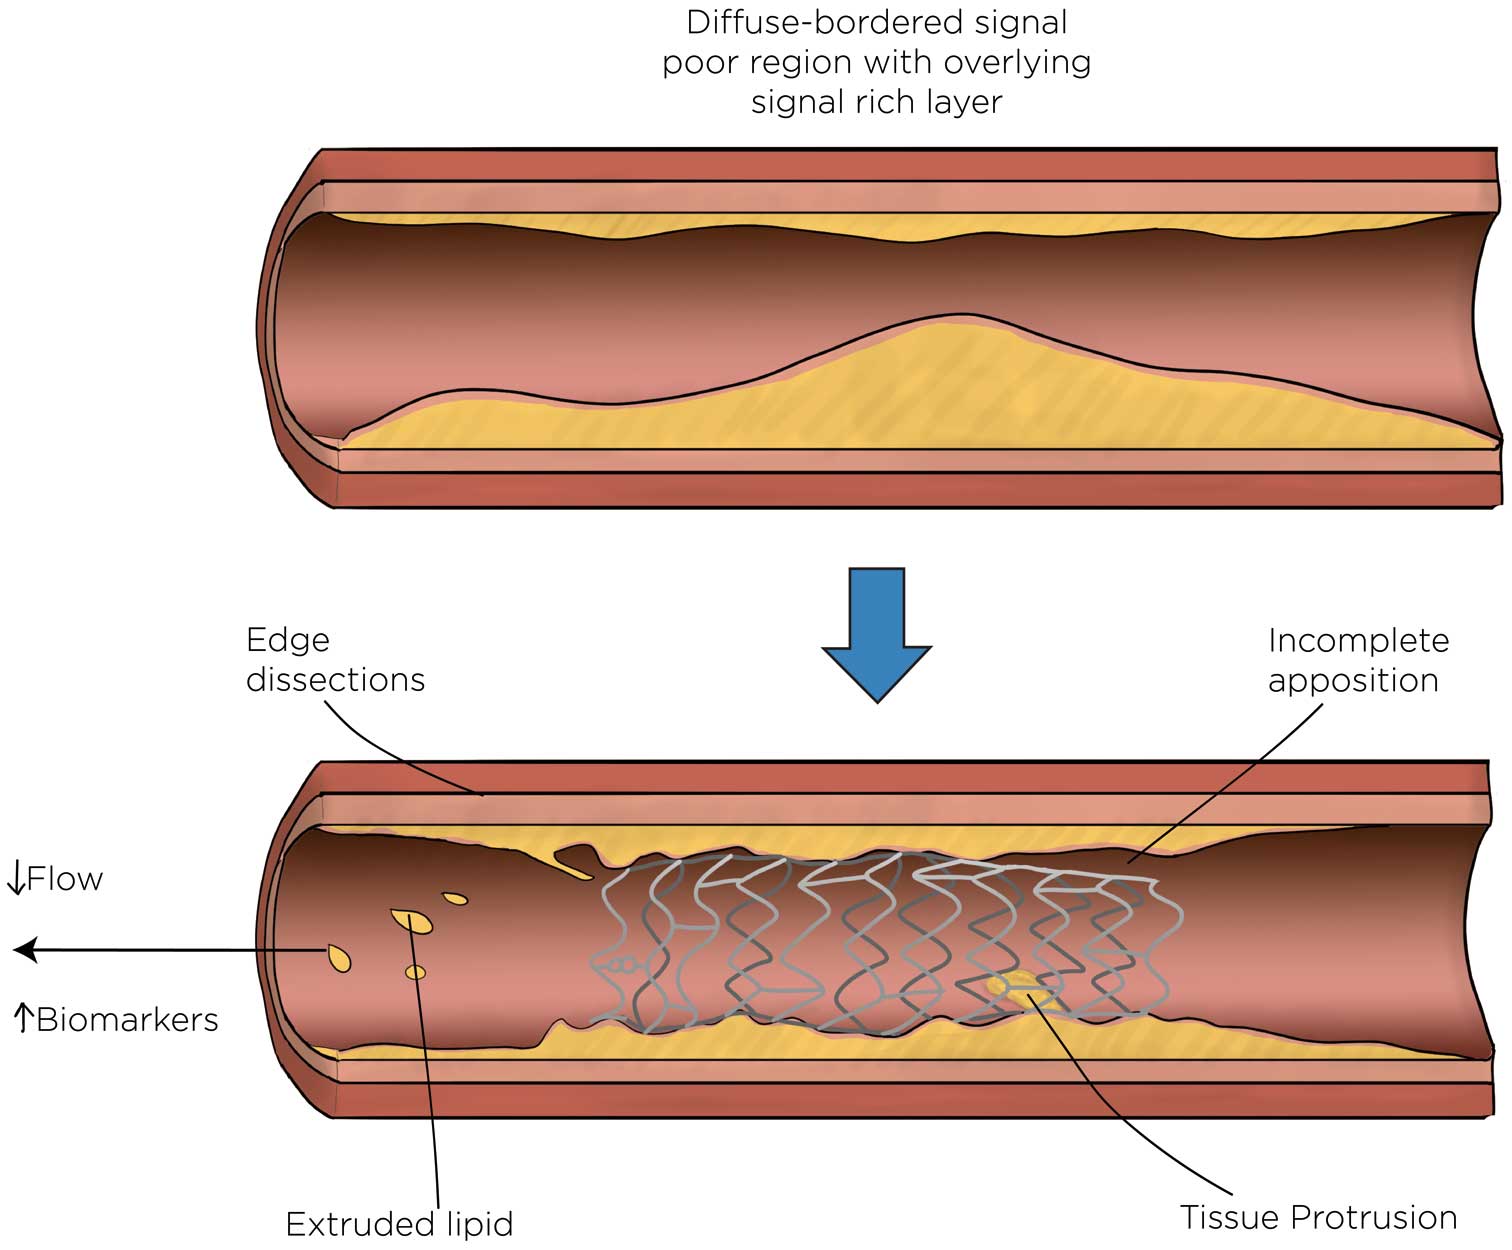
Lipid was consistently defined in OCT imaging as plaque with low signal intensity regions with diffuse borders.6,9–13
Reports suggest good intraobserver (κ=0.75–0.97) and interobserver (κ=0.76–0.93) agreement,12,14–18
with improvement documented in 1 paper after training on artifacts and lipid mimics14
(see
Table 1). Interobserver agreement on maximal lipid arc was similarly good (intraclass correlation coefficient [ICC] 0.82–0.90).14,16,19
OCT detection of lipid was sensitive 89–94%, but less specific 70–92%, based on comparisons with near-infrared spectroscopy (NIRS; sensitivity 86–90%, specificity 70–90%),15,20
histologic examination of direct atherectomy (sensitivity 89%, specificity 75%),12
and pathology specimens (sensitivity 90–94%, specificity 90–92%;21
Table 2). Reasons for false positives based on histologic comparisons include macrophages, foam cells, red thrombus, and collagen-poor extracellular matrix.12,21
Detecting lipid in patients presenting with acute coronary syndromes, especially in ST-elevation myocardial infarction, may be limited by red thrombus, which both obscures lipid and may share similar optical characteristics with lipid.4
Table 1.
Inter- and Intrarater Reliability of Lipid-Rich Plaque and Thin Cap Fibroatheroma
| Study |
Year |
No.
raters |
Lipid-rich plaque |
Thin cap fibroatheroma |
| Definition |
Intrarater
reliability
(κ) |
Inter-rater
reliability
(κ) |
Definition |
Intrarater
reliability
(κ) |
Inter-rater
reliability
(κ) |
| Brown et al16 |
2015 |
Not
reported |
Signal-poor region
with a minimum
lipid arc of ≥90° |
0.85 |
0.66 |
Lipid-rich plaque
with a fibrous cap
thickness <85 μm |
0.64 |
0.66 |
| Di Vito et al15 |
2017 |
2 |
Signal-poor region
diffusely bordered
by overlying
signal-rich bands |
0.97 |
0.93 |
|
|
|
| Fujii et al25 |
2015 |
Not
reported |
|
|
|
Lipid content >1
quadrant with
fibrous cap
measuring <65 μm |
0.92 |
0.81 |
| Habara et al12 |
2017 |
2 |
Signal-poor
regions without
sharp borders |
0.83 |
0.76 |
|
|
|
| Kini et al14 |
2015 |
3 |
Signal-poor region
with poorly
delineated borders,
little or no signal
backscattering, and
an overlying
signal-rich layer
spanning >90° in
any cross-section |
|
0.66
(improving
with training to
0.75–0.87) |
Lipid-rich plaque
with minimal
fibrous cap
thickness <65 mm |
|
0.43 (improving
with training to
0.83–0.88) |
| Lee et al17 |
2011 |
2 |
More than 2
quadrants of
signal-poor plaque |
0.90 |
0.83 |
Lipid-rich plaque
with a fibrous cap
thickness <70 μm |
0.83 |
0.77 |
| Lee et al18 |
2011 |
2 |
More than 2
quadrants of
signal-poor plaque |
0.86 |
0.78 |
Lipid-rich plaque
with a fibrous cap
thickness <70 μm |
0.82 |
0.80 |
| Lee et al24 |
2015 |
2 |
Low-signal region
with a diffuse
border >90° |
|
|
Lipid-rich plaque
with a fibrous cap
thickness <80 μm |
0.86 |
0.90 |
| Paoletti et al22 |
2016 |
Not
reported |
Signal-poor region
diffusely bordered
by overlying
signal-rich bands |
|
|
Lipid plaque with
a cap thickness
<80 μm |
R=0.93 |
R=0.92 |
| Phipps et al26 |
2016 |
Not
reported |
|
|
|
Fibrous cap
<65 μm overlying
a lipid core |
|
0.83 |
| Radu et al23 |
2016 |
2 |
|
|
|
Fibroatheroma
with minimum
fibrous cap
thickness<65 μm |
0.50 (improving
to 1.0 with
semiautomatic
assessment) |
0.23 (improving
to 1.0 with
semiautomatic
assessment) |
| Roleder et al19 |
2014 |
Not
reported |
|
|
|
Lipid-rich plaque
with fibrous cap
thickness <65 μm |
|
0.84 |
| Yabushita et al21 |
2002 |
Not
reported |
Diffusely bordered
signal-poor regions
with overlying
signal-rich bands |
0.88 |
0.91 |
|
|
|
Table 2.
Comparison of OCT-Detected Lipid and Thin Cap Fibroatheroma With Other Modalities
| Study |
Year |
No.
patients |
Comparative
standard |
OCT criteria |
Sensitivity
(%) |
Specificity
(%) |
PPV
(%) |
NPV
(%) |
| Presence of lipid |
| Di Vito et al15 |
2017 |
43 |
NIRS |
Signal-poor region
diffusely bordered by
overlying signal-rich
bands |
86 |
70 |
59 |
90 |
| Yonetsu et al20* |
2014 |
17 |
NIRS |
Diffusely bordered
signal-poor region with
signal attenuation by
the overlying signal-rich
layer |
90 |
60 |
90 |
60 |
| Habara et al12 |
2018 |
25 |
Directional
atherectomy |
Signal-poor regions
without sharp borders |
89 |
75 |
67 |
92 |
| Yabushita et al21 |
2002 |
90 |
Autopsy |
Diffusely bordered
signal-poor regions
with overlying signal-
rich bands |
90–94 |
90–92 |
74–75 |
97–98 |
| Thin cap fibroatheroma |
| Fujii et al25 |
2015 |
60 |
Autopsy |
Lipid content >1
quadrant with fibrous
cap measuring < 65 μm |
100 |
97 |
41 |
100 |
| Miyamoto et al28* |
2011 |
81 |
Integrated
backscatter
IVUS >55%
lipid pool |
Thin fibrous cap
<65 μm overlying a
lipid-rich plaque >90° |
95 |
88 |
88 |
94 |
| Phipps et al26 |
2016 |
10 |
Autopsy |
Fibrous cap <65 μm
overlying a lipid core |
87 |
92 |
37 |
99 |
*Data calculated based on numbers provided. IVUS, intravascular ultrasound; NIRS, near-infrared spectroscopy; NPV, negative predictive value; OCT, optical coherence tomography; PPV, positive predictive value.
TCFA was most frequently defined as a lipid-rich plaque with a minimum fibrous cap thickness of <65 µm.6,14
Interobserver agreement of cap thickness (ICC 0.52–0.91) and TCFA (κ=66–0.93)14,16–19,22–24
was fair to good, improving with training to identify macrophages and calcification,14
and with semi-automated detection of fibrous cap.23
Although OCT detection of TCFA was sensitive (87–100%) and specific (92–97%) in histopathology studies, positive predictive values are lower (41–47%), with microcalcifications, macrophages, foam cells, hemosiderin, fibrin, and loose connective tissue contributing to false positives.12,25,26
Macrophages, foam cells, and microcalcifications are hypothesized to result in extensive scattering of light, resulting in signal attenuation that mimics lipid.25,26
Measurements of OCT lipid (greater angle and thinner cap) were associated with higher maximum lipid core burden index by NIRS.19,27
Detection of lipid by OCT was more sensitive than with intravascular ultrasound (IVUS), even when IVUS was performed with enhanced integrated backscatter.28
Lipid and TCFA are more common in plaques with higher grades of stenosis.4,29
Lipid arc and cap are correlated with atheroma volume.10
Lipid is more commonly found in the main branch side of bifurcations, with TCFA more frequently opposite the flow divider.11,30
TCFA is more common in the proximal and mid-left anterior descending artery and proximal circumflex artery,30
particularly around the obtuse marginal bifurcation,31
with broader distribution in the right coronary artery clustered around the mid-vessel and distal bifurcation.30,31
Effect of Lipid on In-Laboratory Outcomes
Stenting lipid is associated with in-stent plaque prolapse,32,33
intra-stent thrombus,32,34,35
and incomplete stent apposition36
(Table 3). Fibrous cap thickness is inversely correlated with in-stent plaque prolapse.37
Landing a stent in lipid was associated with edge dissections,38
both proximal39
and distal,40
and edge restenosis.41
Lipid opposite a side branch ostium was associated with angiographic stenosis of the side branch origin after provisional stenting.42
Table 3.
Association Between OCT-Detected Lipid and Procedural Outcomes
| Study |
Year |
Population |
No. patients |
Association |
| Edge dissections |
| Antonsen et al38 |
2016 |
NSTEMI |
97 |
Edge dissection associated with
thick-fibroatheroma (P<0.001) |
| Gonzalo et al40 |
2010 |
Stable angina and ACS |
73 |
Distal edge dissection associated with
plaque type (fibrocalcific 43.8%, lipid
rich 37.5%, fibrous 10%; P=0.009) |
| Zeglin-Sawczuk et al39 |
2013 |
Stable angina and ACS |
203 |
>90° lipid arc associated with proximal
edge dissection (OR 23.6, P<0.01) |
| Tissue protrusion |
| Bryniarski et al34 |
2017 |
ACS and stable angina |
786 |
Maximal lipid arc (187° vs. 162°;
P=0.004), mean lipid arc (138° vs. 119°;
P=0.001) and lipid index (P=0.003) |
| Sugiyama et al56 |
2017 |
Stable angina and ACS |
145 |
>180° lipid arc (P<0.001) |
| Feng et al33 |
2011 |
Unstable Angina |
68 |
Lipid associated with tissue prolapse
(P<0.001) and in-stent microthrombosis
(P<0.001) |
| Incomplete apposition |
| Bernelli et al32 |
2016 |
ACS |
140 |
>90° lipid arc (OR 1.3, P=0.04) |
| Reduced post-stenting flow |
| Gamou et al43 |
2014 |
Stable angina and ACS |
141 |
TCFA <65 μm (HR 12.32, P=0.0005) |
| Ikenaga et al53 |
2012 |
STEMI |
39 |
Length of lipid pool >9 mm (P=0.002) |
| Ozaki et al54 |
2011 |
ACS |
211 |
TCFA <70 μm (P=0.012) |
| Soeda et al44 |
2017 |
STEMI |
145 |
Maximum lipid arc (344° vs. 320°;
P=0.032) and lipid index (P<0.001) |
| SB occlusion >50% |
| Kini et al42 |
2017 |
Stable angina |
30 |
Maximal lipid arc (146° vs. 75°; OR
1.014 per degree, P=0.038), presence
of lipid plaque contralateral to SB ostium
(OR 8.14, P=0.046) |
| Periprocedural biomarker elevation |
| Imola et al46 |
2013 |
Stable angina |
30 |
Lipid pool quadrants (P=0.09) and lipid
pool arc (P=0.006) with all lipid arc >154° |
| Kini et al51 |
2015 |
Stable angina |
110 |
Greater cap thickness (OR 0.90, P<0.001) |
| Lee et al18 |
2011 |
Stable and unstable angina |
135 |
≥2 quadrants of lipid (OR 3.49, P=0.003)
and plaque cavity (OR 2.92, P<0.017) |
| Lee et al24 |
2015 |
Stable angina |
206 |
Lipid arc (178° vs. 160° degrees; OR
1.01 per degree, P=0.018), lipid length
(8 vs. 5 mm; OR 1.08 per mm, P=0.008),
and TCFA <80 μm (OR 4.5, P<0.001) |
| Lee et al52 |
2017 |
NSTEMI |
167 |
TCFA <70 μm (OR 2.88, P=0.011)
and lipid length (10 vs. 7 mm; OR 1.12,
P=0.02) |
| Porto et al37 |
2012 |
NSTEMI and stable angina |
50 |
TCFA < 65 μm (OR 29.7, P=0.008) |
| Ueda et al50 |
2014 |
Stable angina |
68 |
Colocalization of lipid and spotty
calcification (OR 8.4, P<0.01) |
| Uzu et al35 |
2017 |
Stable angina |
94 |
Lipid index (P<0.001) |
| Yamamoto et al47 |
2013 |
Stable angina |
79 |
Optimal cut-off values: lipid arc >115°,
fibrous cap thickness <110 μm, and lipid
length >7.7 mm |
ACS, acute coronary syndrome; HR, hazard ratio; NSTEMI, non-ST segment elevation myocardial infarction; OR, odds ratio; SB, side branch; STEMI, ST-elevation myocardial infarction; TCFA, thin cap fibroatheroma. Other abbreviations as in Table 2.
In patients undergoing elective stenting, the presence of lipid plaque was associated with a reduction in Thrombolysis in Myocardial Infarction (TIMI) flow.32,43
In patients undergoing primary PCI, the extent of lipid was associated with no-reflow44
and no-reflow with filter device use.45
One study identified an association between lipid and incomplete stent apposition in a primary PCI cohort, where malapposition was also associated with the presence of thrombus and larger proximal vessel diameters.36
The impact of lipid on stenting is summarized in
Figure 2.
Effect of Lipid on Post-Laboratory Outcomes
Lipid was associated with post-procedural increases in cardiac biomarkers in elective stenting,17,18,24,46–52
which was related to landing the stent in lipid proximally,46
the lipid arc,23,24
lipid length,18,24,47
and the presence of TCFA.18,24,37,47,49
In patients undergoing primary PCI, the extent of lipid was related to the lack of prompt resolution of stent thrombosis53
and higher increases in enzymes.53
In patients with acute coronary syndromes, fibrous cap thickness was inversely correlated with microvascular obstruction identified by magnetic resonance imaging.54
The impact of lipid on stent healing is less clear, with reports of greater neointimal hyperplasia of struts overlying lipid at OCT imaging follow-up at 3 and 9 months,55,56
and greater persistence of malapposition of stented lipid plaques at 8 months.57
The presence of fibrous cap disruption and a necrotic core with macrophages in an acute culprit before stenting were independent predictors of the composite of cardiovascular death, non-fatal myocardial infarction and clinically driven revascularization at 1 year in a retrospective cohort of 209 patients.58
Effect of Lipid on Clinical Outcomes
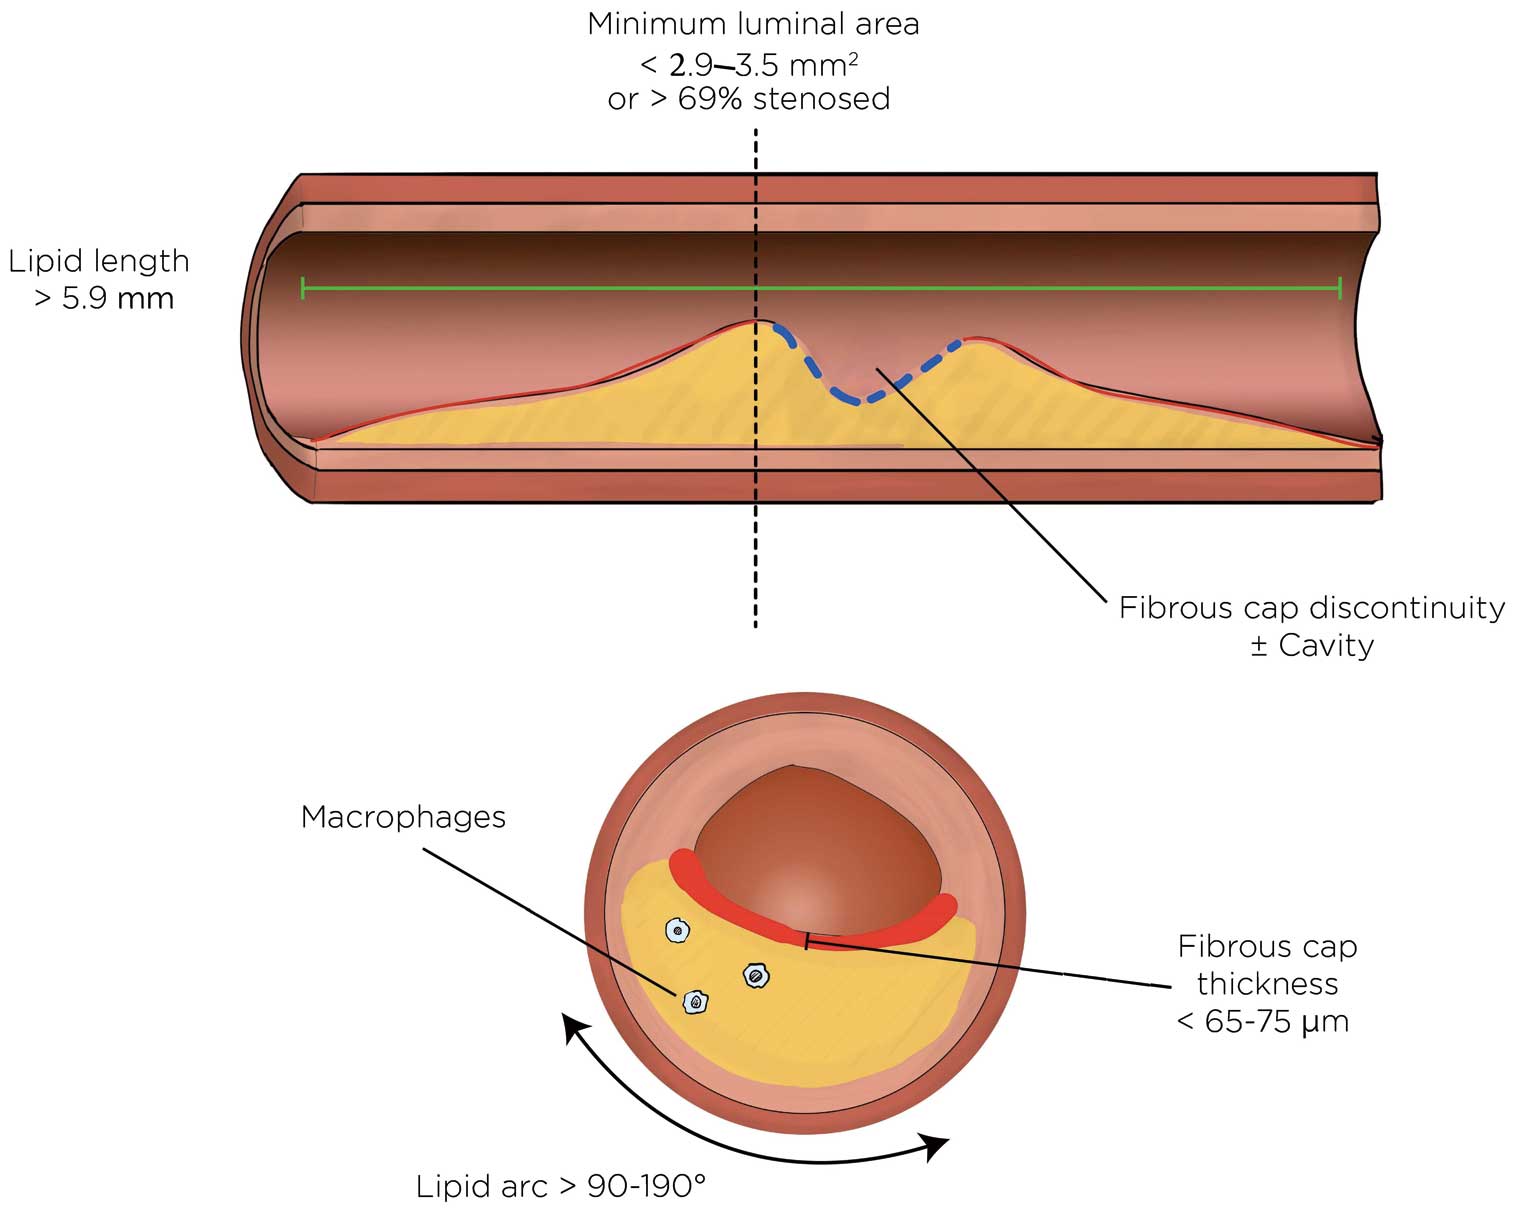
In a natural history study of 1,000 patients, half of whom had an left anterior descending (LAD) culprit, lipid arc >180° and TCFA were both associated with the composite of cardiac death and target vessel LAD segment myocardial infarction at 1 year.5
In non-culprit disease, unstented lipid and TCFA were associated with rapid plaque progression based on imaging at 6-month intervals59
(Table 4). In a cohort of 1,378 patients followed prospectively for 6 years, lipid arc >180° and fibrous cap thickness <65 µm were each independently associated with the development of acute coronary syndrome at the plaque level.60
The hazard ratio was increased when both these variables were present but fewer lesions possessed both characteristics. In receiver operating characteristic curve analysis, fibrous cap thickness <150 µm had the greatest sensitivity (88%) and negative predictive value (99%) to rule out incident acute coronary syndrome; the presence of lipid plaque with a lipid arc >180° in combination with TCFA <65 µm had the greatest specificity (97%) and positive predictive value (33%).60
Lipid length >5.9 mm, lipid arc >193°, and area stenosis >69% were predictive of the composite of cardiac death, myocardial infarction, and ischemia-drive revascularization among 1,474 patients followed for a median of 2 years.61
Table 4.
Coronary Disease Natural History Studies Involving Lipid-Related Univariate Predictors of Patient- and Plaque-Level Outcomes
| Study |
Year |
No.
patients |
Study
design |
Mean follow-up
(months) |
Outcomes |
Stenosis
severity |
Lipid extent |
Macrophages |
Fibrous cap
thickness |
Plaque rupture |
| Iannaccone et al58 |
2018 |
209 |
Retrospective,
multicenter |
12.6 |
Patient level: composite of death from
cardiac causes, non-fatal MI, and clinically
driven target vessel revascularization |
|
Presence of necrotic core (signal-poor region with poorly
delineated borders) with macrophages (HR 3.3, 95% CI
1.6–6.6, P<0.01) |
Fibrous cap thickness <65 μm
(HR 2.3, 95% CI 1.6–5.4,
P=0.04) |
Fibrous cap discontinuity
(HR 3.7, 95% CI 1.4–9.8,
P<0.01) |
| Xing et al61 |
2017 |
1,474 |
Retrospective
multicenter |
48 |
Patient level: composite of cardiac death,
acute MI, and ischemia-driven
revascularization in non-culprit segment |
Area stenosis
>69% (HR 6.1,
P<0.001; AUC 0.66,
P=0.005) |
Lipid arc >193° (HR 2.49, P=0.024;
AUC 0.64, P=0.012)
Lipid length >5.9 mm (HR 5.69,
P=0.001; AUC 0.66, P=0.005) |
|
|
|
| Araki et al59 |
2020 |
248 |
Retrospective,
single center |
7.1 |
Angiographic: rapid progression
(decrease in mean luminal diameter
≥0.4 mm) |
|
Lipid arc >90° (OR 3.1, P<0.001) |
Present (OR 2.22,
P=0.036) |
Fibrous cap thickness <65 μm
and lipid arc >90° (OR 4.08,
P<0.001) |
Fibrous cap discontinuity
with cavity formation
(OR 2.76, P=0.029) |
| Prati et al5 |
2020 |
1,003 |
Prospective,
multicenter |
12 |
Patient level:
composite of cardiac death
and target MI in imaged LAD territory |
MLA <3.5 mm2
(HR 2.07, P=0.032) |
Lipid arc >180° (HR 2.40, P=0.017) |
Present (HR 2.66,
P=0.027) |
Fibrous cap thickness <75 μm
(HR 4.65, P<0.001) |
|
| Kubo et al60 |
2021 |
1,378 |
Retrospective
single center |
72 |
Plaque level: ACS in non-culprit imaged
segment |
MLA <2.9 mm2
(HR 4.56, P<0.001) |
Lipid arc >180° (HR 12.6, P<0.001) |
Present (HR 4.83,
P<0.001) |
Fibrous cap thickness <65 μm
(HR 10.4, P<0.001) |
|
AUC, area under the curve; MI, myocardial infarction; MLA, minimum lumen area. Other abbreviations as in Table 3.
This literature has some limitations. Multivessel imaging was not performed in any of the studies identified. A prospective study design was only used in 1 study (CLIMA: Coronary plaque morphology of the left anterior descending artery and twelve months clinical outcome5), whereas the remaining studies were retrospective evaluations of OCT images acquired during image-guided PCI and were confined to the non-stented segment of the PCI target vessel. Only 1 study had exclusively plaque-level endpoints in the study analysis.57
The imaging parameters associated with events in the current literature are summarized in
Figure 3.
Discussion
This review identified several key findings: (1) OCT identification of lipid had acceptable reliability, with the potential for improvements with training and automated detection; (2) stenting lipid was associated with plaque prolapse, incomplete apposition, and a reduction in post-intervention coronary flow; (3) stenting lipid was associated with post-procedural increases in cardiac biomarkers and other markers of microvascular obstruction; and (4) unstented lipid has an unfavorable natural history.
The OCT recognition of lipid as a low signal intensity area with diffuse borders is supported by correlative studies using histology and other imaging modalities. However, there is a false positive rate because a minority of plaques with these characteristics are not lipid based on histologic assessment. Operators are encouraged to examine adjacent cross-sections to improve their specificity in identifying lipid. Further, lipid plaque frequently contains micro- and macrocalcifications, and vice versa, making the identification of lipid deep to calcified plaque difficult. Automated approaches hold promise to improve the detection of lipid and to reduce the operator training required to achieve reliable lipid detection. Focal bands of attenuation not found in adjacent cross-sections are characteristic of macrophage infiltration, intraluminal extension with irregular borders is more consistent with red thrombus, and sharply delineated borders in contiguous cross-sections favor calcium. Using a threshold of <65 µm, TCFA is accurately diagnosed by OCT in correlative studies. Thresholds for evaluating intra- and interobserver identification of TCFA vary from 65 to 85 µm with similar results. Semiautomated, machine-based approaches show early promise for improving the consistency of image interpretation of TCFA, and further evaluation of automated detection of lipid plaque is warranted.
Of all plaque types, lipid appears to be the most easily deformed and disrupted. A paucity of supportive fibrous and connective tissues likely contributes to lipid exuding through metallic struts, resulting in intra-stent plaque prolapse and, in some cases, overt mechanical displacement of lipid downstream of the stented segment. Downstream displacement of micro- and macro-lipid plaque components could lead to microvascular obstruction, no-reflow phenomenon, post-procedural increases in enzymes, and leave tissue voids contributing to malapposition. Image guidance during intervention has the advantage of anticipating these potential complications when stenting lipidic lesions. Observation of extensive lipid warrants a focus on appropriate evidence-based systemic lipid therapy.62
Despite a diversity of a priori thresholds defining lipid plaque, lipid arc, and TCFA, the associations with stent-elated complications are consistent, with a narrow range of thresholds found. Potential management implications of identifying lipid have not been defined in clinical trials, and there are no established interventional approaches specific to OCT-identified lipid. However, given the observational literature, avoiding ending stents in lipid plaques seems justified. Moderating the approach to post-dilation that takes into account the extent of lipid plaque burden would be reasonable. In contrast with the existing literature, which problematizes stent underexpansion with calcified plaque as the principal determinant of restenosis,63,64
the absence of literature around underexpansion related to lipid is notable.
The presence of lipid-rich plaque is associated with recurrent ischemic events in non-stented segments. However, there were no OCT studies of plaque natural history conducted with a prospective multivessel imaging protocol. In contrast, IVUS plaque characteristics were assessed in 3 large prospective, multivessel imaging studies with adjudication of events at the patient and plaque level.3,65,66
Patients who have a significant lipid burden frequently have other risk factors for recurrent events, making it important to have enough outcome events in observational studies to allow clinical variables to be adjusted for. When imaging findings are evaluated for predictive value at the patient level, they serve as an overall measure of risk rather than providing insight into plaque-level events. Therefore, the development of a treatment target for lipid-rich plaque will require robust plaque-level data. Adequately powered natural history studies are needed to provide further evidence for the effects of lipid plaque on future events at both the patient and plaque levels. Ideally, these studies would be conducted with reproducible quantification of lipid by automated and computerized approaches, laying the groundwork for a definition of clinically relevant lipid based on predictive ability for future events.
Study Limitations
Several limitations of this study are worth highlighting. The scoping review methodology provides an overview of the available evidence, without formally assessing study quality or aggregating outcomes across studies. Studies that compare OCT with other imaging modalities or histopathologic specimens rely on manual coregistration, which can introduce the possibility of bias, especially because lipid is frequently found colocated and may be mistaken for calcium, and vice versa. Given the observational nature of the data, the results are linked to the specific populations studied and include heterogeneity in the a priori imaging thresholds applied to assess for associations.
Conclusions
Lipid and TCFA are readily identifiable on OCT with acceptable reliability. Stenting lipid is associated with plaque prolapse, incomplete apposition, a reduction in post-stenting coronary flow, and post-procedural increases in cardiac biomarkers. Characteristics of unstented lipid are linked to rapid plaque progression and recurrent ischemic events and should be investigated further.
Impact on Daily Practice
Lipid is identified as a low signal intensity area with diffuse borders on OCT. Stenting lipid is associated with edge dissections, reduced vessel flow and periprocedural increases in enzymes. It is reasonable to avoid ending stents in lipid and to moderate the approach to post-dilation.
Data Availability
Not applicable.
Sources of Funding
This study did not receive any specific funding.
Disclosures
M.S., N.P.-E., T.S. have received speakers’ honoraria from Abbott. The remaining authors have no conflicts of interest to declare.
References
- 1.
Higuma T, Soeda T, Abe N, Yamada M, Yokoyama H, Shibutani S, et al. A combined optical coherence tomography and intravascular ultrasound study on plaque rupture, plaque erosion, and calcified nodule in patients with ST-segment elevation myocardial infarction: Incidence, morphologic characteristics, and outcomes after percutaneous coronary intervention. JACC Cardiovasc Interv 2015; 8: 1166–1176.
- 2.
Jia R, Nie X, Li H, Zhu H, Pu L, Li X, et al. Impact of attenuated plaques on TIMI grade flow and clinical outcomes of coronary artery disease patients: A systematic review and meta analysis. J Thorac Dis 2016; 8: 527–536.
- 3.
Stone GW, Maehara A, Lansky AJ, de Bruyne B, Cristea E, Mintz GS, et al. A prospective natural-history study of coronary atherosclerosis. N Engl J Med 2011; 364: 226–235.
- 4.
Pinilla-Echeverri N, Mehta S, Wang J, Lavi S, Schampaert E, Cantor WJ, et al. Nonculprit lesion plaque morphology in patients with ST-segment-elevation myocardial infarction: Results from the COMPLETE Trial Optical Coherence Tomography Substudy. Circ Cardiovasc Interv 2020; 13: e008768.
- 5.
Prati F, Romagnoli E, Gatto L, La Manna A, Burzotta F, Ozaki Y, et al. Relationship between coronary plaque morphology of the left anterior descending artery and 12 months clinical outcome: The CLIMA study. Eur Heart J 2020; 41: 383–391.
- 6.
Fujii K, Kubo T, Otake H, Nakazawa G, Sonoda S, Hibi K, et al. Expert consensus statement for quantitative measurement and morphological assessment of optical coherence tomography. Cardiovasc Interv Ther 2020; 35: 13–18.
- 7.
Peters MDJ, Godfrey CM, Khalil H, McInerney P, Parker D, Soares CB. Guidance for conducting systematic scoping reviews. JBI Evid Implement 2015; 13: 141–146.
- 8.
Munn Z, Peters MDJ, Stern C, Tufanaru C, McArthur A, Aromataris E. Systematic review or scoping review?: Guidance for authors when choosing between a systematic or scoping review approach. BMC Med Res Methodol 2018; 18: 143.
- 9.
Kubo T, Yamano T, Liu Y, Ino Y, Shiono Y, Orii M, et al. Feasibility of optical coronary tomography in quantitative measurement of coronary arteries with lipid-rich plaque. Circ J 2015; 79: 600–606.
- 10.
Xie Z, Tian J, Ma L, Du H, Dong N, Hou J, et al. Comparison of optical coherence tomography and intravascular ultrasound for evaluation of coronary lipid-rich atherosclerotic plaque progression and regression. Eur Heart J Cardiovasc Imaging 2015; 16: 1374–1380.
- 11.
Jia H, Hu S, Uemura S, Park SJ, Jang Y, Prasad A, et al. Insights into the spatial distribution of lipid-rich plaques in relation to coronary artery bifurcations: An in-vivo optical coherence tomography study. Coron Artery Dis 2015; 26: 133–141.
- 12.
Habara M, Otsuka F, Tsuchikane E, Terashima M, Nasu K, Kinoshita Y, et al. In vivo tissue characterization of human atherosclerotic plaques by optical coherence tomography: A directional coronary atherectomy study with histopathologic confirmation. Int J Cardiol 2018; 268: 1–10.
- 13.
Kubo T, Matsuo Y, Ino Y, Tanimoto T, Ishibashi K, Komukai K, et al. Optical coherence tomography analysis of attenuated plaques detected by intravascular ultrasound in patients with acute coronary syndromes. Cardiology Research and Practice 2011; 2011: e687515.
- 14.
Kini A, Vengrenyuk Y, Yoshimura T, Matsumura M, Pena J, Baber U, et al. Fibrous cap thickness by optical coherence tomography in vivo. J Am Coll Cardiol 2017; 69: 644–657.
- 15.
Di Vito L, Gatto L, Romagnoli E, Limbruno U, Marco V, Picchi A, et al. Limitations of OCT in identifying and quantifying lipid components: An in vivo comparison study with IVUS-NIRS. EuroIntervention 2017; 13: 303–311.
- 16.
Brown A, Jaworski C, Corrigan J, De Silva R, Bennett M, Mahmoudi M, et al. Optical coherence tomography imaging of coronary atherosclerosis is affected by intraobserver and interobserver variability. J Cardiovasc Med 2016; 17: 368–373.
- 17.
Lee T, Kakuta T, Yonetsu T, Takahashi K, Yamamoto G, Iesaka Y, et al. Assessment of echo-attenuated plaque by optical coherence tomography and its impact on post-procedural creatine kinase-myocardial band elevation in elective stent implantation. JACC Cardiovasc Interv 2011; 4: 483–491.
- 18.
Lee T, Yonetsu T, Koura K, Hishikari K, Murai T, Iwai T, et al. Impact of coronary plaque morphology assessed by optical coherence tomography on cardiac troponin elevation in patients with elective stent implantation. Circ Cardiovasc Interv 2011; 4: 378–386.
- 19.
Roleder T, Kovacic JC, Ali Z, Sharma R, Cristea E, Moreno P, et al. Combined NIRS and IVUS imaging detects vulnerable plaque using a single catheter system: A head-to-head comparison with OCT. EuroIntervention 2014; 10: 303–311.
- 20.
Yonetsu T, Suh W, Abtahian F, Kato K, Vergallo R, Kim SJ, et al. Comparison of near-infrared spectroscopy and optical coherence tomography for detection of lipid. Catheter Cardiovasc Interv 2014; 84: 710–717.
- 21.
Yabushita H, Bouma BE, Houser SL, Aretz HT, Jang IK, Schlendorf KH, et al. Characterization of human atherosclerosis by optical coherence tomography. Circulation 2002; 106: 1640–1645.
- 22.
Paoletti G, Marco V, Romagnoli E, Gatto L, Fedele S, Mangiameli A, et al. Reproducibility of serial optical coherence tomography measurements for lumen area and plaque components in humans (The CLI-VAR (Centro per la Lotta Contro l’Infarto-variability) II study). Int J Cardiovasc Imaging 2016; 32: 381–387.
- 23.
Radu M, Yamaji K, García-García H, Zaugg S, Taniwaki M, Koskinas K, et al. Variability in the measurement of minimum fibrous cap thickness and reproducibility of fibroatheroma classification by optical coherence tomography using manual versus semiautomatic assessment. EuroIntervention 2016; 12: e987–e997.
- 24.
Lee T, Murai T, Yonetsu T, Suzuki A, Hishikari K, Kanaji Y, et al. Relationship between subclinical cardiac troponin I elevation and culprit lesion characteristics assessed by optical coherence tomography in patients undergoing elective percutaneous coronary intervention. Circ Cardiovasc Interv 2015; 8: e001727.
- 25.
Fujii K, Hao H, Shibuya M, Imanaka T, Fukunaga M, Miki K, et al. Accuracy of OCT, grayscale IVUS, and their combination for the diagnosis of coronary TCFA: An ex vivo validation study. JACC Cardiovasc Imaging 2015; 8: 451–460.
- 26.
Phipps J, Hoyt T, Vela D, Wang T, Michalek J, Buja L, et al. Diagnosis of thin-capped fibroatheromas in intravascular optical coherence tomography images. Circ Cardiovasc Interv 2016; 9: e003163.
- 27.
Zanchin C, Ueki Y, Losdat S, Fahrni G, Daemen J, Ondracek AS, et al. In vivo relationship between near-infrared spectroscopy-detected lipid-rich plaques and morphological plaque characteristics by optical coherence tomography and intravascular ultrasound: A multimodality intravascular imaging study. Eur Heart J Cardiovasc Imaging, doi:10.1093/ehjci/jez318.
- 28.
Miyamoto Y, Okura H, Kume T, Kawamoto T, Neishi Y, Hayashida A, et al. Plaque characteristics of thin-cap fibroatheroma evaluated by OCT and IVUS. JACC Cardiovasc Imaging 2011; 4: 638–646.
- 29.
Tian J, Dauerman H, Toma C, Samady H, Itoh T, Kuramitsu S, et al. Prevalence and characteristics of TCFA and degree of coronary artery stenosis: An OCT, IVUS, and angiographic study. J Am Coll Cardiol 2014; 64: 672–680.
- 30.
Fujii K, Kawasaki D, Masutani M, Okumura T, Akagami T, Sakoda T, et al. OCT assessment of thin-cap fibroatheroma distribution in native coronary arteries. JACC Cardiovasc Imaging 2010; 3: 168–175.
- 31.
Araki M, Soeda T, Kim HO, Thondapu V, Russo M, Kurihara O, et al. Spatial distribution of vulnerable plaques: Comprehensive in vivo coronary plaque mapping. Circ Cardiovasc Imaging 2020; 13: 1989–1999.
- 32.
Bernelli C, Shimamura K, Komukai K, Capodanno D, Saia F, Garbo R, et al. Impact of culprit plaque and atherothrombotic components on incomplete stent apposition in patients with ST-elevation myocardial infarction treated with everolimus-eluting stents: An OCTAVIA Substudy. Circ J 2016; 80: 895–905.
- 33.
Feng T, Chen YD, Chen L, Sun ZJ, Liu CF, Guo J, et al. Coronary plaque response after drug eluting stent implantation assessed by serial optical coherence tomography analysis. Chin Med J (Engl) 2011; 124: 3752–3756.
- 34.
Bryniarski KL, Tahk SJ, Choi SY, Soeda T, Higuma T, Yamamoto E, et al. Clinical, angiographic, IVUS, and OCT predictors for irregular protrusion after coronary stenting. EuroIntervention 2017; 12: e2204–e2211.
- 35.
Uzu K, Shinke T, Otake H, Takaya T, Osue T, Iwasaki M, et al. Morphological and pharmacological determinants of peri-procedural myocardial infarction following elective stent implantation: Optical coherence tomography sub-analysis of the PRASFIT-Elective study. J Cardiol 2017; 70: 545–552.
- 36.
Papayannis AC, Abdel-Karim A, Mahmood A, Rangan B, Makke L, Banerjee S, et al. Association of coronary lipid core plaque with intrastent thrombus formation: A near-infrared spectroscopy and optical coherence tomography study. Catheter Cardiovasc Interv 2013; 81: 488–493.
- 37.
Porto I, Di Vito L, Burzotta F, Niccoli G, Trani C, Leone A, et al. Predictors of periprocedural (Type IVa) myocardial infarction, as assessed by frequency-domain optical coherence tomography. Circ Cardiovasc Interv 2012; 5: 89–96.
- 38.
Antonsen L, Thayssen P, Hansen H, Junker A, Veien K, Hansen K, et al. Optical coherence tomography assessment of incidence, morphological characteristics, and spontaneous healing course of edge dissections following percutaneous coronary intervention with stent implantation in patients with non-ST segment elevation myocardial infarction. Int J Cardiol 2016; 223: 466–474.
- 39.
Zeglin-Sawczuk M, Jang I-K, Kato K, Yonetsu T, Kim S, Choi SY, et al. Lipid rich plaque, female gender and proximal coronary stent edge dissections. J Thromb Thrombolysis 2013; 36: 507–513.
- 40.
Gonzalo N, Serruys P, Okamura T, Shen Z, Garcia-Garcia H, Onuma Y, et al. Relation between plaque type and dissections at the edges after stent implantation: An optical coherence tomography study. Int J Cardiol 2011; 150: 151–155.
- 41.
Ino Y, Kubo T, Matsuo Y, Yamaguchi T, Shiono Y, Shimamura K et al. Optical coherence tomography predictors for edge restenosis after everolimus-eluting stent implantation. Circ Cardiovasc Interv 2016; 9: e004231.
- 42.
Kini A, Vengrenyuk Y, Pena J, Yoshimura T, Panwar S, Motoyama S, et al. Plaque morphology predictors of side branch occlusion after provisional stenting in coronary bifurcation lesion: Results of optical coherence tomography bifurcation study (ORBID). Catheter Cardiovasc Interv 2017; 89: 259–268.
- 43.
Gamou T, Sakata K, Matsubara T, Yasuda T, Miwa K, Inoue M, et al. Impact of thin-cap fibroatheroma on predicting deteriorated coronary flow during interventional procedures in acute as well as stable coronary syndromes: Insights from optical coherence tomography analysis. Heart Vessels 2015; 30: 719–727.
- 44.
Soeda T, Higuma T, Abe N, Yamada M, Yokoyama H, Shibutani S, et al. Morphological predictors for no reflow phenomenon after primary percutaneous coronary intervention in patients with ST-segment elevation myocardial infarction caused by plaque rupture. Eur Heart J Cardiovasc Imaging 2017; 18: 103–110.
- 45.
Negishi Y, Ishii H, Suzuki S, Aoki T, Iwakawa N, Kojima H, et al. The combination assessment of lipid pool and thrombus by optical coherence tomography can predict the filter no-reflow in primary PCI for ST elevated myocardial infarction. Medicine (Baltimore) 2017; 96: e9297.
- 46.
Imola F, Occhipinti M, Biondi-Zoccai G, Di Vito L, Ramazzotti V, Manzoli A, et al. Association between proximal stent edge positioning on atherosclerotic plaques containing lipid pools and postprocedural myocardial infarction (from the CLI-POOL Study). Am J Cardiol 2013; 111: 526–531.
- 47.
Yamamoto M, Seino Y, Otsuka T, Kurihara O, Negishi K, Murakami D, et al. Identification of high-risk plaques associated with peri-procedural myocardial injury following elective percutaneous coronary intervention: Assessment by high-sensitivity troponin-T measurements and optical coherence tomography. Int J Cardiol 2013; 168: 2860–2862.
- 48.
Ozaki Y, Ohota M, Ismail TF, Okumura M, Ishikawa M, Muramatsu T. Thin cap fibroatheroma defined as lipid core abutting lumen (LCAL) on integrated backscatter intravascular ultrasound: Comparison with optical coherence tomography and correlation with peri-procedural myocardial infarction. Circ J 2015; 79: 808–817.
- 49.
Kimura S, Sugiyama T, Hishikari K, Yamakami Y, Sagawa Y, Kojima K, et al. Association of intravascular ultrasound- and optical coherence tomography-assessed coronary plaque morphology with periprocedural myocardial injury in patients with stable angina pectoris. Circ J 2015; 79: 1944–1953.
- 50.
Ueda T, Uemura S, Watanabe M, Sugawara Y, Soeda T, Okayama S, et al. Colocalization of thin-cap fibroatheroma and spotty calcification is a powerful predictor of procedure-related myocardial injury after elective coronary stent implantation. Coron Artery Dis 2014; 25: 384–391.
- 51.
Kini AS, Motoyama S, Vengrenyuk Y, Feig JE, Pena J, Baber U, et al. Multimodality intravascular imaging to predict periprocedural myocardial infarction during percutaneous coronary intervention. JACC Cardiovasc Interv 2015; 8: 937–945.
- 52.
Lee T, Murai T, Isobe M, Kakuta T. Impact of coronary plaque morphology assessed by optical coherence tomography on cardiac troponin elevation in patients with non-ST segment elevation acute coronary syndrome. Catheter Cardiovasc Interv 2017; 90: 905–914.
- 53.
Ikenaga H, Ishihara M, Inoue I, Kawagoe T, Shimatani Y, Miura F, et al. Longitudinal extent of lipid pool assessed by optical coherence tomography predicts microvascular no-reflow after primary percutaneous coronary intervention for ST-segment elevation myocardial infarction. J Cardiol 2013; 62: 71–76.
- 54.
Ozaki Y, Tanaka A, Tanimoto T, Kitabata H, Kashiwagi M, Kubo T, et al. Thin-cap fibroatheroma as high-risk plaque for microvascular obstruction in patients with acute coronary syndrome. Circ Cardiovasc Imaging 2011; 4: 620–627.
- 55.
Kakizaki R, Minami Y, Hashikata T, Nemoto T, Hashimoto T, Fujiyoshi K, et al. Impact of underlying plaque type on strut coverage in the early phase after drug-eluting stent implantation. Coron Artery Dis 2018; 29: 624–631.
- 56.
Sugiyama T, Kimura S, Ohtani H, Hishikari K, Kojima K, Sagawa Y, et al. Relationship between quantities of tissue prolapse after percutaneous coronary intervention and neointimal hyperplasia at follow-up on serial optical coherence tomography examination. Int J Cardiol 2017; 241: 470–477.
- 57.
Inoue T, Shinke T, Otake H, Nakagawa M, Hariki H, Osue T, et al. Impact of strut-vessel distance and underlying plaque type on the resolution of acute strut malapposition: Serial optimal coherence tomography analysis after everolimus-eluting stent implantation. Int J Cardiovasc Imaging 2014; 30: 857–865.
- 58.
Iannaccone M, Souteyrand G, Niccoli G, Mancone M, Sardella G, Tamburino C, et al. Clinical impact of optical coherence tomography findings on culprit plaque in acute coronary syndrome: The OCT-FORMIDABLE study registry. Catheter Cardiovasc Interv 2018; 92: E486–E492.
- 59.
Araki M, Yonetsu T, Kurihara O, Nakajima A, Lee H, Soeda T, et al. Predictors of rapid plaque progression: An optical coherence tomography study. JACC Cardiovasc Imaging, doi:10.1016/j.jcmg.2020.08.014.
- 60.
Kubo T, Ino Y, Mintz GS, Shiono Y, Shimamura K, Takahata M, et al. Optical coherence tomography detection of vulnerable plaques at high risk of developing acute coronary syndrome. Eur Heart J Cardiovasc Imaging, doi:10.1093/ehjci/jeab028.
- 61.
Xing L, Higuma T, Wang Z, Aguirre AD, Mizuno K, Takano M, et al. Clinical significance of lipid-rich plaque detected by optical coherence tomography. J Am Coll Cardiol 2017; 69: 2502–2513.
- 62.
Benjo AM, El-Hayek GE, Messerli F, DiNicolantonio JJ, Hong MK, Aziz EF, et al. High dose statin loading prior to percutaneous coronary intervention decreases cardiovascular events: A meta-analysis of randomized controlled trials. Catheter Cardiovasc Interv 2015; 85: 53–60.
- 63.
Fujino A, Mintz G, Matsumura M, Lee T, Kim SY, Hoshino M, et al. A new optical coherence tomography-based calcium scoring system to predict stent underexpansion. EuroIntervention 2018; 13: e2182–e2189.
- 64.
Shavadia JS, Vo MN, Bainey KR. Challenges with severe coronary artery calcification in percutaneous coronary intervention: A narrative review of therapeutic options. Can J Cardiol 2018; 34: 1564–1572.
- 65.
Erlinge D, Maehara A, Ben-Yehuda O, Bøtker HE, Maeng M, Kjøller-Hansen L, et al. Identification of vulnerable plaques and patients by intracoronary near-infrared spectroscopy and ultrasound (PROSPECT II): A prospective natural history study. Lancet 2021; 397: 985–995.
- 66.
Waksman R, Di Mario C, Torguson R, Ali ZA, Singh V, Skinner WH, et al. Identification of patients and plaques vulnerable to future coronary events with near-infrared spectroscopy intravascular ultrasound imaging: A prospective, cohort study. Lancet 2019; 394: 1629–1637.