Abstract
Background:
Aortic diseases (ADs), including aortic dissection, aortic aneurysm, and aortic rupture, are fatal diseases with extremely high mortality rates. Hypertension has been reported to be associated with AD development; however, it remains unclear whether a 1-year change in diastolic blood pressure (DBP) is a risk factor for AD-related mortality in the general population.
Methods and Results:
This study used a nationwide database of 235,076 individuals (aged 50–75 years) who participated in the annual “Specific Health Check and Guidance in Japan” for 2 consecutive years between 2008 and 2010. There were 55 AD-related deaths during the follow-up period of 1,770 days. All subjects were divided into 4 groups based on the baseline DBP and change in DBP at 1 year: persistent high DBP, increasing DBP, decreasing DBP, and normal DBP. Kaplan-Meier analysis demonstrated that the persistent high DBP group had the greatest risk among the 4 groups. Multivariate Cox proportional hazard regression analysis demonstrated that both DBP and 1-year change in DBP were significantly associated with AD-related deaths. The prediction capacity was significantly improved by the addition of 1-year change in DBP to confounding risk factors.
Conclusions:
This study demonstrated for the first time that a 1-year change in DBP was associated with AD-related deaths in the general population. Monitoring changes in DBP are of critical importance in the primary prevention of AD-related deaths in apparently healthy subjects aged 50–75 years.
Aortic disease (AD) comprises a spectrum of potentially devastating conditions, including aortic dissection, aortic aneurysm, and aortic rupture.1
Despite remarkable diagnostic and therapeutic progress over the past several decades, mortality and morbidity in patients with AD remain high.1–6
Therefore, it is critical to identify high-risk patients and prevent the development of AD in apparently otherwise healthy individuals during health check-ups.
The prevalence of hypertension (HT) is still increasing, and HT is a well-known risk factor for cardiovascular disease, as well as AD.5,7
According to the International Registry of Aortic Dissection data, the majority of patients have systemic HT, although there is a lower prevalence of HT among young patients aged <40 years with AD who are more likely to have genetic alterations.8,9
HT is also associated with the presence and development of aortic aneurysms.10,11
Therefore, the management of HT is of clinical interest in the primary prevention of AD in adults. Recent research focusing on systolic blood pressure (SBP)-lowering therapy since landmark trials in the 1990 s showed the benefits of SBP-lowering therapy on cardiovascular disease in isolated systolic HT in the elderly.12,13
In contrast, diastolic blood pressure (DBP) is gaining attention in the field of AD. We have previously reported that both SBP and DBP are associated with AD-related deaths in the general population aged 40–75 years.14
Rapsomaniki et al showed that DBP, but not SBP, is a risk factor for aortic aneurysm in elderly individuals aged >60 years.15
The Chicago Heart Association cohort demonstrated that DBP elevation in middle-aged individuals is linked to future abdominal AD development.16
A study by Strachan showed that DBP is a strong risk factor for dissecting aortic aneurysms in middle-aged men.17
Recently, a meta-analysis demonstrated that a high DBP of ≥80 mmHg is a risk factor for aortic aneurysm development and has superior prognostic value to SBP.11
These reports raise the possibility that DBP is a risk factor for AD.
DBP is affected by several factors such as age, sex, obesity, diet, cigarette smoking, and kidney function.18
Recently, midlife DBP was reported to be closely associated with arterial stiffness,19
whereas SBP increased and DBP decreased with increasing age due to changes in arterial stiffness.20
According to the Japanese Society of Hypertension 2019 (JSH2019) guidelines, DBP reaches a peak value in midlife (age 50–60 years) and gradually decreases with further aging. Because the incidence of AD increases with age,21
the association between AD development and high DBP seems to be controversial in Japanese subjects aged ≥50 years. Thus, research of changes in DBP over time serve to improve understanding of the influence of DBP on the development of AD. In addition, the influence of the 1-year change in DBP on AD-related mortality remains undetermined. Therefore, we focused on the 1-year change in DBP and examined whether a 1-year change in DBP could be a pivotal risk factor for AD-related death in apparently healthy subjects aged 50–75 years.
Methods
Ethics Statement
All procedures performed in studies involving human participants were performed in accordance with the ethical, institutional, and/or national research committee guidelines of the centers at which the studies were conducted (Yamagata University, 2008, no. 103), and in compliance with the 1964 Declaration of Helsinki and its later amendments or comparable ethical standards. This study was approved by the Institutional Ethics Committee of Yamagata University School of Medicine. This study was performed according to the Ethical Guidelines for Medical and Health Research Involving Human Subjects enacted by the Ministry of Health, Labour and Welfare of Japan (http://www.mhlw.go.jp/file/06-Seisakujouhou-10600000-Daijinkanboukouseikagakuka/0000069410.pdf; http://www.mhlw.go.jp/file/06-Seisakujouhou-10600000-Daijinkanboukouseikagakuka/0000080278.pdf). In the context of the guidelines, the investigators were not necessarily required to obtain informed consent; however, we publicized information concerning this study on the Internet (http://www.fmu.ac.jp/univ/sangaku/data/koukai_2/2771.pdf) and ensured that there was opportunity for the research subjects to decline the use of their personal information. All data were anonymized.
Study Population
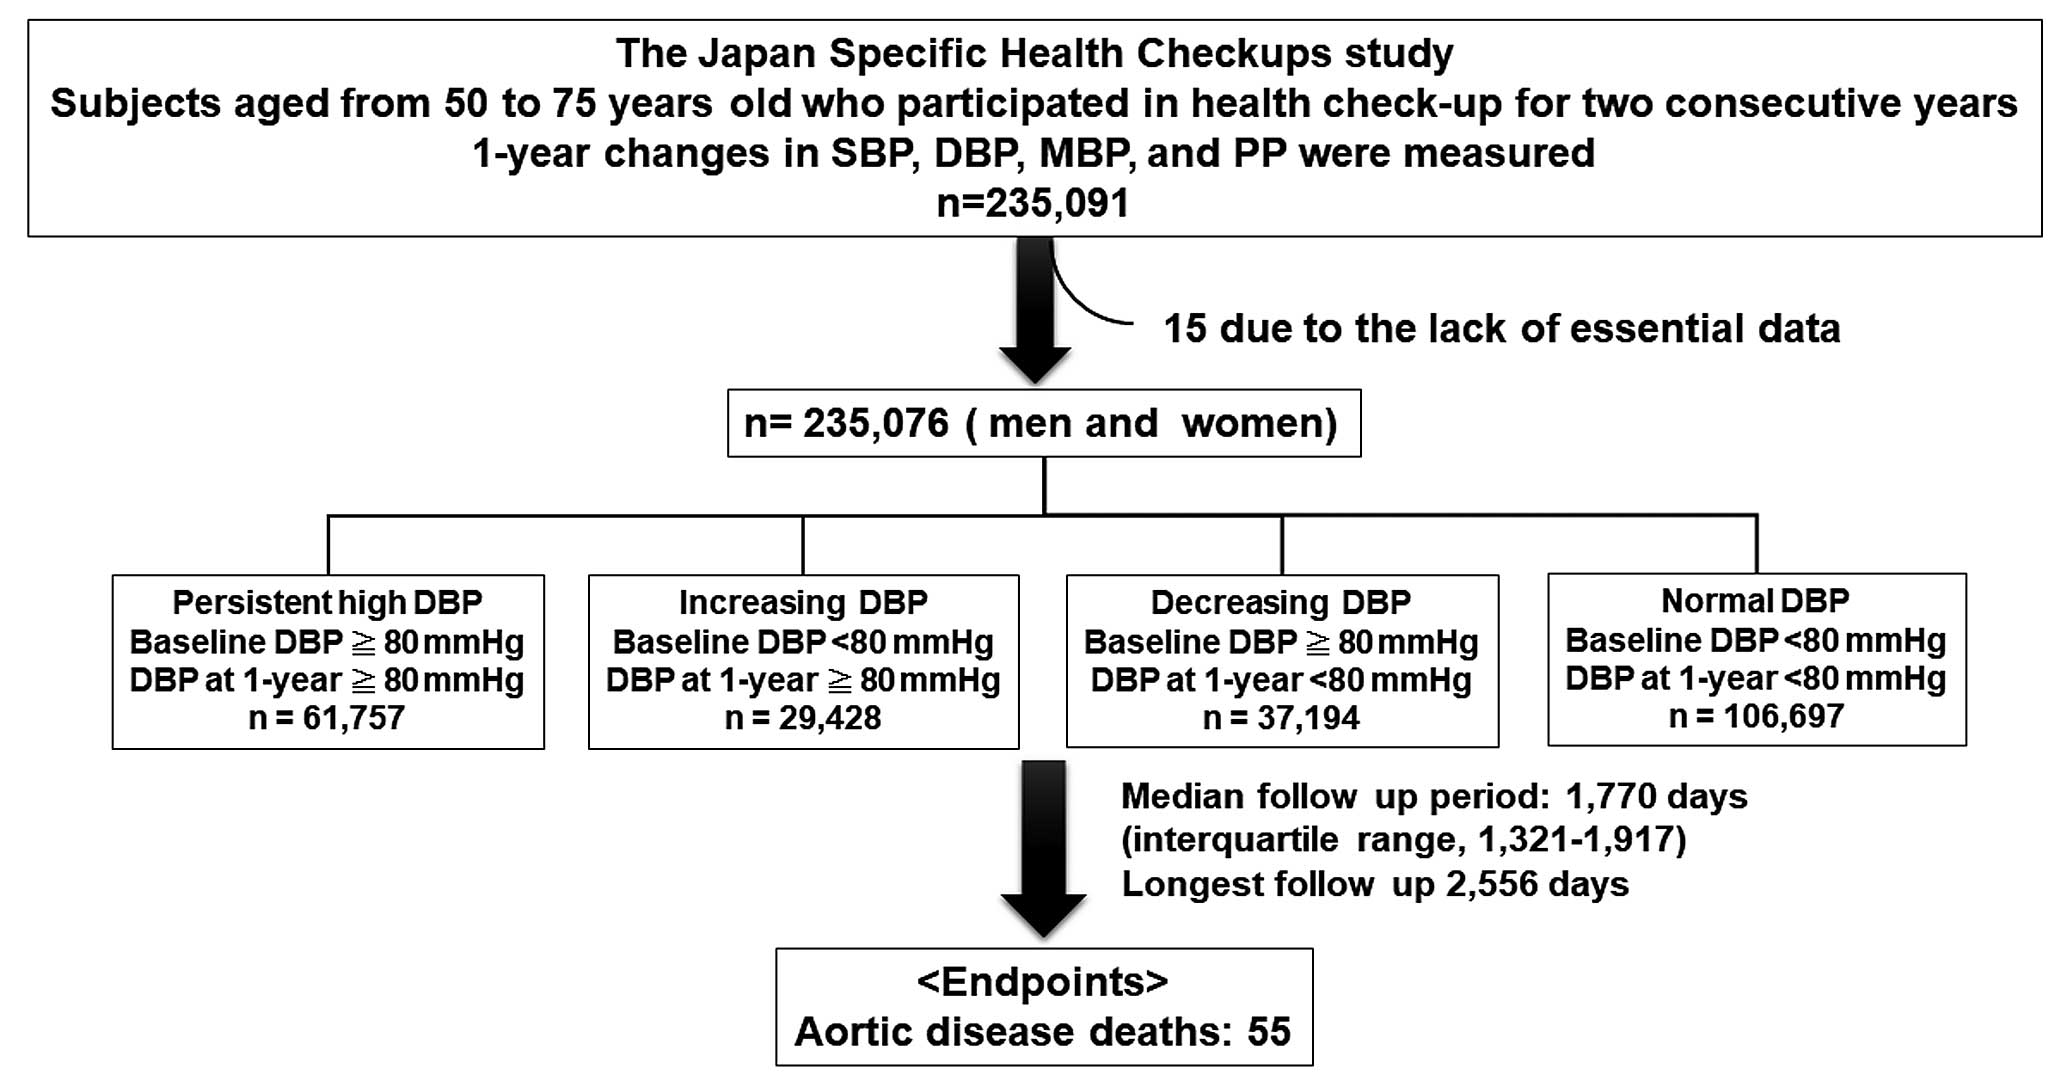
This study is part of an ongoing investigation titled “The Japan Specific Health Checkups study (J-SHC study)” and is based on individual risk assessments based on the Specific Health Check-Up provided to all inhabitants of Japan between the ages of 40 and 74 years, and is covered by the Japanese National Health Insurance. We utilized data obtained from 16 prefectures, including 55 municipalities (i.e., administrative regions): Hokkaido, Fukushima, Tochigi, Saitama, Ibaraki, Chiba, Nagano, Niigata, Ishikawa, Fukui, Gifu, Osaka, Hyogo, Tokushima, Fukuoka, Saga, Miyazaki, Nagasaki, Kumamoto, and Okinawa. As DBP is affected by aging, we collected data from 93,524 men and 141,567 women (total, 235,091; age range, 50–74 years) who underwent a health check-up in 2 consecutive years between 2008 and 2011. Among them, 15 were excluded from this study because of the lack of essential data, including SBP and DBP. Therefore, 93,519 men and 141,557 women were included in our study. All subjects were divided into 4 groups based on the baseline DBP and DBP at 1 year: persistent high DBP group, baseline DBP ≥80 mmHg and DBP at 1-year ≥80 mmHg, n=61,757; increasing DBP group, baseline DBP <80 mmHg and DBP at 1-year ≥80 mmHg, n=29,428; decreasing DBP group, baseline DBP ≥80 mmHg and DBP at 1-year <80 mmHg, n=37,194; and normal DBP group, baseline DBP <80 mmHg and DBP at 1-year <80 mmHg, n=106,697 (Figure 1).
Diabetes mellitus was defined as having a fasting blood sugar ≥126 mg/dL and glycosylated hemoglobin A1c ≥6.5% (National Glycohemoglobin Standardization Program) or use of anti-diabetic medication. Dyslipidemia was defined as high-density lipoprotein cholesterol (HDL-C) <40 mg/dL, low-density lipoprotein cholesterol (LDL-C) ≥140 mg/dL, and triglycerides ≥150 mg/dL; or use of lipid-lowering medication.
BP Measurements
The participants were seated with back support. After resting for at least 5 min, the BP was measured 2 times with no conversation occurring during this period. The BP was recorded as the average of the 2 BP readings. Mean BP (MBP) and pulse pressure (PP) were measured according to the JSH2019 guidelines: MBP = diastolic BP + PP / 3; and PP = systolic BP − diastolic BP. One-year changes in BP were defined as the difference between baseline BP and BP after 1 year.
Measurements
Fasting blood sugar, hemoglobin A1c, total cholesterol, triglycerides, HDL-C, and LDL-C levels were measured. All blood analyses were performed at a local laboratory. The methods used for the analyses were not standardized between laboratories; however, the analyses were based on the Japan Society of Clinical Chemistry-recommended methods for laboratory tests, which have been widely accepted by laboratories across Japan.
Endpoint and Follow up
After obtaining permission from the Ministry of Health, Labour and Welfare, we accessed the database containing death certificates for all deaths that occurred between 2008 and 2015 in Japan. All subjects were prospectively followed up for a median period of 1,775 days. The endpoint was AD-related death, such as death due to aortic dissection or aortic aneurysmal rupture. Death from rupture of aortic aneurysm was defined as the death code [I71.1], [I71.3], and [I71.8]. Death from aortic dissection was defied as the death code [I71.0]. The cause of death was determined by reviewing the death certificates and classified based on the death code (International Classification of Diseases, 10th
Revision).
Statistical Analysis
Differences between the 4 groups were evaluated using analysis of variance (ANOVA) with Tukey’s post-hoc test. The association between the 4 groups and aging was assessed using the chi-squared test. Survival curves were constructed using the Kaplan-Meier method and compared using log-rank tests. A Cox proportional hazard analysis was performed to determine the independent predictors of AD-related deaths. Variables were selected in a stepwise manner and entered into the multivariate analyses. Receiver operating characteristic (ROC) curves for AD-related deaths were constructed and used to compare the predictive accuracy of the baseline model with and without a 1-year change in DBP. We calculated the net reclassification index (NRI) and integrated discrimination index (IDI) to measure the quality of improvement for correct reclassification by adding 1-year change in DBP to the multivariate model. Statistical significance was set at P<0.05. All statistical analyses were performed using standard statistical program packages (JMP version 12, SAS Institute Inc., Cary, NC, USA, and R 3.0.2, with additional packages including Rcmdr, Epi, pROC, and PredictABEL).
Results
Comparison of Clinical Characteristics Between the 4 Groups Divided Based on DBP Changes
As shown in
Table 1, the mean DBP, DBP at 1 year, and 1-year change in DBP in the normal DBP group were 69, 68, and −0.4 mmHg, respectively. The mean DBP, DBP at 1 year, and 1-year change in DBP in the decreasing DBP group were 84, 72, and −12 mmHg, respectively. The mean DBP, DBP at 1 year, and 1-year change in DBP in the increasing DBP group were 72, 84, and 11 mmHg, respectively. The mean DBP, DBP at 1 year, and 1-year change in DBP in the persistent high DBP group were 87, 86, and −0.6 mmHg, respectively.
Table 1.
Comparisons of Baseline Clinical Characteristics Among 4 Groups Based on DBP Change
| Variables |
Normal DBP
(n=106,697) |
Decreasing DBP
(n=37,194) |
Increasing DBP
(n=29,428) |
Persistent high DBP
(n=61,757) |
| Age, years |
65.7±5.6 |
65.9±5.5* |
65.8±5.5† |
65.2±5.6*,†,‡ |
| Men, n (%) |
35,171 (33) |
15,784 (42) |
12,227 (42) |
30,337 (49)§ |
| BMI, kg/m2 |
22.5±3.0 |
23.5±3.2* |
23.3±3.1*,† |
23.9±3.3*,†,‡ |
| Waist circumference, cm |
82.4±8.8 |
84.7±8.8* |
84.3±8.8*,† |
85.7±8.8*,†,‡ |
| Obese, n (%) |
20,223 (19) |
10,621 (29) |
7,831 (27) |
20,730 (34)§ |
| SBP, mmHg |
121±14 |
137±14* |
127±13*,† |
141±15*,†,‡ |
| DBP, mmHg |
69±7 |
84±5* |
72±5*,† |
87±7*,†,‡ |
| MBP, mmHg |
85±8 |
102±7* |
91±6*,† |
105±8*,†,‡ |
| PP, mmHg |
52±12 |
53±13* |
55±12*,† |
54±13*,†,‡ |
| SBP at 1 year, mmHg |
120±14 |
127±13* |
136±13*,† |
140±14*,†,‡ |
| DBP at 1 year, mmHg |
68±7 |
72±5* |
84±5*,† |
86±6*,†,‡ |
| MBP at 1 year, mmHg |
86±8 |
91±6* |
101±6*,† |
105±8*,†,‡ |
| PP at 1 year, mmHg |
52±12 |
55±12* |
53±12*,† |
54±12*,†,‡ |
| 1-year change in SBP, mmHg |
−0.1±13 |
−10±14* |
9±14*,† |
−0.5±15*,†,‡ |
| 0 (−8, 8) |
−10 (−18, 0) |
8 (0, 18) |
0 (−10, 8) |
| 1-year change in DBP, mmHg |
−0.4±7 |
−12±7* |
11±7*,† |
−0.6±7*,†,‡ |
| 0 (−5, 4) |
−10 (−16, −7) |
10 (6, 15) |
0 (−4, 4) |
| 1-year change in MBP, mmHg |
−0.3±8 |
−11±8* |
11±8*,† |
−0.6±8*,†,‡ |
| 0 (−5.3, 4.7) |
−10 (−15.7, −6) |
9.7 (5.3, 14.7) |
−0.3 (−5.3, 4.3) |
| 1-year change in PP, mmHg |
0.3±11.4 |
1.8±13.3* |
−2.1±12.8*,† |
0±0.1*,†,‡ |
| 0 (−7, 8) |
2 (−6, 10) |
−2 (−10, 6) |
0 (−8, 8) |
| Dyslipidemia, n (%) |
57,866 (54) |
21,689 (58) |
16,902 (57) |
36,573 (59)§ |
| Diabetes mellitus, n (%) |
10,723 (10.0) |
4,249 (11.4) |
3,077 (10.5) |
6,482 (10.5)§ |
| Smoking, n (%) |
11,471 (10.8) |
4,084 (11.0) |
3,487 (11.9) |
7,470 (12.1)§ |
| Region area, n (%) |
| Hokkaido and Tohoku |
8,662 (8.1) |
3,340 (9.0) |
2,786 (9.5) |
5,534 (9.0) |
| Kanto and Koshinetsu |
28,879 (27.1) |
9,991 (26.7) |
7,285 (24.8) |
16,652 (27.0) |
| Kinki, Shikoku and Chugoku |
4,203 (3.9) |
1,577 (4.2) |
1,231 (4.2) |
2,974 (4.8) |
| Kyushu and Okinawa |
64,953 (61) |
22,286 (59.9) |
18,126 (61.6) |
36,597 (59.3) |
| Biochemical data |
| HbA1c (%) |
5.4±0.6 |
5.4±0.7 |
5.4±0.6 |
5.4±0.7 |
| FBS, mg/dL |
96±18 |
99±20* |
98±18*,† |
99±19*,†,‡ |
| Total cholesterol, mg/dL |
211±33 |
213±34* |
211±34† |
214±34*,‡ |
| Triglyceride, mg/dL |
112±67 |
125±80* |
121±75*,† |
130±86*,†,‡ |
| HDL-C, mg/dL |
62.8±16.1 |
61.4±15.7* |
61.3±15.9* |
60.9±16.0*,†,‡ |
| LDL-C, mg/dL |
126±30 |
127±30* |
126±30† |
127±31*,‡ |
| Medications |
| Anti-HT drug, n (%) |
24,407 (23) |
13,639 (37) |
10,052 (34) |
25,520 (41)§ |
| Anti-dyslipidemia drug, n (%) |
18,429 (17) |
6,508 (18) |
5,313 (18) |
10,133 (16)§ |
| Anti-diabetic drug, n (%) |
5,808 (5.4) |
1,895 (5.1) |
1,487 (5.1) |
2,625 (4.3)§ |
| Anti-HT drug at 1 year, n (%) |
25,974 (24) |
16,054 (43) |
10,461 (36) |
28,418 (46)§ |
| Anti-dyslipidemia drug at 1 year, n (%) |
21,391 (20) |
8,088 (22) |
5,997 (20) |
11,981 (19)§ |
| Anti-diabetic drug at 1 year, n (%) |
6,406 (5.4) |
2,267 (6.1) |
1,600 (6.0) |
3,088 (5.0)§ |
Incidence of AD-related deaths, per 100,000
person · years |
2.3 |
1.8 |
7.6 |
11.1 |
Data are expressed as mean±SD, number (%), or median. AD, aortic disease; BMI, body mass index; DBP, diastolic blood pressure; FBS, fasting blood sugar; HbA1c, glycosylated hemoglobin A1c; HDL-C, high-density lipoprotein cholesterol; HT, hypertension; LDL-C, low-density lipoprotein cholesterol; MBP, mean blood pressure; PP, pulse pressure; SBP, systolic blood pressure. *P<0.05 vs. normal DBP, †P<0.05 vs. decreasing DBP group, ‡P<0.05 vs. increasing DBP group by analysis of variance (ANOVA) with Tukey’s post-hoc test. §P<0.05 by chi-squared test.
Subjects in the persistent high DBP group were younger and had a higher proportion of men; higher prevalence of obesity, dyslipidemia, and smoking; higher body mass index, waist circumference, SBP, DBP, MBP, SBP at 1-year, DBP at 1-year, MBP at 1-year, fasting blood sugar, total cholesterol, and triglycerides; lower HDL-C levels; and more frequently took anti-HT drugs than those in the other 3 groups (Table 1).
Subjects in the increasing DBP group were older and had a higher proportion of men; higher prevalence rate of obesity, dyslipidemia, and smoking; higher body mass index, waist circumference, SBP, DBP, MBP, PP, SBP at 1-year, DBP at 1-year, MBP at 1-year, PP at 1-year, fasting blood sugar, and triglycerides; lower HDL-C levels; and more frequently took anti-HT drugs than those in the normal DBP group. However, they were younger and had lower body mass index, waist circumference, SBP, DBP, MBP, PP at 1-year, fasting blood sugar, total cholesterol, triglyceride, and LDL-C; and higher PP, SBP at 1-year, DBP at 1-year, and MBP at 1-year than those in the decreasing DBP group (Table 1).
Subjects in the decreasing DBP group were older and had a higher proportion of men; higher prevalence rate of obesity, dyslipidemia, and diabetes mellitus; higher body mass index, waist circumference, SBP, DBP, MBP, PP, SBP at 1-year, DBP at 1-year, MBP at 1-year, PP at 1-year, fasting blood sugar, total cholesterol, triglycerides, and LDL-C; lower HDL-C; and more frequent use of anti-HT drugs than those in the normal DBP group (Table 1).
Association Between the 4 Groups Defined Based on DBP Change and Aging
The rate of persistent high DBP decreased with increasing age, but the rates of increasing DBP and decreasing DBP were similar in all subjects (Figure 2A). The rate of persistent high DBP was significantly higher in subjects who took anti-HT drugs than in those who did not. The difference in the rate of persistent high DBP depended on and decreased with increasing age; it was highest in subjects aged 50–54 years (Figure 2B). Importantly, increasing DBP was observed in each age group independent of anti-HT drug use.
Persistent High DBP, Increasing DBP, and AD-Related Deaths
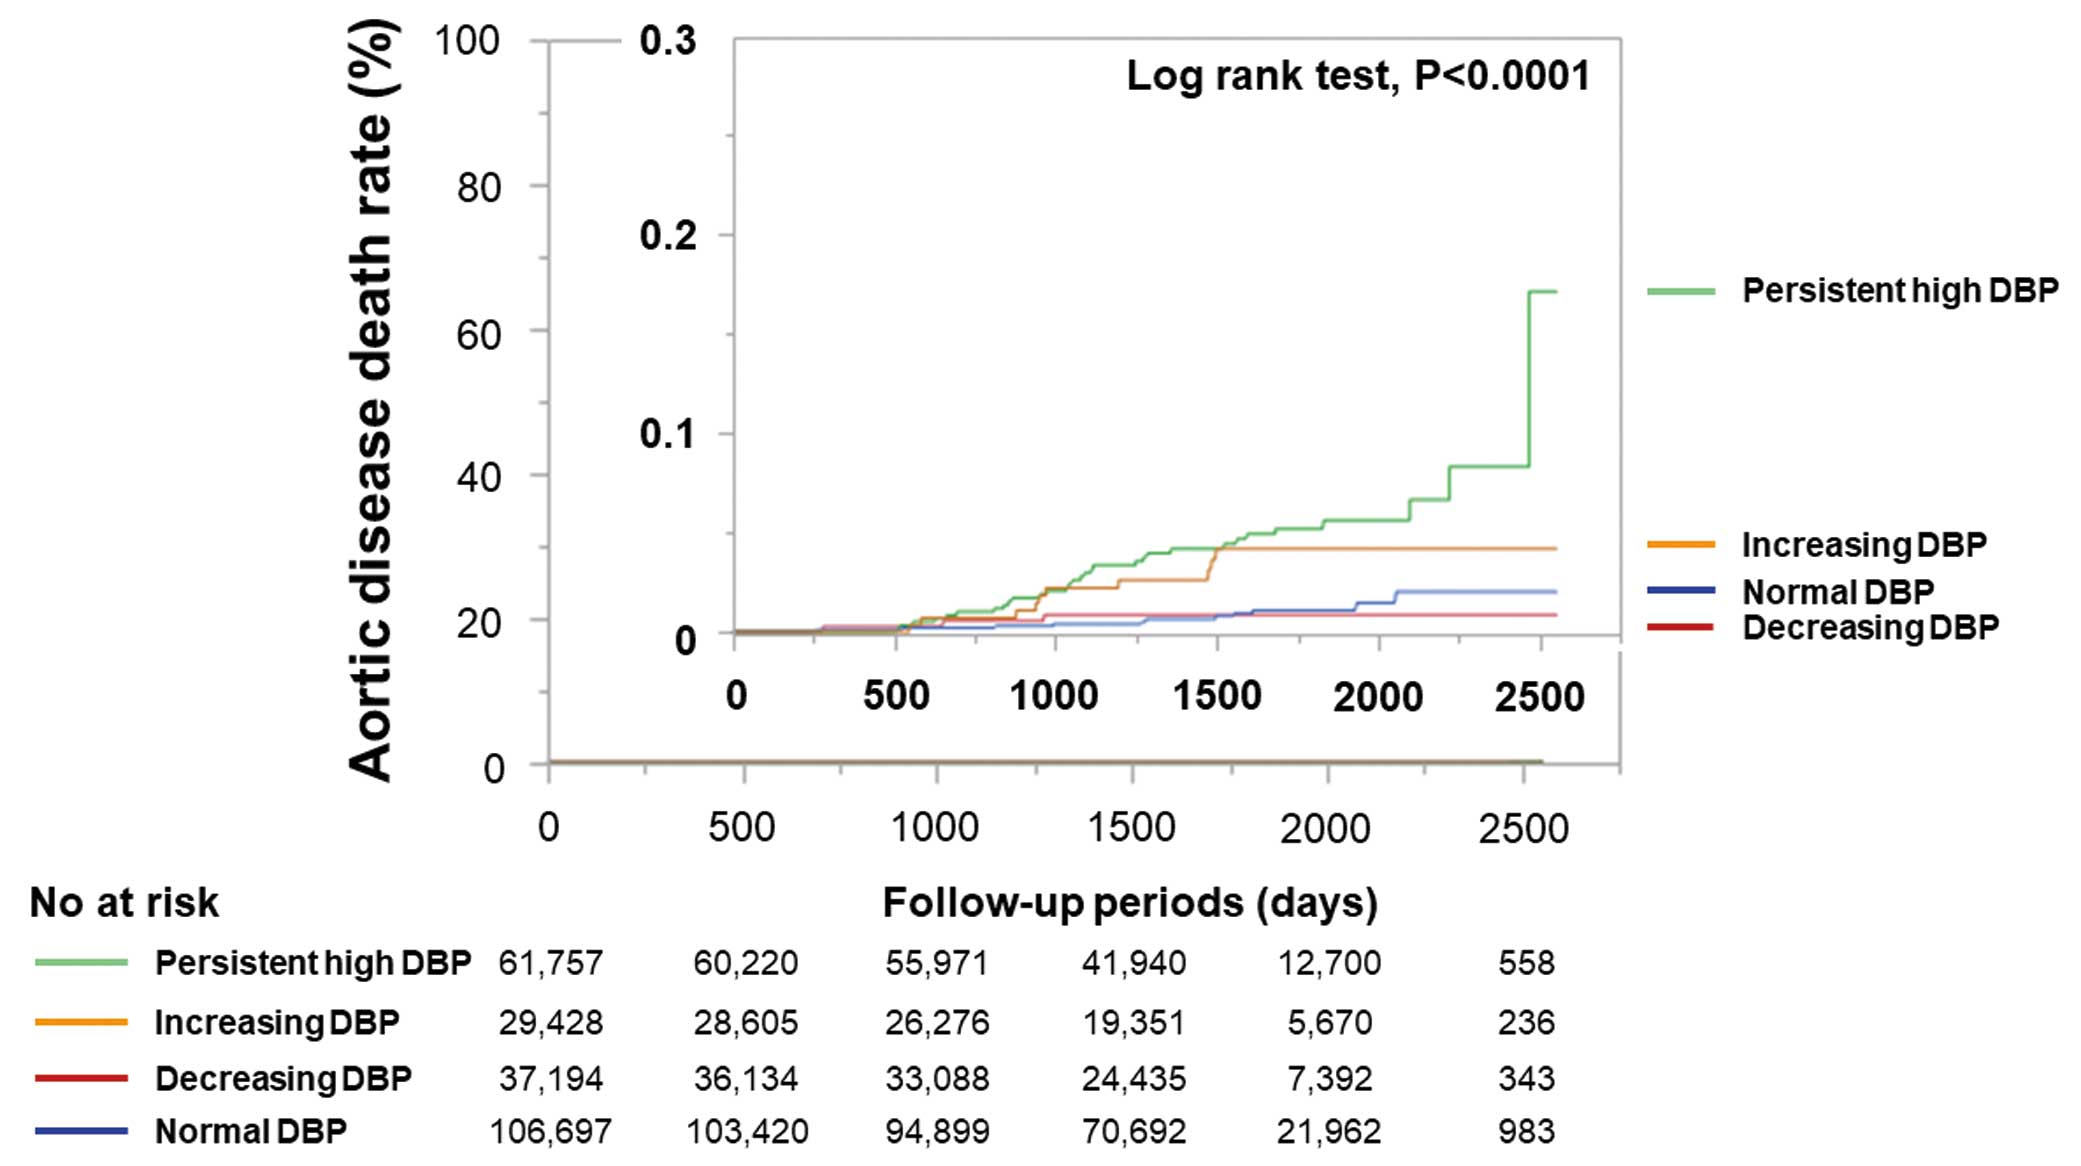
During the follow-up period, 55 AD-related deaths occurred. Kaplan-Meier analysis demonstrated that the persistent high DBP group had the greatest risk of AD-related death among our 4 groups (Figure 3).
To determine whether the 4 groups divided based on DBP change were related to AD-related deaths, we performed univariate and multivariate Cox proportional hazard regression analyses. In the univariate analysis, persistent high DBP and increasing DBP groups were significantly associated with AD-related mortality, but the decreasing DBP group was not (Figure 4A). A multivariate Cox proportional hazard regression analysis demonstrated that both persistent high DBP and increasing DBP groups were significantly associated with future AD-related deaths after adjusting for age, sex, SBP, and smoking (Figure 4B). Next, to examine whether anti-HT drug use affected the association between the 4 groups and AD-related deaths, we performed subgroup analyses in subjects with and without anti-HT drugs. The multivariate Cox proportional hazard regression analysis demonstrated that both persistent high DBP and increasing DBP groups were significantly associated with future AD-related deaths after adjusting for age, sex, SBP, and smoking in subjects with anti-HT drugs (Figure 4C). In contrast, the multivariate Cox proportional hazard regression analysis demonstrated that only persistent high DBP was significantly associated with future AD-related deaths after adjusting for age, sex, SBP, and smoking in subjects without anti-HT drugs (Figure 4D).
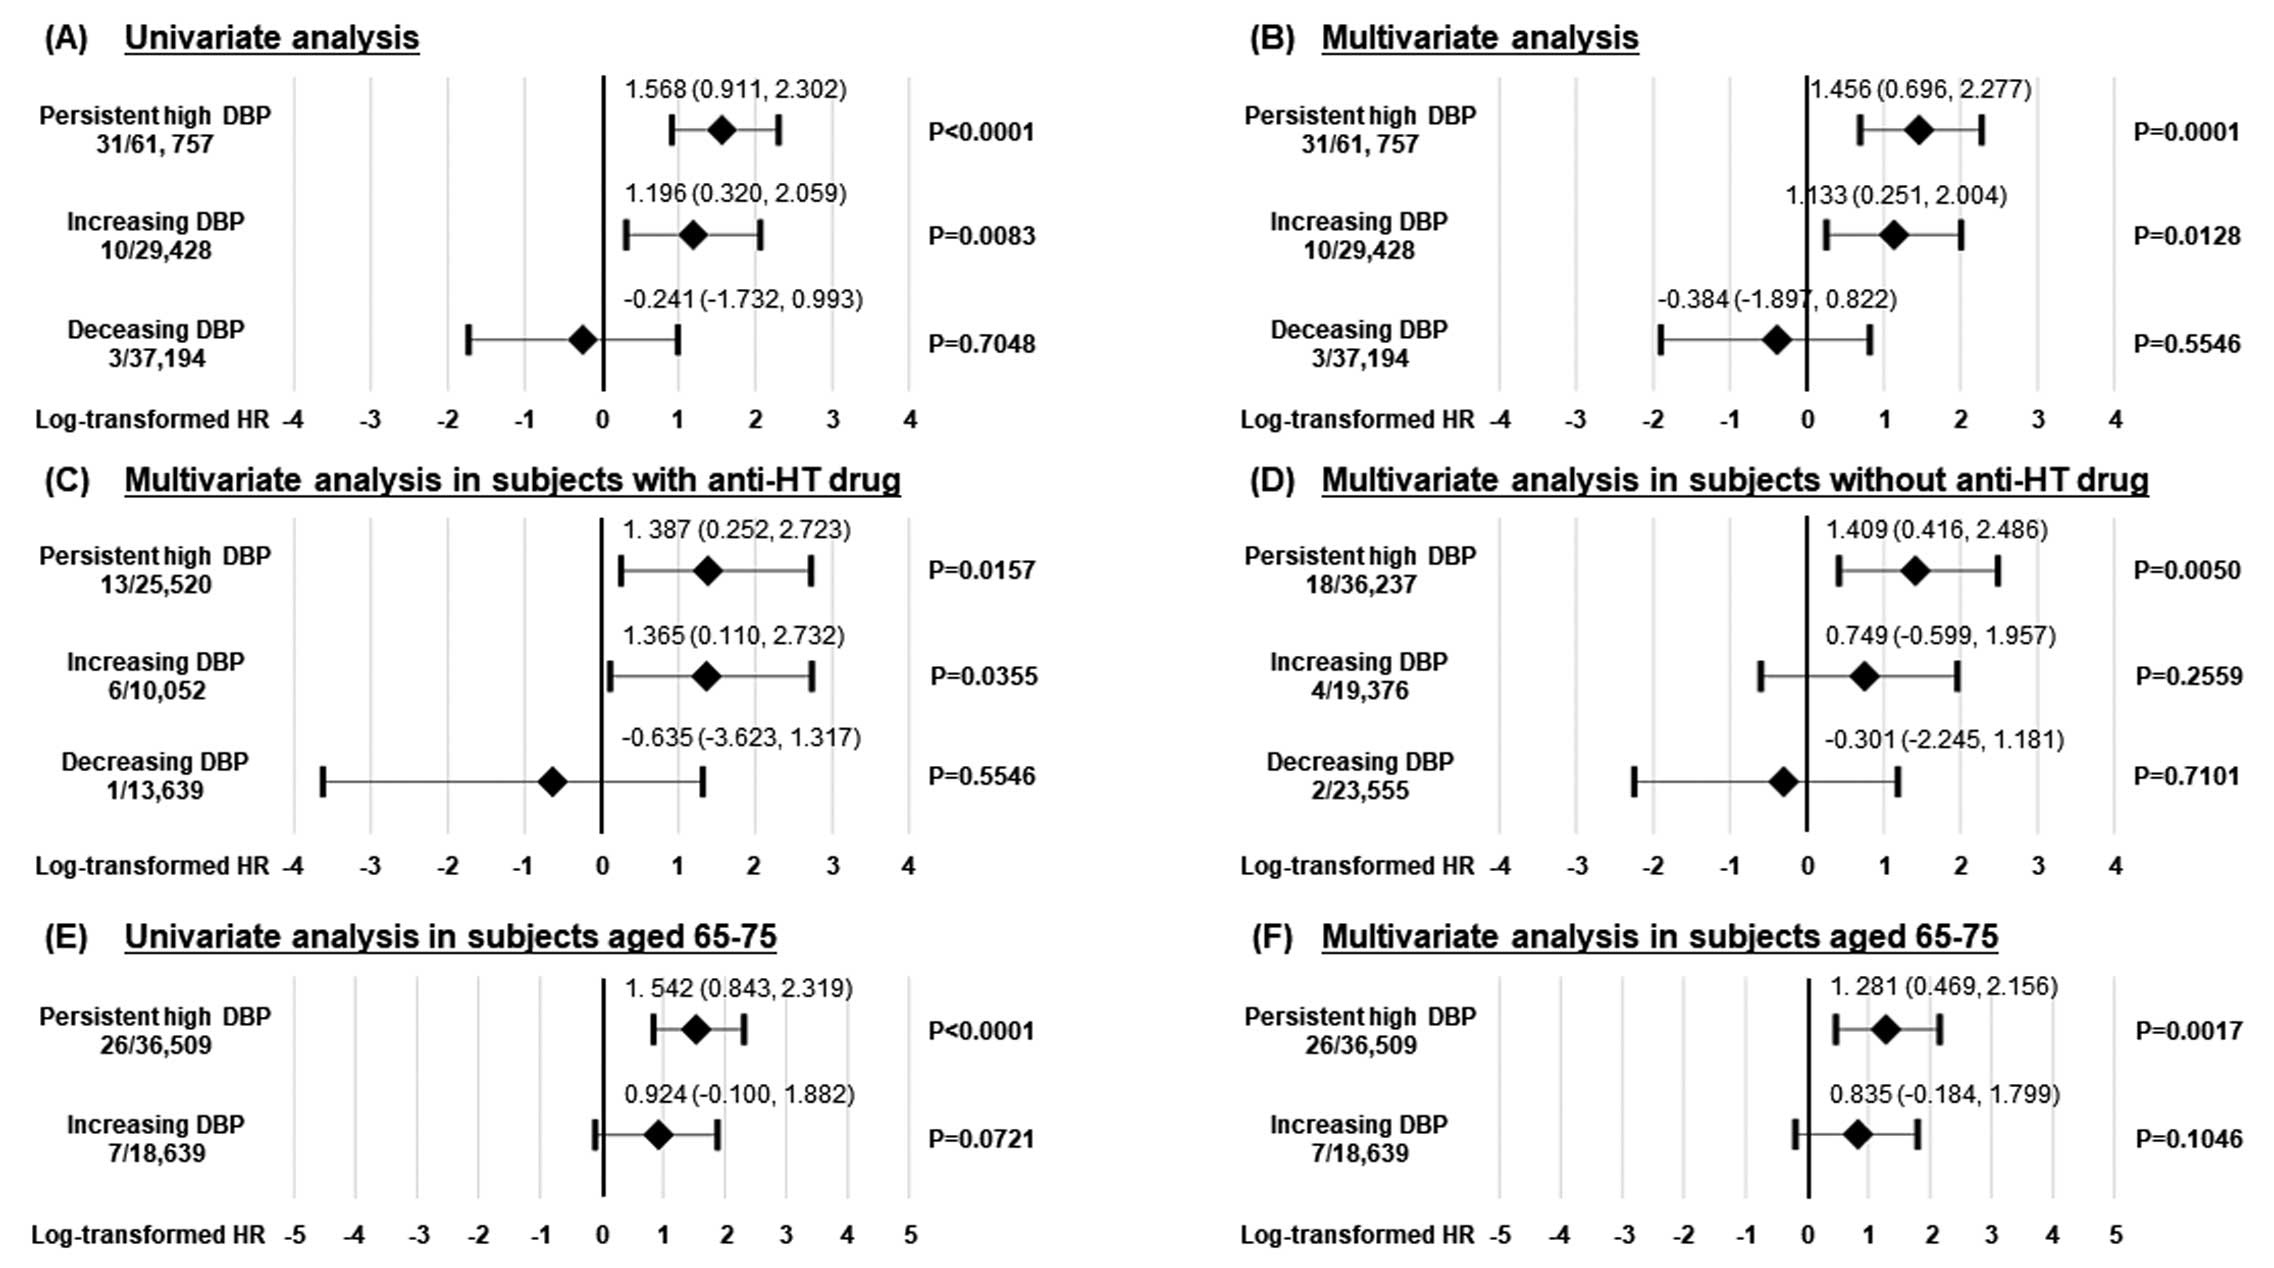
To examine the impact of DBP change on the AD-related mortality in elderly subjects more precisely, we performed subgroup analysis for subjects aged 65–75 years. During the follow-up period, there were no AD-related deaths in the decreasing DBP group. The multivariate Cox proportional hazard regression analysis demonstrated that persistent high DBP was significantly associated with future AD-related deaths after adjusting for sex, SBP, and smoking in subjects aged 65–75 years.
One-Year Change in DBP and AD-Related Deaths
To determine whether a 1-year change in DBP is associated with AD-related deaths, independent of baseline DBP, we performed univariate and multivariate Cox proportional hazard regression analyses. In the univariate analysis, SBP, DBP, MBP, 1-year change in DBP, and 1-year change in MBP were significantly associated with AD-related mortality, but not PP, 1-year change in SBP, and 1-year change in PP (Table 2). A multivariate Cox proportional hazard regression analysis model 1 demonstrated that SBP, DBP, MBP, 1-year change in DBP, and 1-year change in MBP were associated with future AD-related deaths after adjusting for age, sex, smoking, and anti-HT drug use. A multivariate Cox proportional hazard regression analysis model 2 demonstrated that both baseline DBP and 1-year change in DBP were independently associated with future AD-related deaths after adjusting for age, sex, SBP, and anti-HT drug use (DBP: hazard ratio=1.098, 95% confidence interval=1.060–1.139, P<0.0001; 1-year change in DBP: hazard ratio=1.084, 95% confidence interval=1.054–1.115, P<0.0001;
Table 2).
Table 2.
Univariate and Multivariate Cox Proportional Hazard Analyses of Predicting AD Deaths
| Variables |
Univariate analysis |
Multivariate analysis model 1 |
Multivariate analysis model 2 |
| HR |
95% CI |
P value |
HR |
95% CI |
P value |
HR |
95% CI |
P value |
| SBP# |
1.024 |
1.010–1.039 |
0.0010 |
1.018 |
1.003–1.034 |
0.0177 |
|
|
|
| DBP# |
1.050 |
1.026–1.074 |
<0.0001 |
1.050 |
1.026–1.076 |
<0.0001 |
1.098 |
1.060–1.139 |
<0.0001 |
| MBP# |
1.045 |
1.023–1.067 |
<0.0001 |
1.042 |
1.019–1.065 |
0.0003 |
|
|
|
| PP# |
1.010 |
0.989–1.031 |
0.3327 |
0.999 |
0.977–1.020 |
0.8623 |
|
|
|
| 1-year change in SBP# |
1.012 |
0.993–1.030 |
0.1963 |
1.012 |
0.994–1.030 |
0.1945 |
|
|
|
| 1-year change in DBP# |
1.040 |
1.011–1.068 |
0.0049 |
1.040 |
1.012–1.068 |
0.0043 |
1.084 |
1.054–1.115 |
<0.0001 |
| 1-year change in MBP# |
1.034 |
1.007–1.061 |
0.0146 |
1.033 |
1.007–1.061 |
0.0136 |
|
|
|
| 1-year change in PP# |
0.993 |
0.971–1.015 |
0.5192 |
0.993 |
0.972–1.015 |
0.5286 |
|
|
|
#Per 1-mmHg increase. Multivariate analysis model 1 was adjusted for age, gender, smoking, and anti-hypertensive drugs. Multivariate analysis model 2 was adjusted for age, gender, SBP, DBP, and anti-hypertensive drugs. CI, confidence interval; HR, hazard ratio. Other abbreviations as in Table 1.
To examine whether model fit and discrimination were improved by the addition of a 1-year change in DBP, we constructed ROCs for AD-related mortality and calculated the NRI and IDI. The baseline model included age, sex, SBP, DBP, smoking, and anti-HT drug use. The ROC curve analysis demonstrated that the C index of the baseline model was significantly improved by the addition of a 1-year change in DBP (Figure 5). The NRI and IDI were also significantly improved by the addition of 1-year change in DBP (Table 3).
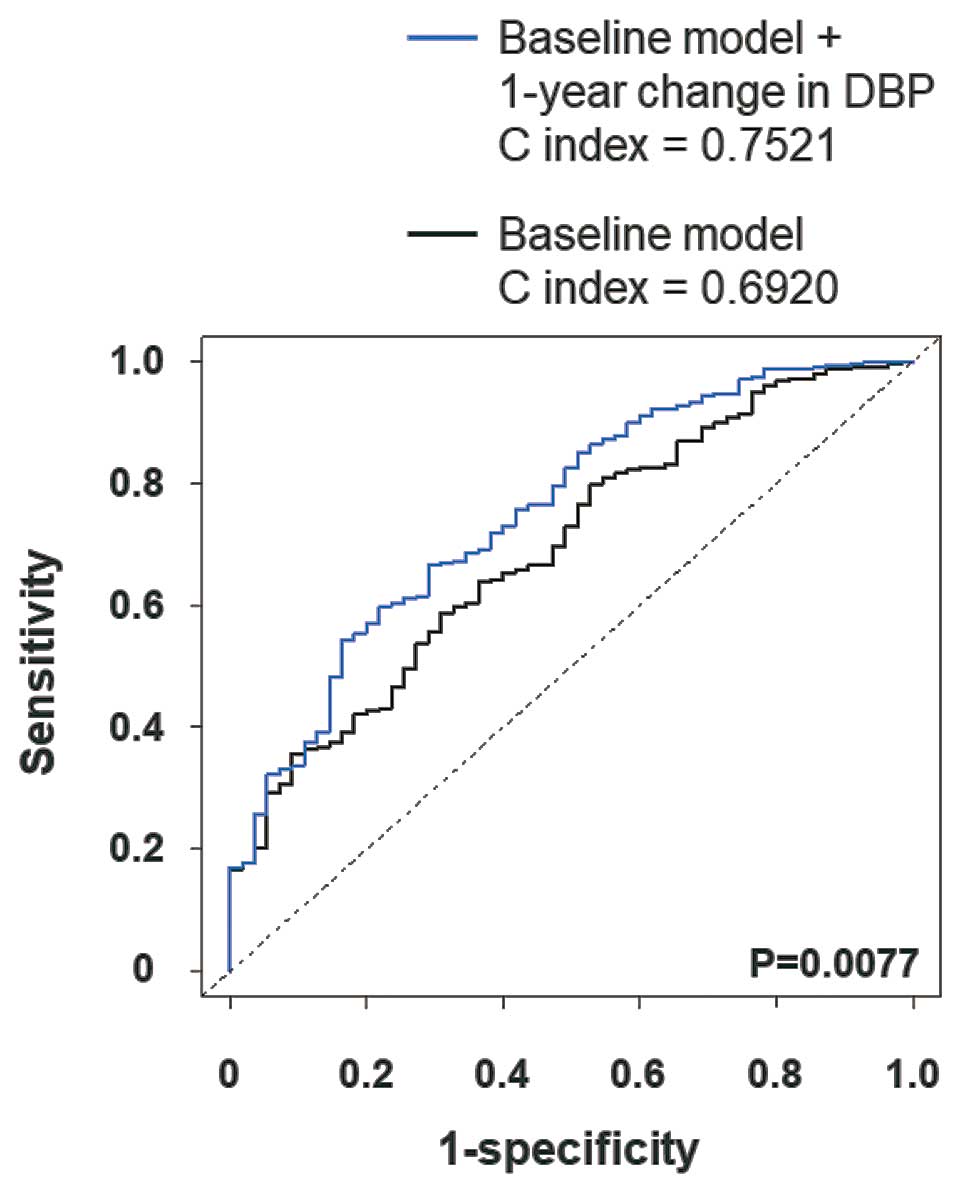
Table 3.
Statistics for Model Fit and Improvement With the Addition of a 1-Year Change in Diastolic Blood Pressure for the Prediction of Aortic Disease Death
| All-cause mortality |
C index |
NRI
(95% CI, P value) |
IDI
(95% CI, P value) |
| Baseline model |
0.6920 |
Reference |
Reference |
| Baseline model + 1-year change in diastolic blood pressure |
0.7521
(P=0.0077) |
0.6447
(0.3966–0.8927, P<0.0001) |
0.0003
(0.0002–0.0005, P=0.0002) |
Baseline model includes age, sex, systolic blood pressure, diastolic blood pressure, smoking, and anti-hypertensive drugs. CI, confidence interval; IDI, integrated discrimination index; NRI, net reclassification index.
Discussion
The main findings in the present study were as follows: (1) persistent high DBP, increasing DBP, and decreasing DBP were identified in 26.3%, 12.5%, and 15.8% of study subjects; (2) Kaplan-Meier analysis demonstrated that the persistent high DBP group had the greatest risk of AD-related death; (3) the persistent high DBP group was related to AD-related death independently of anti-HT drug use, but the increasing DBP group was only related to AD-related death in subjects with anti-HT drug use; (4) multivariate analysis showed that both DBP and a 1-year change in DBP were independently associated with AD-related death; and (5) the baseline prediction model was significantly improved by the addition of a 1-year change in DBP in apparently healthy subjects aged 50–75 years.
There is no unanimous optimal target blood pressure to prevent AD. According to JSH2019, HT is defined as SBP ≥140 mmHg and/or DBP ≥90 mmHg. There were 167,343 (71%) subjects at baseline and 171,877 subjects (73%) at 1 year with a BP <140/90 mmHg, suggesting that BP was well controlled in the study population. In contrast, the ACC/AHA/AAPA/ABC/ACPM/AGS/APhA/ASH/ASPC/NMA/PCNA 2017 guidelines redefined HT as SBP >130 or DBP >80 mmHg and noted that reducing SBP to <130 mmHg reduces the risk of myocardial infarction, stroke, heart failure, and major adverse cardiovascular events.22
It is still under discussion how to apply the new guideline in the general population.23,24
Although a randomized controlled trial examining the usefulness of intensive BP control relative to conventional BP control in type B aortic dissection is in progress,25
it was reported that a controlled BP of <130/80 mmHg reduced the risk of recurrence of aortic dissection in patients with type B aortic dissection.26
Kobeissi et al demonstrated that the risk of abdominal aortic aneurysm significantly increases at a DBP of 79 mmHg.11
Considering these studies, we defined high DBP as DBP ≥80 mmHg and assessed the change in DBP in an apparently healthy Japanese population aged 50–75 years. Approximately 40% of subjects had a high DBP at baseline and 1-year later, suggesting that the prevalence of high DBP was relatively high in the general Japanese population aged 50–75 years. In the present study, persistent high DBP was associated with AD-related death, but was not with decreasing DBP despite similar baseline DBP levels. This result raised the possibility that the improvement of DBP leads to a reduction in the risk of AD-related deaths. Furthermore, the increasing DBP group treated with an anti-HT drug was related to AD-related death, but this was not the case in the untreated increasing DBP group. Considering the subjects whose DBP increased despite treatment with HT, it was speculated that refractory hypertension contributed to future AD-related deaths in the increasing DBP group with anti-HT drugs. Clinical and experimental studies have demonstrated the importance of the renin angiotensin aldosterone system in the development of AD and the effectiveness of anti-HT drugs targeting the renin-angiotensin-aldosterone system.27–30
It is well known that angiotensin receptor blockers, mineral corticoid receptor blockers, and angiotensin-converting enzyme inhibitors reduce both SBP and DBP simultaneously. Thus, anti-HT drugs targeting the renin-angiotensin-aldosterone system may partially reduce the risk of AD-related death through a reduction in DBP. Further studies are needed to reveal the impact of DBP reduction on AD development.
We showed that a 1-year change in DBP is a useful predictor of AD-related deaths. The C index of 1-year change in DBP was significantly larger than that of SBP, MBP, and PP (Supplementary Figure), suggesting the usefulness of a 1-year change in DBP over a 1-year change in other BP-related variables. It was beyond the scope of the present study to elucidate the mechanism by which a 1-year change in DBP induced AD-related death, as this is an observational study. One explanation may be that DBP increases aortic wall stress. Alternatively, comorbidities of high DBP, such as obesity and dyslipidemia, may contribute to AD-related deaths. A recent study indicated that DBP variability is a risk factor for end-stage renal disease.31
As chronic kidney disease is closely associated with AD development,32
a 1-year change in DBP may be related to AD-related mortality through an advancement in kidney dysfunction. Of note, multivariate Cox proportional hazard regression analysis demonstrated that a 1-year change in DBP was independently associated with AD-related death. Furthermore, a 1-year change in DBP improved the C index, NRI, and IDI. This result confirms the clinical importance of change in DBP in AD-related deaths and raised the possibility that a 1-year change in DBP could be an additional clinical factor to consider in addition to DBP in apparently healthy subjects aged 50–75 years. The clinical significance of the present study was that a 1-year change in DBP was a pivotal risk factor for AD-related deaths, independent of DBP, indicating that a change in DBP could be a feasible marker for premature AD-related sudden deaths in apparently healthy subjects aged 50–75 years.
Perspectives
AD is a major cause of sudden death, indicating the importance of primary prevention. This nationwide observational cohort revealed the influence of a 1-year change in DBP on AD-related mortality in apparently healthy subjects aged 50–75 years. Monitoring change in DBP may serve as the risk-stratification of subjects at high risk for premature AD-related sudden deaths in apparently healthy subjects aged 50–75 years.
Study Limitations
The strengths of the present study include its large sample size, follow-up design, and nationwide data source. Therefore, our results are generalizable and highly reliable. However, there are some limitations to this study. First, we did not examine the development of AD and had no medical data on surgical and/or endovascular aortic repair. Although AD can be fatal, some patients survived, most likely because of treatment. Thus, we underestimated the influence of a 1-year change in DBP on the development of AD. Second, there was a low number of AD-related deaths. Third, although BP was mainly measured using a mercury sphygmomanometer, there was no standardization or inspection system to measure BPs in this study. Fourth, we had no information on the medications used by this population. Finally, because AD-related deaths were observed in only 55 subjects in this study, we were obliged to perform multivariate analysis in a stepwise manner. However, it was reported that the overall global death rate from AD ranged from 2.49/100,000 to 2.78/100,000 between 1990 and 2010.33,34
Therefore, our event rates appear to be valid.
Conclusions
The prevalence of high DBP (≥80 mmHg) was relatively high, and persistent high DBP may be a feasible marker for AD-related death in the general Japanese population aged 50–75 years. A 1-year change in DBP was a pivotal risk factor for AD-related deaths independent of baseline DBP in apparently healthy subjects. Monitoring DBP changes in health check-ups is of critical importance in the primary prevention of AD-related deaths in the general Japanese population aged 50–75 years.
Acknowledgments
This work was supported by a Health and Labor Sciences Research Grant for Study on the Design of the Comprehensive Health Care System for Chronic Kidney Disease (CKD) based on the individual risk assessment by Specific Health Check-Up of the Ministry of Health, Labor and Welfare of Japan, and a Grant-in-Aid for Research on Advanced Chronic Kidney Disease (REACH-J), Practical Research Project for Renal Disease from the Japan Agency for Medical Research and Development (AMED). We would like to thank Editage (www.editage.com) for English-language editing.
Disclosures
The authors have no conflicts of interest to declare.
IRB Information
Yamagata University approved this study (2008, no. 103).
Data Availability
Data cannot be shared publicly due to ethical restrictions on sharing data publicly. The protocol of this project determined that analytical data were distributed only to the members of the steering committee to avoid any possibility that someone else may identify individuals of this cohort. Because the data contain potentially identifying information (i.e., prefectural number and date of health checking), our institutional ethics committee has imposed them to be used. Also, data had been obtained with the protocol approved by the relevant institutional ethical review board. Data are available upon request. Please contact the Department of Chronic Kidney Disease Initiatives, Fukushima Medical University School of Medicine, 1-Hikarigaoka, Fukushima 960-1295, Japan. Phone & Fax: +81-24-547-1898; E-mail: dckdi@fmu.ac.jp.
Supplementary Files
Please find supplementary file(s);
http://dx.doi.org/10.1253/circj.CJ-21-0514
References
- 1.
Erbel R, Aboyans V, Boileau C, Bossone E, Bartolomeo RD, Eggebrecht H, et al. 2014 ESC Guidelines on the diagnosis and treatment of aortic diseases: Document covering acute and chronic aortic diseases of the thoracic and abdominal aorta of the adult. The Task Force for the Diagnosis and Treatment of Aortic Diseases of the European Society of Cardiology (ESC). Eur Heart J 2014; 35: 2873–2926.
- 2.
Ashton HA, Buxton MJ, Day NE, Kim LG, Marteau TM, Scott RA, et al. The Multicentre Aneurysm Screening Study (MASS) into the effect of abdominal aortic aneurysm screening on mortality in men: A randomised controlled trial. Lancet 2002; 360: 1531–1539.
- 3.
Golledge J, Eagle KA. Acute aortic dissection. Lancet 2008; 372: 55–66.
- 4.
Brown LC, Powell JT. Risk factors for aneurysm rupture in patients kept under ultrasound surveillance: UK Small Aneurysm Trial Participants. Ann Surg 1999; 230: 289–296; discussion 296–297.
- 5.
Hagan PG, Nienaber CA, Isselbacher EM, Bruckman D, Karavite DJ, Russman PL, et al. The International Registry of Acute Aortic Dissection (IRAD): New insights into an old disease. JAMA 2000; 283: 897–903.
- 6.
Pape LA, Awais M, Woznicki EM, Suzuki T, Trimarchi S, Evangelista A, et al. Presentation, diagnosis, and outcomes of acute aortic dissection: 17-year trends from the International Registry of Acute Aortic Dissection. J Am Coll Cardiol 2015; 66: 350–358.
- 7.
NCD Risk Factor Collaboration (NCD-RisC). Worldwide trends in blood pressure from 1975 to 2015: A pooled analysis of 1479 population-based measurement studies with 19·1 million participants. Lancet 2017; 389: 37–55.
- 8.
Bossone E, LaBounty TM, Eagle KA. Acute aortic syndromes: Diagnosis and management, an update. Eur Heart J 2018; 39: 739–749d.
- 9.
Pinard A, Jones GT, Milewicz DM. Genetics of thoracic and abdominal aortic diseases. Circ Res 2019; 124: 588–606.
- 10.
Takagi H, Umemoto T, ALICE (All-Literature Investigation of Cardiovascular Evidence) Group. Association of hypertension with abdominal aortic aneurysm expansion. Ann Vasc Surg 2017; 39: 74–89.
- 11.
Kobeissi E, Hibino M, Pan H, Aune D. Blood pressure, hypertension and the risk of abdominal aortic aneurysms: A systematic review and meta-analysis of cohort studies. Eur J Epidemiol 2019; 34: 547–555.
- 12.
Staessen JA, Fagard R, Thijs L, Celis H, Arabidze GG, Birkenhager WH, et al. Randomised double-blind comparison of placebo and active treatment for older patients with isolated systolic hypertension: The Systolic Hypertension in Europe (Syst-Eur) Trial Investigators. Lancet 1997; 350: 757–764.
- 13.
Prevention of stroke by antihypertensive drug treatment in older persons with isolated systolic hypertension. Final results of the Systolic Hypertension in the Elderly Program (SHEP). SHEP Cooperative Research Group. JAMA 1991; 265: 3255–3264.
- 14.
Otaki Y, Watanabe T, Konta T, Watanabe M, Fujimoto S, Sato Y, et al. Effect of hypertension on aortic artery disease-related mortality: 3.8-year nationwide community-based prospective cohort study. Circ J 2018; 82: 2776–2782.
- 15.
Rapsomaniki E, Timmis A, George J, Pujades-Rodriguez M, Shah AD, Denaxas S, et al. Blood pressure and incidence of twelve cardiovascular diseases: Lifetime risks, healthy life-years lost, and age-specific associations in 1·25 million people. Lancet 2014; 383: 1899–1911.
- 16.
Rodin MB, Daviglus ML, Wong GC, Liu K, Garside DB, Greenland P, et al. Middle age cardiovascular risk factors and abdominal aortic aneurysm in older age. Hypertension 2003; 42: 61–68.
- 17.
Strachan DP. Predictors of death from aortic aneurysm among middle-aged men: The Whitehall study. Br J Surg 1991; 78: 401–404.
- 18.
Abbasnezhad A, Falahi E, Gonzalez MJ, Kavehi P, Fouladvand F, Choghakhori R. Effect of different dietary approaches compared with a regular diet on systolic and diastolic blood pressure in patients with type 2 diabetes: A systematic review and meta-analysis. Diabetes Res Clin Pract 2020; 163: 108108.
- 19.
Webb AJS. Progression of arterial stiffness is associated with midlife diastolic blood pressure and transition to late-life hypertensive phenotypes. J Am Heart Assoc 2020; 9: e014547.
- 20.
Smulyan H, Mookherjee S, Safar ME. The two faces of hypertension: Role of aortic stiffness. J Am Soc Hypertens 2016; 10: 175–183.
- 21.
Derubertis BG, Trocciola SM, Ryer EJ, Pieracci FM, McKinsey JF, Faries PL, et al. Abdominal aortic aneurysm in women: Prevalence, risk factors, and implications for screening. J Vasc Surg 2007; 46: 630–635.
- 22.
Reboussin DM, Allen NB, Griswold ME, Guallar E, Hong Y, Lackland DT, et al. Systematic review for the 2017 ACC/AHA/AAPA/ABC/ACPM/AGS/APhA/ASH/ASPC/NMA/PCNA Guideline for the prevention, detection, evaluation, and management of high blood pressure in adults: A report of the American College of Cardiology/American Heart Association Task Force on Clinical Practice Guidelines. J Am Coll Cardiol 2018; 71: 2176–2198.
- 23.
Ihm SH, Bakris G, Sakuma I, Sohn IS, Koh KK. Controversies in the 2017 ACC/AHA Hypertension Guidelines: Who can be eligible for treatments under the new guidelines? Circ J 2019; 83: 504–510.
- 24.
Kamon T, Kaneko H, Itoh H, Kiriyama H, Mizuno Y, Morita H, et al. Gender-specific association between the blood pressure category according to the updated ACC/AHA guidelines for hypertension and cardio-ankle vascular index: A community-based cohort study. J Cardiol 2020; 75: 578–582.
- 25.
Zhou JC, Zhang N, Zhang ZH, Wang TT, Zhu YF, Kang H, et al. Intensive blood pressure control in patients with acute type B aortic dissection (RAID): Study protocol for randomized controlled trial. J Thorac Dis 2017; 9: 1369–1374.
- 26.
Delsart P, Ledieu GJ, Ramdane N, Sobocinski JP, Clough RE, Azzaoui RO, et al. Impact of the management of Type B aortic dissection on the long-term blood pressure. Am J Cardiol 2017; 120: 484–488.
- 27.
Kurihara T, Shimizu-Hirota R, Shimoda M, Adachi T, Shimizu H, Weiss SJ, et al. Neutrophil-derived matrix metalloproteinase 9 triggers acute aortic dissection. Circulation 2012; 126: 3070–3080.
- 28.
Saraff K, Babamusta F, Cassis LA, Daugherty A. Aortic dissection precedes formation of aneurysms and atherosclerosis in angiotensin II-infused, apolipoprotein E-deficient mice. Arterioscler Thromb Vasc Biol 2003; 23: 1621–1626.
- 29.
Liu S, Xie Z, Daugherty A, Cassis LA, Pearson KJ, Gong MC, et al. Mineralocorticoid receptor agonists induce mouse aortic aneurysm formation and rupture in the presence of high salt. Arterioscler Thromb Vasc Biol 2013; 33: 1568–1579.
- 30.
Hackam DG, Thiruchelvam D, Redelmeier DA. Angiotensin-converting enzyme inhibitors and aortic rupture: A population-based case-control study. Lancet 2006; 368: 659–665.
- 31.
Bae EH, Lim SY, Han KD, Oh TR, Choi HS, Kim CS, et al. Association between systolic and diastolic blood pressure variability and the risk of end-stage renal disease. Hypertension 2019; 74: 880–887.
- 32.
Matsushita K, Kwak L, Ballew SH, Grams ME, Selvin E, Folsom AR, et al. Chronic kidney disease measures and the risk of abdominal aortic aneurysm. Atherosclerosis 2018; 279: 107–113.
- 33.
Sampson UK, Norman PE, Fowkes FG, Aboyans V, Song Y, Harrell FE Jr, et al. Estimation of global and regional incidence and prevalence of abdominal aortic aneurysms 1990 to 2010. Glob Heart 2014; 9: 159–170.
- 34.
Sampson UK, Norman PE, Fowkes FG, Aboyans V, Yanna S, Harrell FE Jr, et al. Global and regional burden of aortic dissection and aneurysms: Mortality trends in 21 world regions, 1990 to 2010. Glob Heart 2014; 9: 171–180.e110.

