Abstract
Background:
Patients are prone to permanent pacemaker implantation (PPM) after valve surgery, yet current data on the effects of postoperative PPM are scarce and large-scale studies are lacking. The aim of this study was to determine rates and long-term outcomes of PPM after cardiac valve surgery.
Methods and Results:
A total of 24,014 patients who received valve surgery from 2000 to 2013 were identified from the Taiwan National Health Insurance Research Database. The number of valve surgeries and the proportion of PPM implantations after valve surgery increased (P<0.001). After 1 : 5 propensity score matching, 602 and 3,010 patients were categorized to the PPM and non-PPM groups, respectively. Late outcomes included all-cause mortality, cardiovascular death, sepsis, and readmission due to any cause. The mean follow up was 4.3 years. PPM was associated with a higher all-cause mortality rate (33.6% vs. 29.8%; hazard ratio [HR], 1.14; 95% confidence interval [CI], 0.98–1.32), though not significant at the threshold of P<0.05. PPM was also associated with higher all-cause mortality rates in subgroups that received mitral valve (MV) replacement surgery, combined aortic valve replacement (AVR) with MV surgeries, and combined AVR with tricuspid valve surgeries.
Conclusions:
The PPM rate after valve surgery is increasing, and is associated with short-term adverse effects. Patients with PPM may have a higher long-term mortality rate.
Permanent pacemaker implantation (PPM) is a common complication after valve procedures, and is believed to be associated with injury of the nearby conduction system.1–4
However, few studies have evaluated the epidemiology and long-term effect of PPM in patients after valve surgery; currently, no consensus exists because the available results are controversial.3–5
Transcatheter aortic valve implantation (TAVI), a newly introduced intervention, has been shown to have a high postoperative PPM rate of 6–40%.3
Nonetheless, although TAVI is now being used for low-risk patients, data regarding long-term survival and other adverse effects in patients with PPM after TAVI are not available due to the method’s novelty.
Consequently, we aimed to investigate the effect of PPM on the long-term outcomes in patients after valve surgeries in Taiwan from 2000 to 2013. This population-based study may help to provide an insight into the long-term outcome of PPM after other newly developed valve interventions.
Methods
Data Source
This national population-based cohort study was conducted using data from the Taiwan National Health Insurance Research Database (NHIRD), which is a database derived from the National Health Insurance (NHI) covering 99.6% of the population of Taiwan.6
Data were encrypted in order to protect patients’ privacy. As all personal information in the NHIRD is anonymous, this study did not require full review by the institutional review board of Chang Gung Memorial Hospital. The valve surgery and PPM were covered by NHI, and the PPM is only covered when the pacemaker implantation fits the indication.7–9
Study Population
We defined valve surgery as the aortic valve replacement (AVR), replacement or repair of the mitral valve (MV) or tricuspid valve (TV), or a combination of the above. The clinical occurrence of valve replacement or repair was identified using the
International Classification of Diseases, Ninth Revision, Clinical Modification
(ICD-9-CM) procedure codes, which have been reported in previous NHIRD studies.9,10
A total of 27,675 patients who first received valve surgery between 1 January 2000 and 31 December 2013 were identified. Patients with missing demographics (<0.1%), previously implanted PPM, aged <20 years, and those who died during the admission were excluded. The admission date of the valve surgery was assigned as the index date. The remaining patients were divided into 2 study groups: PPM and non-PPM (Figure 1). Postoperative PPM was defined as a new-onset PPM after valve surgery during the same admission, as identified by Taiwan NHI reimbursement codes for surgery and device/generator.

The included covariates were: age, sex, comorbidities, hospital level of the index surgery, concomitant surgeries, previous valve surgery, and valve locations/types. We utilized the ICD-9-CM diagnostic or procedure codes and the Taiwan NHI reimbursement codes to obtain baseline characteristics and surgical details of the patients based on inpatient claims data. Comorbidities and the Charlson Comorbidity Index (CCI) score were detected using previous inpatient diagnoses back to the year, 1997. The diagnostic codes are provided in
Supplementary Table 1.
The study outcomes included in-hospital outcomes and late outcomes after discharge, which were detected by using ICD-9-CM diagnostic codes or the Taiwan NHI reimbursement codes. Details of the ICD-9-CM diagnostic codes can be found in
Supplementary Table 1. Operation-related complications included: new-onset stroke; cardiogenic shock requiring mechanical circulatory support; re-exploration for bleeding; massive blood transfusion (>10U); de novo dialysis, sepsis, deep wound infection; and prolonged hospital stays (>28 days).
Late outcomes included: all-cause mortality, cardiovascular death, composite outcome (stroke, re-do valve surgery, heart failure and infective endocarditis), sepsis, and readmission due to any cause. Mortality was defined by a withdrawal from the NHI program. Cardiovascular death was defined based on the Standardized Definitions for Cardiovascular and Stroke Endpoint Events in Clinical Trials by the Food and Drug Administration in the United States. The occurrence of stroke and heart failure was defined as a principal diagnosis of admission where the diagnostic codes have been validated in previous NHIRD studies.11–13
Infective endocarditis and sepsis were detected by any inpatient diagnosis. Re-do valve surgery was extracted by using the Taiwan NHI reimbursement codes. Each patient was followed until death or 31 December 2013, whichever came first.
Statistical Analysis
As there were substantial differences in patient characteristics between the PPM and non-PPM groups, which could bias the results, propensity score matching (PSM) was used to reduce selection bias. The propensity score was the predicted probability to be in the PPM group given the values of covariates using logistic regression. The variables selected to calculate the propensity score are listed in
Table 1, where the follow-up year was replaced with the index date (Table 1). Given the large size of the non-PPM group, and to increase the statistical power, we matched each patient in the PPM group with 5 patients in the non-PPM group. The matching was processed using a greedy nearest neighbor algorithm, with a caliper of 0.2-fold the standard deviation of the logit of the propensity score, with random matching order and without replacement. The quality of matching was checked using the absolute value of the standardized difference (STD) between the groups, where a value <0.1 was considered as negligible difference.
Table 1.
Clinical and Surgical Characteristics of Patients Who Received Valve Surgery With and Without Permanent Pacemaker Implantation During Admission
| Variable |
Before matching |
After matching |
PPM
(n=617) |
Non-PPM
(n=23,397) |
STD |
PPM
(n=602) |
Non-PPM
(n=3,010) |
STD |
| Age (years) |
64.2±14.2 |
59.7±14.7 |
0.31 |
64.0±14.1 |
63.7±14.2 |
0.02 |
| Age group (years) |
| <40 |
39 (6.3) |
2,563 (11.0) |
–0.17 |
39 (6.5) |
221 (7.3) |
–0.03 |
| 40–59 |
169 (27.4) |
8,312 (35.5) |
–0.18 |
167 (27.7) |
846 (28.1) |
–0.01 |
| 60–79 |
340 (55.1) |
11,234 (48.0) |
0.14 |
335 (55.6) |
1,633 (54.3) |
0.03 |
| ≥80 |
69 (11.2) |
1,288 (5.5) |
0.21 |
61 (10.1) |
310 (10.3) |
–0.01 |
| Female |
299 (48.5) |
9,747 (41.7) |
0.14 |
290 (48.2) |
1,473 (48.9) |
–0.02 |
| Comorbidities |
| Diabetes mellitus |
142 (23.0) |
4,524 (19.3) |
0.14 |
140 (23.3) |
685 (22.8) |
–0.02 |
| Hypertension |
292 (47.3) |
10,185 (43.5) |
0.08 |
283 (47.0) |
1,422 (47.2) |
<0.01 |
| Heart failure |
242 (39.2) |
8,230 (35.2) |
0.08 |
234 (38.9) |
1,207 (40.1) |
–0.03 |
| Myocardial infarction |
48 (7.8) |
1,399 (6.0) |
0.07 |
45 (7.5) |
229 (7.6) |
–0.01 |
| Stroke |
68 (11.0) |
2,389 (10.2) |
0.03 |
65 (10.8) |
360 (12.0) |
–0.04 |
| Infective endocarditis |
87 (14.1) |
3,225 (13.8) |
0.01 |
81 (13.5) |
429 (14.3) |
–0.02 |
| Rheumatic heart disease |
151 (24.5) |
5,663 (24.2) |
0.01 |
147 (24.4) |
745 (24.8) |
–0.01 |
| Peripheral arterial disease |
17 (2.8) |
657 (2.8) |
<0.01 |
16 (2.7) |
86 (2.9) |
–0.01 |
| Atrial fibrillation |
236 (38.2) |
7,560 (32.3) |
0.12 |
227 (37.7) |
1,180 (39.2) |
–0.03 |
| Pulmonary hypertension |
64 (10.4) |
2,495 (10.7) |
–0.01 |
62 (10.3) |
311 (10.3) |
<0.01 |
| Chronic kidney disease |
96 (15.6) |
2,318 (9.9) |
0.17 |
85 (14.1) |
445 (14.8) |
–0.02 |
| Dialysis |
23 (3.7) |
617 (2.6) |
0.06 |
22 (3.7) |
117 (3.9) |
–0.01 |
| Chronic obstructive pulmonary disease |
52 (8.4) |
2,051 (8.8) |
–0.01 |
51 (8.5) |
255 (8.5) |
<0.01 |
| Liver cirrhosis |
18 (2.9) |
571 (2.4) |
0.03 |
18 (3.0) |
76 (2.5) |
0.03 |
| Coagulopathy |
19 (3.1) |
498 (2.1) |
0.06 |
19 (3.2) |
95 (3.2) |
<0.01 |
| Gastrointestinal bleeding |
115 (18.6) |
3,572 (15.3) |
0.09 |
108 (17.9) |
554 (18.4) |
–0.01 |
| Major bleeding |
53 (8.6) |
1,560 (6.7) |
0.07 |
51 (8.5) |
235 (7.8) |
0.02 |
| Charlson Comorbidity Index score |
2.2±2.1 |
2.0±1.9 |
0.14 |
2.20±2.07 |
2.23±2.10 |
–0.02 |
| Hospital level |
| Medical center (teaching hospital) |
392 (63.5) |
17,750 (75.9) |
–0.27 |
387 (64.3) |
1,977 (65.7) |
–0.03 |
| Regional / district hospital |
225 (36.5) |
5,647 (24.1) |
0.27 |
215 (35.7) |
1,033 (34.3) |
0.03 |
| Concomitant surgery |
| CABG |
129 (20.9) |
4,649 (19.9) |
0.03 |
126 (20.9) |
609 (20.2) |
0.02 |
| Maze |
83 (13.5) |
2,346 (10.0) |
0.11 |
80 (13.3) |
412 (13.7) |
–0.01 |
| Aortic surgery |
17 (2.8) |
1,499 (6.4) |
–0.18 |
17 (2.8) |
79 (2.6) |
0.01 |
| Previous valve surgery |
29 (4.7) |
667 (2.9) |
0.10 |
25 (4.2) |
132 (4.4) |
–0.01 |
| Valve location and type |
| Only AVR |
178 (28.8) |
8,483 (36.3) |
–0.16 |
177 (29.4) |
888 (29.5) |
<0.01 |
| Only MV surgery |
231 (37.4) |
9,639 (41.2) |
–0.08 |
228 (37.9) |
1,099 (36.5) |
0.03 |
| Only TV surgery |
32 (5.2) |
712 (3.0) |
0.11 |
29 (4.8) |
163 (5.4) |
–0.03 |
| MV surgery + TV surgery |
54 (8.8) |
1,689 (7.2) |
0.06 |
53 (8.8) |
272 (9.0) |
–0.01 |
| AVR + MV surgery |
100 (16.2) |
2,278 (9.7) |
0.19 |
94 (15.6) |
488 (16.2) |
–0.02 |
| AVR + TV surgery |
8 (1.3) |
168 (0.7) |
0.06 |
7 (1.2) |
31 (1.0) |
0.01 |
| AVR + MV surgery + TV surgery |
14 (2.3) |
428 (1.8) |
0.03 |
14 (2.3) |
69 (2.3) |
<0.01 |
| Follow-up years |
4.2±3.6 |
5.1±3.9 |
–0.24 |
4.2±3.6 |
4.3±3.6 |
–0.02 |
Data are presented as frequency (percentage) or mean±standard deviation. AVR, aortic valve replacement; CABG, coronary artery bypass; MV, mitral valve; PPM, permanent pacemaker implantation; STD, standardized difference; TV, tricuspid valve.
The trend of receiving PPM after valve surgery across the years was tested by using the Cochrane-Armitage test. The incidences of receiving PPM after valve surgery among different valve locations/types were compared by using pairwise chi-squared tests. In-hospital outcomes between the PPM and non-PPM groups were compared using a generalized estimating equation, in which the robust standard error was estimated to account for the outcome dependency within matched pairs. The link was identity and the distribution was normal for continuous outcomes, whereas the link was logit and the distribution was binomial for binary outcomes. As to the fatal time-to-event outcomes (i.e., all-cause mortality and cardiovascular death), the risks between the groups were compared by using the Cox proportional hazard model. The incidences of non-fatal time-to-event outcomes (e.g., re-do valve surgery) between groups were compared by using the Fine and Gray sub distribution hazard model, which considered all-cause mortality as a competing risk. The study group (PPM vs. non-PPM) was the only explanatory variable in the survival analyses. The within-pair clustering of outcomes after PSM was accounted for by using a robust standard error, known as a marginal model.14
To detect the existence of residual confounding or unmeasured confounders, we selected 3 negative outcomes (falsification endpoints): incident fracture, new-onset malignancy, and influenza.15
Two subgroup analyses were performed. First, subgroup analysis for all-cause mortality was conducted on 8 pre-specified subgroup variables: age, diabetes, infective endocarditis, atrial fibrillation, chronic kidney disease, TV surgery, MV surgery, and AVR surgery. Second, the mortality rates between the PPM and non-PPM groups in each valve location/type were compared by using univariate Cox models. A 2-sided P value <0.05 was considered to be statistically significant and no adjustment of multiple testing (multiplicity) was made in this study. All statistical analyses were performed using SAS version 9.4 (SAS Institute, Cary, NC, USA), including the procedures of ‘psmatch’ for PSM, ‘genomd’ for generalized estimating equation, ‘phreg’ for survival analysis, and the macro of ‘%cif’ for generating cumulative incidence function under the Fine and Gray sub distribution hazard method.
Results
Epidemiology of PPM Implantation After Valve Surgery
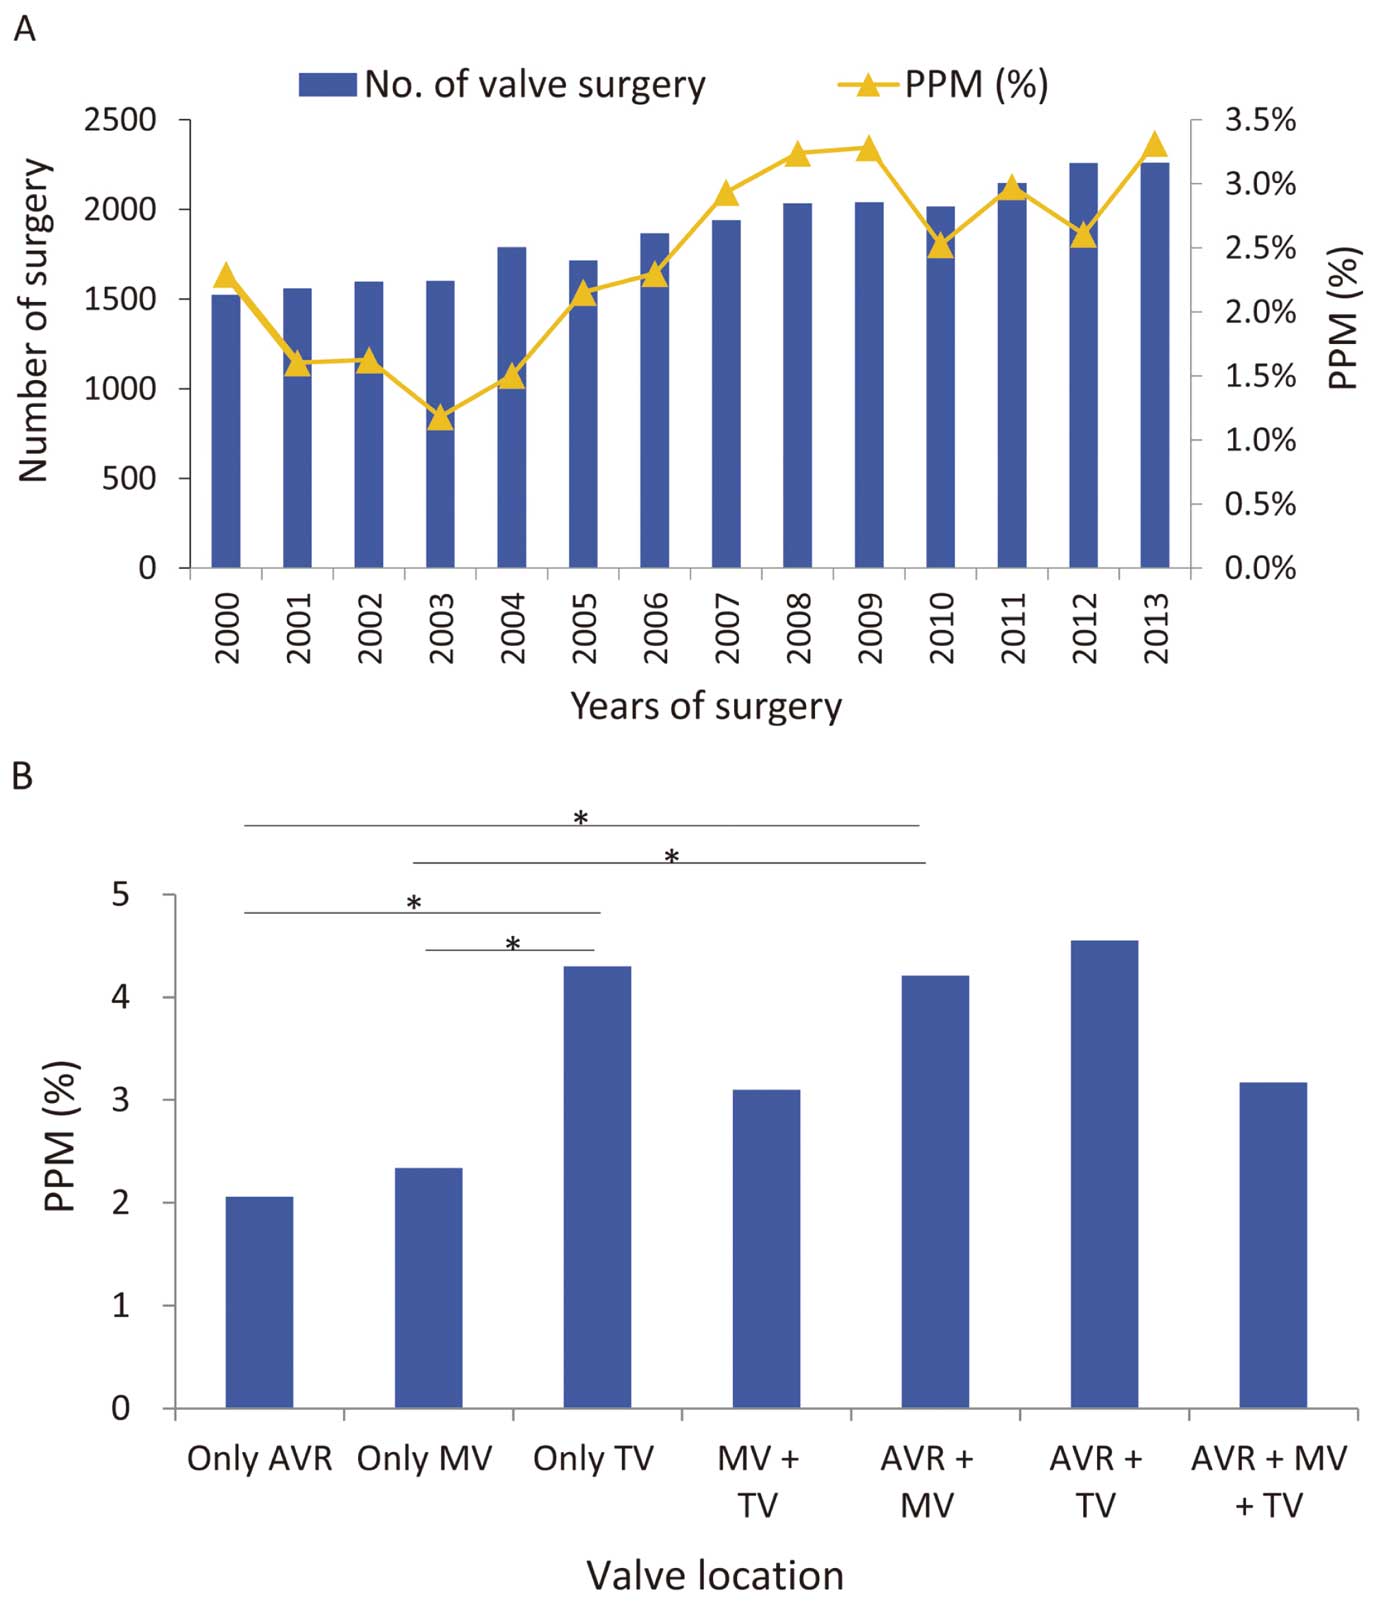
A total of 24,014 patients, including 617 (2.57%) patients receiving PPM and 23,397 patients not receiving PPM after valve surgery, were included in this study (Figure 1). From 2000 to 2013, the number of valve surgeries and the proportion of PPMs after valve surgery increased (P<0.001) (Figure 2A).
Population Characteristics
In the 617 patients in the PPM group, the most common indication was atrioventricular block (n=230, 37.3%), followed by atrial fibrillation (n=158, 25.6%), sick sinus syndrome (n=136, 22%), and others (data not shown).
Before matching, patients in the PPM group were older, more likely to be female, had a higher prevalence of diabetes and chronic kidney disease, had greater CCI scores, were less likely to receive surgery in medical centers, had more concomitant maze surgery but less concomitant aortic surgery, were more likely to receive previous valve surgery, and had a shorter follow-up duration. With regards to valve location and type, patients in the PPM group received less only AVR but received more TV only and more AVR combined with MV surgeries. However, these differences in clinical and surgical characteristics between the 2 groups were minimized after matching (Table 1).
When comparing the incidence of PPM after valve surgery among the different valve locations/types, the proportions of PPM were significantly higher in patients with TV surgery only and AVR combined with MV surgeries than those with AVR only and with MV only surgeries (Figure 2B). In addition, the proportion of PPM was more common in patients who received TV surgeries (3.5%; 108/3,105) than those who did not (2.4%; 509/20,909), with a significant difference (P=0.001, data not shown).
Operation-Related Complications
After matching, patients in the PPM group had a higher risk of massive blood transfusion (>10U) (odds ratio [OR], 1.38; 95% confidence interval [CI], 1.07–1.78), de novo dialysis (OR, 1.44; 95% CI, 1.02–2.03), and prolonged hospital stays (>28 days; OR, 2.19; 95% CI, 1.84–2.60). In addition, patients in the PPM group had a greater in-hospital cost (regression coefficient [B], 18.6 days; 95% CI, 16.2–21.1 days), duration of stay in the ICU (B, 2.60 days; 95% CI, 1.63–3.58 days) and hospital stay (B, 6.81 days; 95% CI, 4.82–8.80 days) (Table 2
and
Supplementary Table 2).
Table 2.
In-Hospital Outcomes and Operation-Related Complications (Those That Are Significant)
| Variable |
PPM
(n=602) |
Non-PPM
(n=3,010) |
OR / B of PPM
(95% CI) |
P value |
| Categorical parameter |
| Massive blood transfusion* |
78 (13.0) |
293 (9.7) |
1.38 (1.07–1.78) |
0.014 |
| De novo dialysis |
44 (7.3) |
156 (5.2) |
1.44 (1.02–2.03) |
0.036 |
| Prolong hospital stays >28 days |
321 (53.3) |
1,033 (34.3) |
2.19 (1.84–2.60) |
<0.001 |
| Continuous parameter |
| ICU duration (days) |
10.3±12.1 |
7.7±10.5 |
2.60 (1.63–3.58) |
<0.001 |
| In-hospital stay (days) |
35.7±23.8 |
28.9±24.3 |
6.81 (4.82–8.80) |
<0.001 |
| In-hospital cost (NTD×104) |
68.5±30.4 |
49.9±27.3 |
18.6 (16.2–21.1) |
<0.001 |
Data are presented as frequency (percentage) or mean±standard deviation. B, regression coefficient; CI, confidence interval; ICU, intensive care unit; NTD, New Taiwan Dollar; OR, odds ratio; PPM, permanent pacemaker implantation. *Packed red blood cell (PRBC) >10U.
Patients in both groups were followed for an average of 4.2 years (standard deviation, 3.6 years). The all-cause mortality rates were 33.6% and 29.8% in the PPM and non-PPM groups, respectively, in which a borderline higher risk was noted in the PPM group (hazard ratio [HR], 1.14; 95% CI, 0.98–1.32) (Figure 3A). However, no significant differences were observed in the risks of other outcomes between the 2 groups (Table 3
and
Supplementary Table 3).

Table 3.
Late Outcomes of Primary Interest After Patient Discharge
| Variable |
PPM
(n=602) |
Non-PPM
(n=3,010) |
HR or SHR of PPM
(95% CI) |
P value |
| All-cause mortality |
202 (33.6) |
898 (29.8) |
1.14 (0.98–1.32) |
0.090 |
| Cardiovascular death |
106 (17.6) |
478 (15.9) |
1.12 (0.90–1.38) |
0.319 |
| Composite outcome |
144 (23.9) |
703 (23.4) |
1.02 (0.85–1.23) |
0.830 |
| Stroke |
61 (10.1) |
336 (11.2) |
0.90 (0.68–1.19) |
0.438 |
| Re-do valve surgery |
14 (2.3) |
80 (2.7) |
0.86 (0.50–1.50) |
0.601 |
| Heart failure |
80 (13.3) |
341 (11.3) |
1.17 (0.92–1.49) |
0.200 |
| Infective endocarditis |
13 (2.2) |
66 (2.2) |
0.98 (0.53–1.78) |
0.934 |
Data are presented as frequency (percentage). CI, confidence interval; HR, hazard ratio; PPM, permanent pacemaker implantation; SHR, subdistribution hazard ratio.
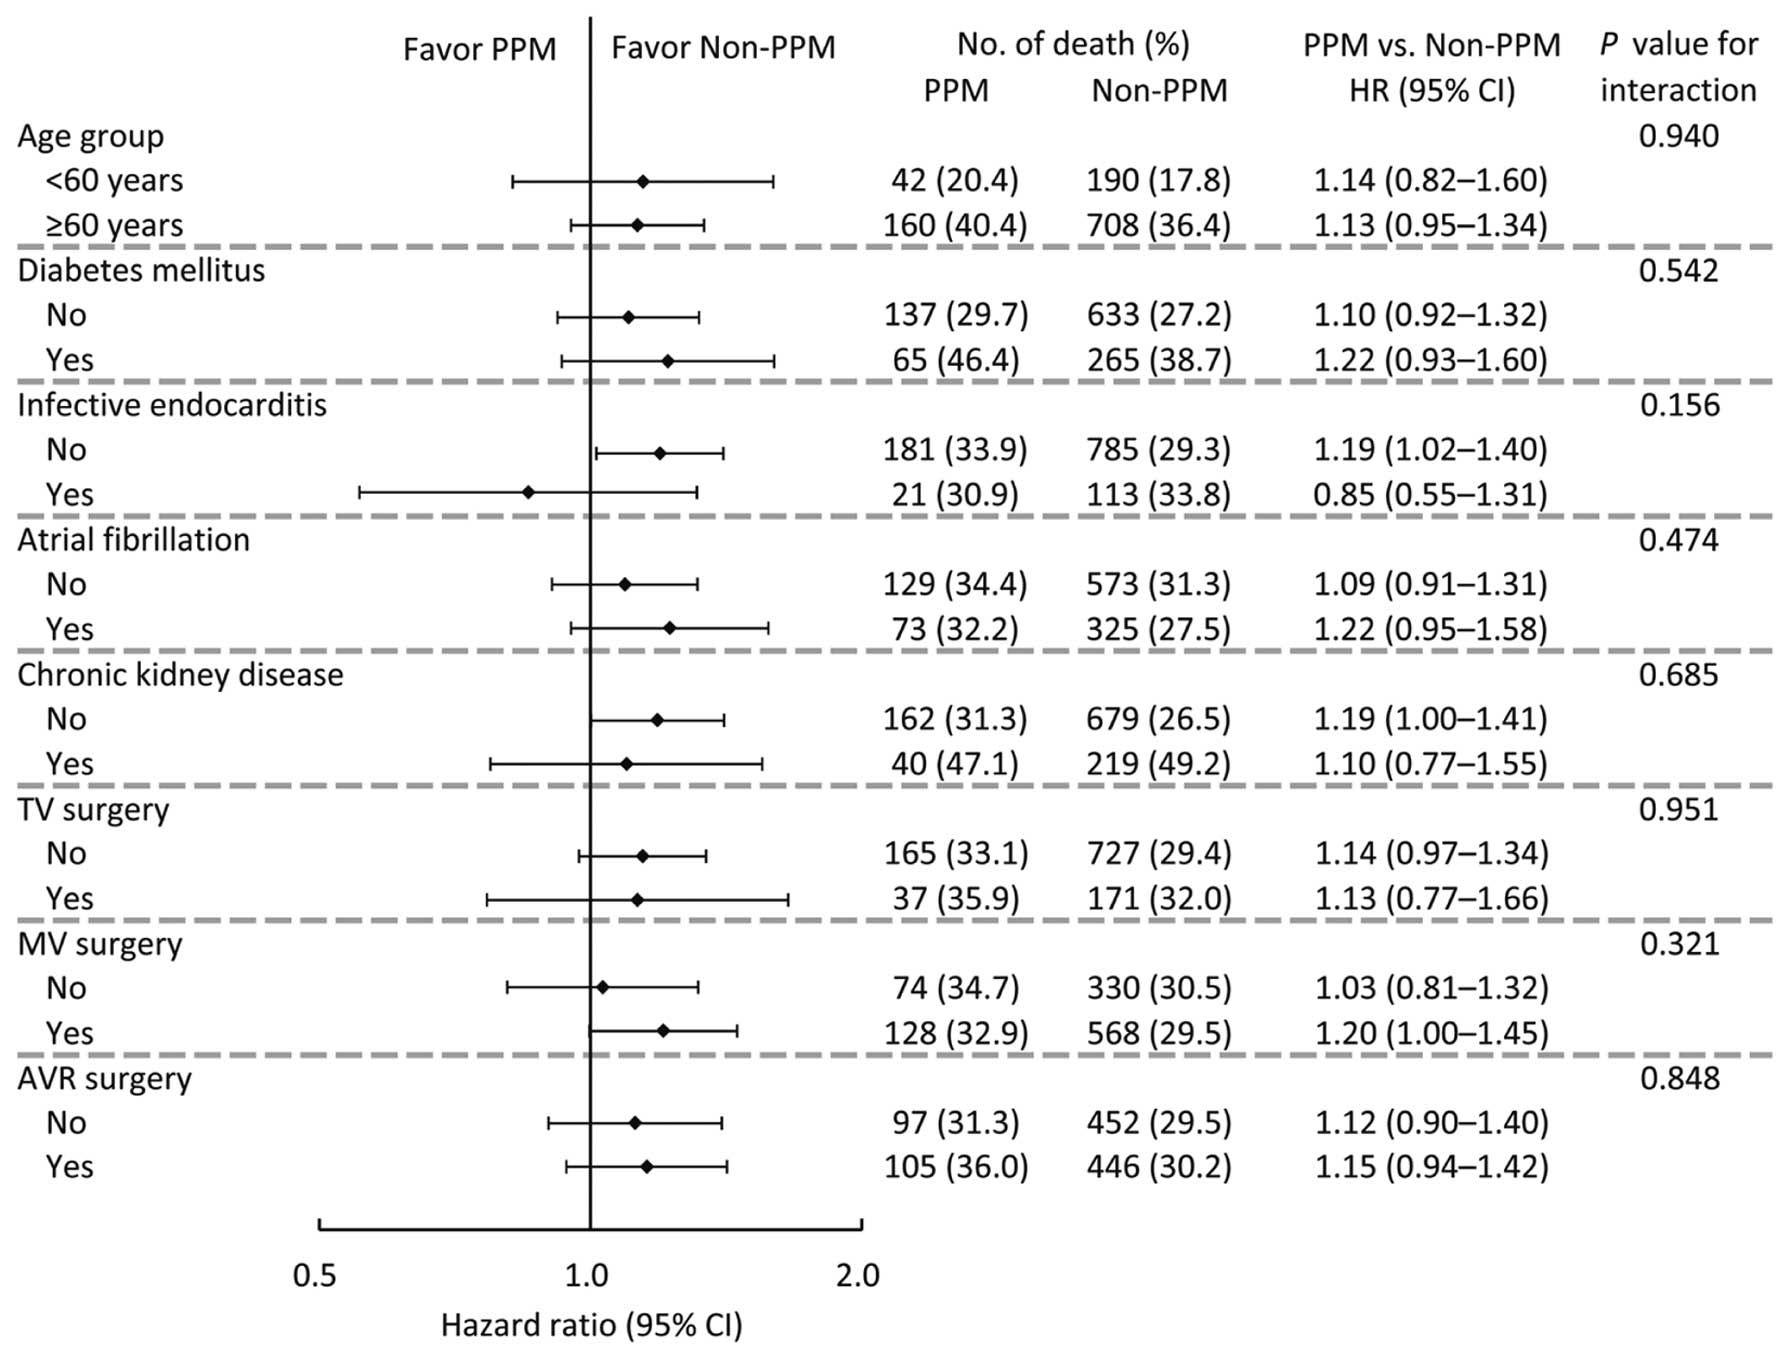
Pre-specified subgroup analysis for all-cause mortality was conducted on 8 subgroup variables: age, diabetes, infective endocarditis, atrial fibrillation, chronic kidney disease, TV surgery, MV surgery and AVR surgery. The results showed that no inconsistent effects were observed across different categories of these subgroup variables (Figure 4). Finally, we compared the mortality rates between the PPM and non-PPM groups in each valve location/type. The results showed that significantly higher risks of mortality associated with PPM were noted in the MVR only surgery, combined AVR with MV surgeries, and combined AVR with TV surgeries (Figure 3B).
Additional Analysis
The risks of incident fracture, new-onset malignancy and influenza in the PPM and non-PPM groups were not statistically significant (Table 3). These results suggested that the problem of residual confounding or unmeasured confounders was unlikely to be serious in this study.
Discussion
Major Finding
In the current nationwide cohort study, we found that the PPM rate after valve surgeries increased over the last 10 years. Furthermore, isolated TV surgery and concomitant AV and MV surgery were found to be associated with a higher PPM rate postoperatively. PPM was also associated with more perioperative complications, such as massive blood transfusion, de novo dialysis, prolonged hospital stays, longer ICU stays, and increased in-hospital cost. With regards to the long-term postoperative outcomes, the PPM group showed a trend toward higher mortality, and further subgroup analysis presented significantly higher mortality in isolated MV surgery, combined AV and MV surgery, and combined AV and TV surgery.
Rising Trend of Postoperative PPM Rate
One possible explanation for our data demonstrating an increased postoperative PPM rate might be the known association between TV surgery and high PPM rate;1,4,16
thus, the rising trend of TV surgery might contribute to this trend. One study using The Society of Thoracic Surgeons (STS) national database also demonstrated a significant trend of increasing TV surgery in North America from 2000 to 2010.17
Moreover, a more aggressive attitude toward handling or preventing tricuspid dysfunction is now suggested in patients undergoing multiple valve surgeries, which is also a known cause of rising TV operations.18
In addition, disease severity, medical comorbidities, and the complexity of procedures increase in the current aging population; together, these are likely to increase PPM rate. Finally, as a consequence of advanced technology, clinicians gradually gained both willingness and certainty of implanting PPM in patients.
PPM Rate Comparison Across Different Valve Surgery Groups
A difference in PPM rate between valve surgery types was widely reported; in our data, isolated TV surgery had a higher PPM rate than other single valve surgeries, which is in accordance with many previous studies that showed that TV surgery or TV-involved multivalve surgery has a higher PPM rate than others.1,4,16
One commonly held inference of this finding is due to the structural proximity of the TV and conduction system. With regards to double valve surgery, Leyva et al4
reported that concomitant AV surgery and MV surgery had a higher incidence of post-operative PPM than single AV or MV surgery (HR 1.52; 95% CI 1.40–1.65; P<0.001; using AVR as a reference). The last group is the triple valve surgery group, who are reported to have a higher PPM rate than single or double valve surgeries;4
nonetheless, our result did not agree with such a conclusion. The difference between the studies is probably due to differences in the inclusion criteria and population heterogeneity. However, neither of the studies have sufficient triple valve surgery cases to reach statistical significance.
Short-Term Outcomes
As might have been expected, we found that PPM was associated with a number of short-term morbidities such as prolonged hospital stays, longer ICU stays, and increased in-hospital cost, which is in agreement with previous reports.18,19
Among all the morbidities reported in the PPM group after valve surgery, kidney-related disorder is noted in most papers (termed as de novo dialysis in our study). One possible explanation for this finding is postoperative unstable hemodynamics due to conduction block.
Long-Term Outcomes
After valve surgery, a borderline higher mortality was noted in the PPM group patients in our study, which, to our knowledge, has not been previously reported.
As for subgroup analysis, 2 studies3,5
proposed PPM to be associated with a higher long-term mortality rate after AVR, whereas Bagur et al reported that in an elderly group,2
no difference was observed; this is in agreement with our study. Similarly, in terms of TV surgery, 2 studies1,20
showed the opposite result for long-term mortality; however, our study shows no significant mortality difference in isolated TV surgery, and also demonstrated that TV surgery is not a predictor for a higher mortality rate in the PPM group. Furthermore, a significantly higher mortality rate in PPM patients after isolated MV surgery and concomitant AV and MV surgery was noted, both of which were not reported previously.
Clinical Application and Suggestions
As TAVI is applied more widely, the importance of clarifying the PPM effect, a well-known complication of TAVI, on the postoperative outcome is warranted. Our large national cohort provides evidence that PPM is associated with poor short-term and long-term outcomes after valve surgeries, and also demonstrated a different mortality effect of PPM in varied surgery type subgroups. Thus, we suggest that because PPM may cause a potentially hazardous effect on patients after valve surgery, the evaluation and selection of therapies with different PPM rates should be considered. Furthermore, these results also guarantee the necessity of predictors of postoperative PPM, which many previous studies have reported.
Several factors play a role in the adverse effect of PPM on patients; these include its transvalvular property (which might lead to subsequent tricuspid regurgitation), increased possibility of infection, and pacing-induced heart failure. Therefore, further studies regarding careful evaluation of subsequent TV dysfunction, selection of lead type (transvalvular vs. non-transvalvular), and the choice between multiple or single valve operation are warranted in patients with PPM after valve operation, especially in future transcatheter therapies.
Study Limitations
Several limitations exist in our current national study. First, the NHI database limits us from accessing some important data, such as pre-existing conduction disorder, pre-existing valve disorder, types of pacing lead, and types of prosthetic valve, all of which were reported to be associated with the post-operative PPM rate. Second, details related to disease severity such as imaging and electrophysiological studies are lacking. Third, not only is the sample size not large enough, but the follow-up time is not long enough to show the difference statistically. However, to the best of our knowledge, our study involves the largest number of patients on this topic. Fourth, despite the correction of confounders by PSM, we were unable to determine the causation from our data due to the fact that bias caused by other potential confounders might not be eliminated. However, valve surgeries can be reimbursed by NHI, which cover almost 99% of the population in Taiwan; thus, we may exclude the potential selection bias for patients with different economic status. Moreover, national regulation involving a thorough examination of laboratory data, imaging data, and medical records also contributes to the stable and strong quality of the data in the database.
Conclusions
The PPM rate after valve surgery is rising, and PPM may result in both short-term and long-term adverse effects in patients after valve surgery. Given that different valve surgery types are associated with different long-term mortalities, the importance of postoperative PPM should be considered in future transcatheter valve therapy studies.
Acknowledgments
This study was based on data from the NHIRD provided by the NHI administration, Ministry of Health and Welfare of Taiwan, and managed by the National Health Research Institutes of Taiwan. However, the interpretation and conclusions contained in this paper do not represent those of the NHI administration, Ministry of Health and Welfare of Taiwan, or the National Health Research Institutes of Taiwan. The authors acknowledge the support of the Maintenance Project of the Center for Big Data Analytics and Statistics (Grant CLRPG3D0045) at Chang Gung Memorial Hospital for statistical consultation and data analysis. The authors also thank Alfred Hsing-Fen Lin and Zoe Ya-Jhu Syu for their assistance with the statistical analysis.
Sources of Funding
This work was supported by a grant from Chang Gung Memorial Hospital, Taiwan (CMRPG3H1511, BMRPD95 (S.-W.C.), CORPG3J0031), and the Ministry of Science and Technology grant (Most 108-2314-B-182A-141 (S.-W.C.)).
Disclosures
The authors declare no conflicts of interest.
Supplementary Files
Please find supplementary file(s);
http://dx.doi.org/10.1253/circj.CJ-20-0905
References
- 1.
Jokinen JJ, Turpeinen AK, Pitkanen O, Hippelainen MJ, Hartikainen JE. Pacemaker therapy after tricuspid valve operations: Implications on mortality, morbidity, and quality of life. Ann Thorac Surg 2009; 87: 1806–1814.
- 2.
Bagur R, Manazzoni JM, Dumont E, Doyle D, Perron J, Dagenais F, et al. Permanent pacemaker implantation following isolated aortic valve replacement in a large cohort of elderly patients with severe aortic stenosis. Heart 2011; 97: 1687–1694.
- 3.
Mehaffey JH, Haywood NS, Hawkins RB, Kern JA, Teman NR, Kron IL, et al. Need for permanent pacemaker after surgical aortic valve replacement reduces long-term survival. Ann Thorac Surg 2018; 106: 460–465.
- 4.
Leyva F, Qiu T, McNulty D, Evison F, Marshall H, Gasparini M. Long-term requirement for pacemaker implantation after cardiac valve replacement surgery. Heart Rhythm 2017; 14: 529–534.
- 5.
Greason KL, Lahr BD, Stulak JM, Cha YM, Rea RF, Schaff HV, et al. Long-term mortality effect of early pacemaker implantation after surgical aortic valve replacement. Ann Thorac Surg 2017; 104: 1259–1264.
- 6.
Lin LY, Warren-Gash C, Smeeth L, Chen PC. Data resource profile: The National Health Insurance Research Database (NHIRD). Epidemiol health 2018; 40: e2018062.
- 7.
Chen SW, Chang CH, Lin YS, Wu VC, Chen DY, Tsai FC, et al. Effect of dialysis dependence and duration on post-coronary artery bypass grafting outcomes in patients with chronic kidney disease: A nationwide cohort study in Asia. Int J Cardiol 2016; 223: 65–71.
- 8.
Chen SW, Tsai FC, Lin YS, Chang CH, Chen DY, Chou AH, et al. Long-term outcomes of extracorporeal membrane oxygenation support for postcardiotomy shock. J Thorac Cardiovasc Surg 2017; 154: 469–477.e462.
- 9.
Chen SW, Wu VC, Lin YS, Chen CC, Chen DY, Chang CH, et al. Propensity score matched analysis of mechanical vs. bioprosthetic valve replacement in patients with previous stroke. Circ J 2018; 82: 2041–2048.
- 10.
Lee HA, Cheng YT, Wu VC, Chou AH, Chu PH, Tsai FC, et al. Nationwide cohort study of mitral valve repair versus replacement for infective endocarditis. J Thorac Cardiovasc Surg 2018; 156: 1473–1483.e1472.
- 11.
Hsieh CY, Chen CH, Li CY, Lai ML. Validating the diagnosis of acute ischemic stroke in a National Health Insurance claims database. J Formos Med Assoc 2015; 114: 254–259.
- 12.
Cheng CL, Kao YH, Lin SJ, Lee CH, Lai ML. Validation of the National Health Insurance Research Database with ischemic stroke cases in Taiwan. Pharmacoepidemiol Drug Saf 2011; 20: 236–242.
- 13.
Cheng CL, Chien HC, Lee CH, Lin SJ, Yang YH. Validity of in-hospital mortality data among patients with acute myocardial infarction or stroke in National Health Insurance Research Database in Taiwan. Int J Cardiol 2015; 201: 96–101.
- 14.
Austin PC, Fine JP. Propensity-score matching with competing risks in survival analysis. Stat Med 2019; 38: 751–777.
- 15.
Lipsitch M, Tchetgen Tchetgen E, Cohen T. Negative controls: A tool for detecting confounding and bias in observational studies. Epidemiology 2010; 21: 383–388.
- 16.
Koplan BA, Stevenson WG, Epstein LM, Aranki SF, Maisel WH. Development and validation of a simple risk score to predict the need for permanent pacing after cardiac valve surgery. J Am Coll Cardiol 2003; 41: 795–801.
- 17.
Kilic A, Saha-Chaudhuri P, Rankin JS, Conte JV. Trends and outcomes of tricuspid valve surgery in North America: An analysis of more than 50,000 patients from The Society of Thoracic Surgeons Database. Ann Thorac Surg 2013; 96: 1546–1552.
- 18.
Martins RP, Galand V, Leclercq C, Daubert JC. Cardiac electronic implantable devices after tricuspid valve surgery [Review]. Heart Rhythm 2018; 15: 1081–1088.
- 19.
Delling FN, Hassan ZK, Piatkowski G, Tsao CW, Rajabali A, Markson LJ, et al. Tricuspid regurgitation and mortality in patients with transvenous permanent pacemaker leads. Am J Cardiol 2016; 117: 988–992.
- 20.
Mazine A, Bouchard D, Moss E, Marquis-Gravel G, Perrault LP, Demers P, et al. Transvalvular pacemaker leads increase the recurrence of regurgitation after tricuspid valve repair. Ann Thorac Surg 2013; 96: 816–822.