Abstract
Background: Omega-3 fatty acids have been proposed to be useful in the prevention of cardiac events. High-risk plaque (HRP) and plaque progression on serial coronary computed tomography angiography (CTA) have been suggested to be the predecessor of acute coronary syndrome (ACS). The purpose of this study was to investigate whether addition of omega-3 fatty acids to statin therapy for secondary prevention would lead to change in plaque characteristics detected by using serial CTA.
Methods and Results: This study enrolled 210 patients with ACS: no eicosapentaenoic acid (EPA)/ docosahexaenoic acid (DHA; EPA/DHA), low-dose EPA+DHA, high-dose EPA+DHA, and high-dose EPA alone. HRP was significantly more frequent in patients with plaque progression (P=0.0001). There was a significant interaction between plaque progression and EPA dose regardless of the DHA dose; 20.3% in EPA-none (no EPA/DHA), 15.7% in EPA-low (low-dose EPA+DHA), and 5.6% in EPA-high (high-dose EPA+DHA and high-dose EPA alone). On multivariate logistic regression analysis, HRP (OR 6.44, P<0.0001), EPA-high (OR 0.13, P=0.0004), and Rosvastatin (OR 0.24, P=0.0079) were the independent predictors for plaque progression. In quantitative analyses (n=563 plaques), the interval change of low attenuation plaque (LAP) volume was significantly different based on EPA dose; LAP was significantly increased in the EPA-none group and significantly decreased in the EPA-high group.
Conclusions: In patients with ACS, addition of high-dose EPA (EPA-high) to statin therapy, compared to statin therapy without EPA, was associated with a lower rate of plaque progression.
Statin therapy is associated with reduced likelihood of major adverse cardiac events both in primary and secondary prevention trials.1–4 Although the improvement in event-free survival is substantial, the residual risk of coronary events has also attracted significant attention.5 Maximization of statin dose, and addition of ezetimibe, protein convertase subtilisin/kexin type 9 (PCSK9) inhibitors, and anti-inflammatory agents such as canakinumab6 to the statin regimen has been proposed.7–9 Recently, omega-3 polyunsaturated fatty acid supplementation has been proposed to be useful for the prevention of cardiac events.10–12 Unlike the well-characterized impact of lipid-lowering therapy on plaque morphology, the influence of polyunsaturated fatty acids on lesion pathology is not well understood.
Editorial p 843
Coronary computed tomography angiography (CTA), in addition to identifying luminal obstruction, is able to non-invasively characterize plaque morphology and define physiological significance of the stenotic lesions. CTA-verified high-risk plaque (HRP) demonstrates 2 very important attributes; positive vascular remodeling (PR) at the lesion site and low attenuation plaque (LAP) representative of a large necrotic core.13,14 Serial angiograms allow assessment of interval change in the plaque volume (PV).14,15 Plaque progression on serial CTA is suggested to be the predecessor of acute coronary events. In contrast, restriction of plaque progression or regression has been suggested to be a desirable preventive strategy.16
The purpose of this study was to investigate, using serial CTA studies, whether addition of omega-3 fatty acids to the statin therapy for secondary prevention would lead to change in plaque morphology.
Methods
Study Population
We screened patients who were admitted to Fujita Health University Hospital for acute coronary syndrome (ACS) between 2013 and 2019 (Figure 1) and underwent serial CTA within 1 month after ACS (CTA-1) and within 24 months after CTA-1 (CTA-2). Patients on fatty acid supplements at admission, those who had post coronary artery bypass grafting, and those who were aged <20 years were not included. Patients who did not receive statin treatment during follow up were not included in this study. Patients were classified based on eicosapentaenoic acid (EPA) and docosahexaenoic acid (DHA) dose. Laboratory data (lipid profile, hemoglobin A1c (HbA1c), high-sensitive C-reactive protein (hsCRP), arachidonic acid (AA), EPA, DHA, EPA+DHA, EPA/AA ratio, DHA/AA ratio, and EPA+DHA/AA ratio) were obtained at admission (baseline) and at CTA-2; hsCRP for baseline was obtained at 1 month. Information about past medical history was obtained, and categorical risk factor assessment was performed, including hypertension, dyslipidemia, diabetes mellitus, smoking, and obesity. Patients were considered hypertensive when systolic and diastolic blood pressures were ≥140/90 mmHg or they were already being treated with antihypertensive agents. Based on the guidelines by the Japan Atherosclerosis Society, dyslipidemia was diagnosed when the low-density lipoprotein cholesterol (LDL-C) level was ≥140 mg/dL, the triglycerides level was ≥150 mg/dL, or if the patient was already receiving statin or fibrate therapy. Diabetes was reported as a fasting plasma glucose concentration ≥126 mg/dL and HbA1c ≥6.5%, or when the patient was receiving current treatment with hypoglycemic agents. Smoking was accepted as a self-reported history. The institutional ethics committee approved the study. All procedures followed the Declaration of Helsinki.

We used the 320-slice CT (Aquilion ONE; Toshiba Medical Systems, Japan). Before imaging, patients without contraindications received oral metoprolol and/or intravenous landiolol if the heart rate was >65 beats/min. Whenever possible, 0.4 mg sublingual nitroglycerin was administered 3–5 min before image acquisition. Coronary artery calcium score (CACS) was obtained at 120 kV, 150 mA, and 3 mm thickness to calculate the Agatston score.17 For coronary CTA, tube voltage was the same 120 kV, but the maximal tube current was set at 300–580 mA depending on body weight; 245 mg iodine/kg of contrast medium was injected. An axial scan was performed with a prospective gated scan in 1 heart beat at a heart rate of <65 beats/min for half reconstruction and in 2–3 heart beats with a heart rate ≥65 beats/min for segment reconstruction. The raw data of the CT scans were reconstructed using algorithms optimized for ECG-gated half or segment reconstruction. The reconstructed image data were transferred to a computer workstation for post-processing (ZIOSTATION System 1000; Amin/ZIO, Japan).
CTA Image Semi-Quantitative Analysis
CTA images were evaluated in axial, coronal, sagittal, cross-sectional, and curved multiplanar reformation views. Two cardiologists blinded to the patients’ clinical information interpreted the CTA images. The lesions treated previously with percutaneous coronary intervention (PCI) or scheduled PCI lesions were excluded from the assessment. Coronary arteries were evaluated in 15 segments based on the American Heart Association classification, and the extent of stenosis was evaluated in coronary arteries with a diameter of ≥2 mm. Stenosis was visually graded from 0 to 5 (0: absence of plaque and no luminal stenosis, 1: <25% stenosis, 2: 25–49% stenosis, 3: 50–69% stenosis, 4: 70–99% stenosis, 5: complete occlusion).18 Manual inspection, both in cross-section and longitudinal reconstruction, was used for defining the coronary artery remodeling index (RI: lesion diameter/reference diameter). HRP was defined as plaque with PR (RI ≥1.1) and/or LAP (≤30 HU) in more than 1 pixel.19,20
Quantitative Plaque Analysis
Quantitative plaque measurements were performed using semiautomated plaque analysis software (QAngioCT Research Edition version 2.1.9.1; Medis Medical Imaging Systems, Leiden, the Netherlands) with appropriate manual correction.21 Briefly, for each vessel with a diameter ≥2 mm, quantitative analysis was performed on every 1-mm cross-section to measure PV and plaque composition using pre-defined Hounsfield unit thresholds: LAP (−30 to +30 HU), fibro-fatty (30 to 130 HU), fibrous (131 to 350 HU), and calcified plaque (≥350 HU).18,22 Total non-calcified plaque (NCP) was calculated as the sum of LAP, fibro-fatty plaque and fibrous plaque. Stented lesions at CTA-2, including 10-mm proximal and distal to the stents, were excluded from the analysis. Lesions with the events between CTA-1 and CTA-2 were also excluded from the analysis.
For lesion-based analysis, every plaque was selected out of the entire heart quantitative analysis, and the PV in the same length between CTA-1 and CT-2, as well as the remodeling index in the cross-sectional area, was compared. Lesions at CTA-1 and CTA-2 were synchronized by using the branch points as the landmarks.
Clinical Endpoint
The primary endpoint was the incidence of plaque progression on serial CTA study. Plaque progression was defined as either an increase in stenosis by at least 1 grade, or an increase in RI ratio from CTA-1 to CTA-2. Patients who had cardiac events including cardiac death, a non-fatal coronary event, or an unplanned coronary artery revascularization before CTA-2 were included as having plaque progression. The secondary endpoint was quantitative change in different plaque types. The relationship between plaque change and the type and dose of omega-3 fatty acids was analyzed.
Statistical Analysis
JMP software (version 11; SAS Institute, Cary, NC, USA) was used for statistical analyses. Categorical variables are presented as frequencies (percentages) and compared using the chi-squared test or Fisher’s exact test depending on the category cell size. The Shapiro-Wilk test was used to assess the normality of continuous data. All continuous measurements are expressed as mean±SD for normally distributed variables or median and interquartile range (IQR, 25th percentile–75th percentile) for asymmetric data and were compared by using the Student’s unpaired t-test and the Wilcoxon rank-sum test, respectively. To compare more than 3 groups, ANOVA and the Kruskal-Wallis test were used for normally distributed variables and asymmetric data, respectively. For multiple comparisons, Bonferroni correction for categorial variables, the Tukey-Kramer method for normally distributed data, and the Steel-Dwass method for asymmetric continuous data were used. To compare data between baseline and CTA-2, a paired t-test for normally distributed variables and Wilcoxon signed-rank test for asymmetric data were used. For quantitative plaque analysis, PV between CTA-1 and CTA-2 were compared with the Wilcoxon signed-rank test for each group. Interval change of PV was compared with the Kruskal-Wallis test between groups and the Steel-Dwass method for multiple comparisons. The effect of the variables on plaque progression was evaluated using the univariable logistic regression model. Age, male sex, and variates that showed P values <0.05 in the univariable analysis were then included in the multivariate logistic regression analysis. Results were reported as odds ratios (OR) with 95% confidence intervals (CI).
Results
Patient Characteristics
There were 2,243 patients who were admitted to our institution due to ACS from 2013 to 2019. In this study, 210 patients were enrolled. The culprit lesions were revascularized (72 right coronary arteries (34.3%), 2 left main trunks (1.0%), 99 left anterior descending arteries (47.1%), 33 left circumflex (15.7%)), except for 4 patients presenting with ACS due to vasospasm (1.9%). Of the 210 patients (median age, 68 years; men, 81%) enrolled in the study, 141 patients were on EPA and/or DHA treatment after ACS; 69 patients treated only with statin therapy and no fatty acid supplement added (no EPA/DHA), 51 were on low-dose EPA+DHA (930 mg+750 mg), 20 were on high-dose EPA+DHA (1,860 mg+1,500 mg), and 70 were on high-dose EPA alone (EPA 1,800 mg). The types and dose of omega-3 fatty acids were determined by the attending physician. There was no significant difference in patient characteristics among the 4 treatment groups at baseline (Table 1). Previously known coronary artery disease (CAD) and myocardial infarction (MI) were present in 26 (12%) and 20 (10%) patients, respectively.
Table 1. Patient Characteristics Based on the Dose of Omega-3 Fatty Acids
| |
All patients
(n=210) |
Omega-3 fatty acids |
No EPA/DHA
(n=69) |
Low-dose
EPA+DHA
(n=51) |
High-dose
EPA+DHA
(n=20) |
High-dose
EPA alone
(n=70) |
P value |
| Baseline characteristics |
| Age (years), median (IQR) |
68 (59–74) |
69 (62–75) |
68 (57–71) |
69 (58–74) |
65 (58–74) |
0.2253 |
| Male, n (%) |
169 (80.5) |
58 (84.1) |
40 (78.4) |
16 (80.0) |
55 (78.6) |
0.8342 |
| BMI (kg/m2), median (IQR) |
23 (21–25) |
23 (21–25) |
23 (21–25) |
22 (21–23) |
23 (22–25) |
0.2828 |
| Hypertension, n (%) |
128 (61.0) |
44 (63.8) |
27 (52.9) |
12 (60.0) |
45 (64.3) |
0.5851 |
| Dyslipidemia, n (%) |
153 (72.9) |
47 (68.1) |
38 (74.5) |
15 (75.0) |
53 (75.7) |
0.7554 |
| Diabetes mellitus, n (%) |
68 (32.4) |
26 (37.7) |
17 (33.3) |
3 (15.0) |
22 (31.4) |
0.4413 |
| Current smoking, n (%) |
74 (35.2) |
21 (30.4) |
20 (39.2) |
7 (35.0) |
26 (37.1) |
0.7619 |
| Past CAD, n (%) |
26 (12.4) |
7 (10.1) |
5 (9.8) |
4 (20.0) |
10 (14.3) |
0.5861 |
| OMI, n (%) |
20 (9.5) |
5 (7.3) |
4 (7.8) |
4 (20.0) |
7 (10.0) |
0.3693 |
| Statin treatment |
| Statin drug |
|
|
|
|
|
0.0005*,†,¶,** |
| Atorvastatin, n (%) |
16 (7.6) |
6 (8.7) |
6 (11.8) |
2 (10) |
2 (2.9) |
|
| Pitavastatin, n (%) |
111 (52.9) |
27 (39.1) |
33 (64.7) |
5 (25) |
46 (65.7) |
|
| Rosuvastatin, n (%) |
83 (39.5) |
36 (52.2) |
12 (23.5) |
13 (65) |
22 (23.5) |
|
| Standard dose of statin, n (%) |
183 (87.1) |
59 (85.5) |
46 (90.2) |
15 (75.0) |
63 (90.0) |
0.3462 |
| CT findings |
| CACS (IQR) |
126 (35–358) |
172 (68–478) |
127 (18–443) |
313 (69–676) |
106 (33–302) |
0.1968 |
| HRP on CTA-1, n (%) |
72 (34.3) |
22 (31.9) |
19 (37.3) |
7 (35.0) |
24 (34.3) |
0.9442 |
| HRP on CTA-2, n (%) |
73 (34.8) |
23 (33.3) |
19 (37.3) |
7 (35.0) |
24 (34.3) |
0.9762 |
*No EPA vs. high-dose EPA alone, P<0.05. †No EPA vs. low-dose EPA, P<0.05. ¶High-dose EPA alone vs. high-dose EPA+DHA, P<0.05. **Low-dose EPA+DHA vs. high-dose EPA+DHA, P<0.05. BMI, body mass index; CACS, coronary artery calcium score; CAD, coronary artery disease; CTA, computed tomography angiography; DHA, docosahexaenoic acid; EPA, eicosapentaenoic acid; HRP, high-risk plaque; IQR, interquartile range; OMI, old myocardial infarction.
Fifty-seven (27%) patients were on statin treatment before the index admission. All patients were being treated with statins during follow up; 16 were on Atorvastatin (7.6%), 111 were on Pitavastatin (52.9%), and 83 were on Rosuvastatin (39.5%). There were significant differences in statin drug use between groups (P=0.0005). Statin dose was not significantly different between groups (standard dose: 85.5 vs. 90.2 vs. 75.0% vs. 90.0%, P=0.3462).
Median CACS was 126 (IQR: 35–358), and non-culprit lesion HRP characteristics on CTA were observed in 72 (34%) patients on CTA-1 and 73 (35%) patients on CTA-2.
There was no significant differences in baseline laboratory data between the 4 groups (Table 2). LDL-C at follow up was significantly different between groups (P=0.0349); the high-dose EPA+DHA group had a significantly lower value compared with the low-dose EPA+DHA group (73 (65–103) vs. 86 (77–100), P<0.05).
Table 2. Laboratory Findings Based on the Dose of Omega-3 Fatty Acids
| |
All patients
(n=210) |
Type of omega-3 fatty acids |
No EPA/DHA
(n=69) |
Low-dose
EPA+DHA
(n=51) |
High-dose
EPA+DHA
(n=20) |
High-dose
EPA alone
(n=70) |
P value |
| TG (mg/dL), median (IQR) |
| Baseline |
114 (63–159) |
83 (55–144) |
116 (67–174) |
118 (87–185) |
118 (87–185) |
0.1175 |
| Follow up |
110 (84–157) |
110 (78–161) |
113 (89–140) |
103 (84–165) |
103 (84–165) |
0.9325 |
| TC (mg/dL), median (IQR) |
| Baseline |
192 (163– 213) |
195 (162–217) |
193 (162–218) |
184 (162–212) |
184 (162–212) |
0.7383 |
| Follow up |
154 (137–167) |
156 (135–166) |
159 (145–173) |
148 (130–165) |
148 (130–165) |
0.0983 |
| HDL-C (mg/dL), median (IQR) |
| Baseline |
47 (41–58) |
46 (40–58) |
48 (41–60) |
47 (41–57) |
47 (41–57) |
0.8831 |
| Follow up |
50 (44–60) |
50 (43–60) |
52 (43–63) |
48 (44–55) |
48 (44–55) |
0.5861 |
| LDL-C (mg/dL), median (IQR) |
| Baseline |
123 (103–148) |
122 (99–152) |
126 (110–151) |
122 (100–144) |
122 (100–144) |
0.8509 |
| Follow up |
80 (68–94) |
80 (68–93) |
86 (77–100) |
77 (66–92) |
77 (66–92) |
0.0349** |
| AA (μg/mL), median (IQR) |
| Baseline |
173 (144–202) |
172 (137–202) |
180 (158–201) |
173 (137–202) |
173 (137–202) |
0.5344 |
| Follow up |
166 (143–194) |
178 (154–216) |
169 (146–190) |
152 (125–178) |
152 (125–178) |
0.0002* |
| EPA (μg/mL), median (IQR) |
| Baseline |
53 (35–75.8) |
49 (33–74) |
54 (37–70) |
51 (35–76) |
51 (35–76) |
0.4978 |
| Follow up |
122 (65–177) |
49 (35–74) |
119 (94–144) |
177 (125–207) |
177 (125–207) |
<0.0001*,†,‡,§,** |
| DHA (μg/mL), median (IQR) |
| Baseline |
118 (98–147) |
121 (101–157) |
107 (98–145) |
118 (96–144) |
118 (96–144) |
0.3024 |
| Follow up |
116 (93–148) |
114 (82–139) |
140 (110–161) |
103 (84–126) |
103 (84–126) |
<0.0001†,‡,§,¶ |
| EPA+DHA (μg/mL), median (IQR) |
| Baseline |
176 (138–229) |
176 (141–235) |
161 (137–229) |
176 (134–222) |
176 (134–222) |
0.4269 |
| Follow up |
252 (181–303) |
159 (120–223) |
263 (201–295) |
273 (226–323) |
273 (226–323) |
<0.0001*,†,‡,¶,** |
| EPA/AA ratio, median (IQR) |
| Baseline |
0.30
(0.21–0.45) |
0.28
(0.22–0.43) |
0.26
(0.19–0.42) |
0.33
(0.18–0.50) |
0.33
(0.18–0.50) |
0.4764 |
| Follow up |
0.76
(0.34–1.12) |
0.29
(0.18–0.41) |
0.71
(0.54–0.86) |
1.18
(0.89–1.43) |
1.18
(0.89–1.43) |
<0.0001*,†,‡,§,** |
| DHA/AA ratio, median (IQR) |
| Baseline |
0.71
(0.57–0.86) |
0.73
(0.62–0.89) |
0.63
(0.51–0.77) |
0.72
(0.55–0.85) |
0.72
(0.55–0.85) |
0.0577 |
| Follow up |
0.71
(0.54–0.88) |
0.57
(0.44–0.80) |
0.80
(0.62–0.97) |
0.70
(0.53–0.84) |
0.70
(0.53–0.84) |
<0.0001†,‡,¶ |
| EPA+DHA/AA ratio, median (IQR) |
| Baseline |
1.02
(0.79–1.31) |
1.07
(0.85–1.27) |
0.88
(0.72–1.16) |
1.04
(0.74–1.34) |
1.04
(0.74–1.34) |
0.1559 |
| Follow up |
1.50
(0.97–2.00) |
0.87
(0.65–1.25) |
1.50
(1.28–1.83) |
1.93
(1.41–2.28) |
1.93
(1.41–2.28) |
<0.0001*,†,‡,§,** |
| HbA1c (%), median (IQR) |
| Baseline |
5.9 (5.6–6.4) |
6.0 (5.6–6.5) |
5.9 (5.6–6.4) |
5.8 (5.6–6.5) |
5.8 (5.6–6.5) |
0.6616 |
| Follow up |
5.9 (5.7–6.5) |
5.9 (5.6–6.5) |
5.9 (5.7–6.7) |
5.9 (5.7–6.3) |
5.9 (5.7–6.3) |
0.9758 |
| hs-CRP (mg/dL), median (IQR) |
| Baseline |
0.079
(0.037–0.22) |
0.095
(0.043–0.35) |
0.069
(0.029–0.23) |
0.079
(0.039–0.18) |
0.079
(0.039–0.18) |
0.5558 |
| Follow up |
0.05
(0.025–0.10) |
0.05
(0.022–0.1) |
0.05
(0.03–0.089) |
0.05
(0.028–0.016) |
0.05
(0.028–0.016) |
0.8957 |
*No EPA/DHA vs. high-dose EPA alone, P<0.05. †No EPA/DHA vs. low-dose EPA+DHA, P<0.05. ‡No EPA/DHA vs. high-dose EPA+DHA, P<0.05. §High-dose EPA alone vs. low-dose EPA+DHA, P<0.05. ¶High-dose EPA alone vs. high-dose EPA+DHA, P<0.05. **Low-dose EPA+DHA vs. high-dose EPA+DHA, P<0.05. AA, arachidonic acid; DHA, docosahexaenoic acid; EPA, eicosapentaenoic acid; HbA1c, hemoglobin A1c; HDL-C, high-density lipoprotein cholesterol; hs-CRP, high-sensitivity C-reactive protein; IQR, interquartile range; LDL-C, low-density lipoprotein; TC, total cholesterol; TG, triglycerides.
Median time interval between CTA-1 and CTA-2 was 361 (332–375) days. Plaque progression was observed in 27 (13%) patients, including 5 cardiac events before CTA-2; 4 in the no EPA/DHA group and 1 in the low-dose EPA+DHA group. Scheduled PCI was performed in 50 patients between CTA-1 and CTA-2; these lesions were excluded from analysis. There was no significant difference in patient background between plaque progression (+) and (−) groups (Supplementary Table 1).
On CTA-1, HRP at the non-culprit lesion was observed in 72 (34%) patients. HRP was significantly more frequently observed in the group that demonstrated plaque progression (67%) compared to the groups that did not show progression (30%, P=0.0001); 25% of patients with HRP had plaque progression and 6.5% of patients without HRP had plaque progression (P=0.0002) (Supplementary Table 1, Figure 1). In the plaque progression group, HRP was even more frequently detected on CTA-2 compared to CTA-1 (77.8%).
Investigative laboratory data at baseline (CTA-1) and follow up (at the time of CTA-2) are presented in Supplementary Table 2. Baseline values were not significantly different between plaque progression (+) and (−) groups, except for hs-CRP; hsCRP was significantly higher in the patients showing plaque progression (0.159 (0.073–0.393) vs. 0.073 (0.036–0.197), P=0.0119). LDL-C at CTA-2 was not significantly different between the 2 groups (76 vs. 81 mg/dL, P=0.2665). EPA/AA at CT-2 tended to be lower in the plaque progression group (0.57 (0.24–0.96) vs. 0.78 (0.37–1.18), P=0.0879). DHA/AA (0.71 (0.53–0.92) vs. 0.71 (0.53–0.92), P=0.9714) and EPA+DHA/AA (1.30 (0.81–1.86) vs. 1.53 (1.01–2.01), P=0.1898) at CTA-2 were not significantly different between the plaque progression (+) and (−) groups.
Plaque progression was observed in 20.3% of the no EPA/DHA group, 15.7% of the low-dose EPA+DHA group, 0% of the high-dose EPA+DHA group, and 7.1% of the high-dose EPA alone group (P=0.0107); there was no significant difference between each group (P>0.05) (Table 3). Patients were reclassified based on the EPA/DHA dose they were treated with. There was significant difference in plaque progression among groups based on EPA dose regardless of DHA dose: EPA-none (no EPA/DHA) vs. EPA-low (low-dose EPA+DHA) vs. EPA-high (high dose EPA+DHA and high-dose EPA alone); 20.3 vs. 15.7 vs. 5.6%, P=0.0136 (EPA-high vs. EPA-none; P<0.05) (Figures 1,2). There was no significant difference based on DHA dose (P=0.1830). Although there was significance difference based on the total EPA+DHA dose (P=0.0328), no significant difference was observed between each group.
Table 3. Plaque Progression on CTA Based on Omega-3 Fatty Acids
| Omega-3 fatty acids |
Dose |
P value |
| EPA or DHA dose |
None
(n=69) |
Low-dose EPA+DHA
(930+750 mg) (n=51) |
High-dose EPA+DHA
(1,860+1,500 mg)
(n=20) |
High-dose EPA alone
(1,800 mg) (n=70) |
|
| Plaque progression, n (%) |
14 (20.3) |
8 (15.7) |
0 (0) |
5 (7.1) |
0.0107 |
| EPA dose |
None (EPA-none)
(n=69) |
Low dose (930 mg)
(EPA-low) (n=51) |
High dose (1,800 mg/1,860 mg)
(EPA-high) (n=90) |
|
| Plaque progression, n (%) |
14 (20.3) |
8 (15.7) |
5 (5.6) |
0.0136* |
| DHA dose |
None
(n=139) |
Low dose (750 mg)
(n=51) |
High dose (1,500 mg)
(n=20) |
|
| Plaque progression, n (%) |
19 (13.7) |
8 (15.7) |
0 (0) |
0.1830 |
| EPA or DHA dose |
None
(n=69) |
EPA alone (n=70) |
Low-dose and high-dose EPA+DHA
(n=71) |
|
| Plaque progression, n (%) |
14 (20.3) |
5 (7.1) |
8 (11.3) |
0.0635 |
| Total EPA+DHA dose |
None
(n=69) |
Low dose
(1,680 mg/1,800 mg)
(n=121) |
High dose (3,360 mg)
(n=20) |
|
| Plaque progression, n (%) |
14 (20.3) |
13 (10.7) |
0 (0) |
0.0328 |
*0 vs. 1,800/1,860, P<0.05. CTA, coronary tomography angiography; DHA, docosahexaenoic acid; EPA, eicosapentaenoic acid.
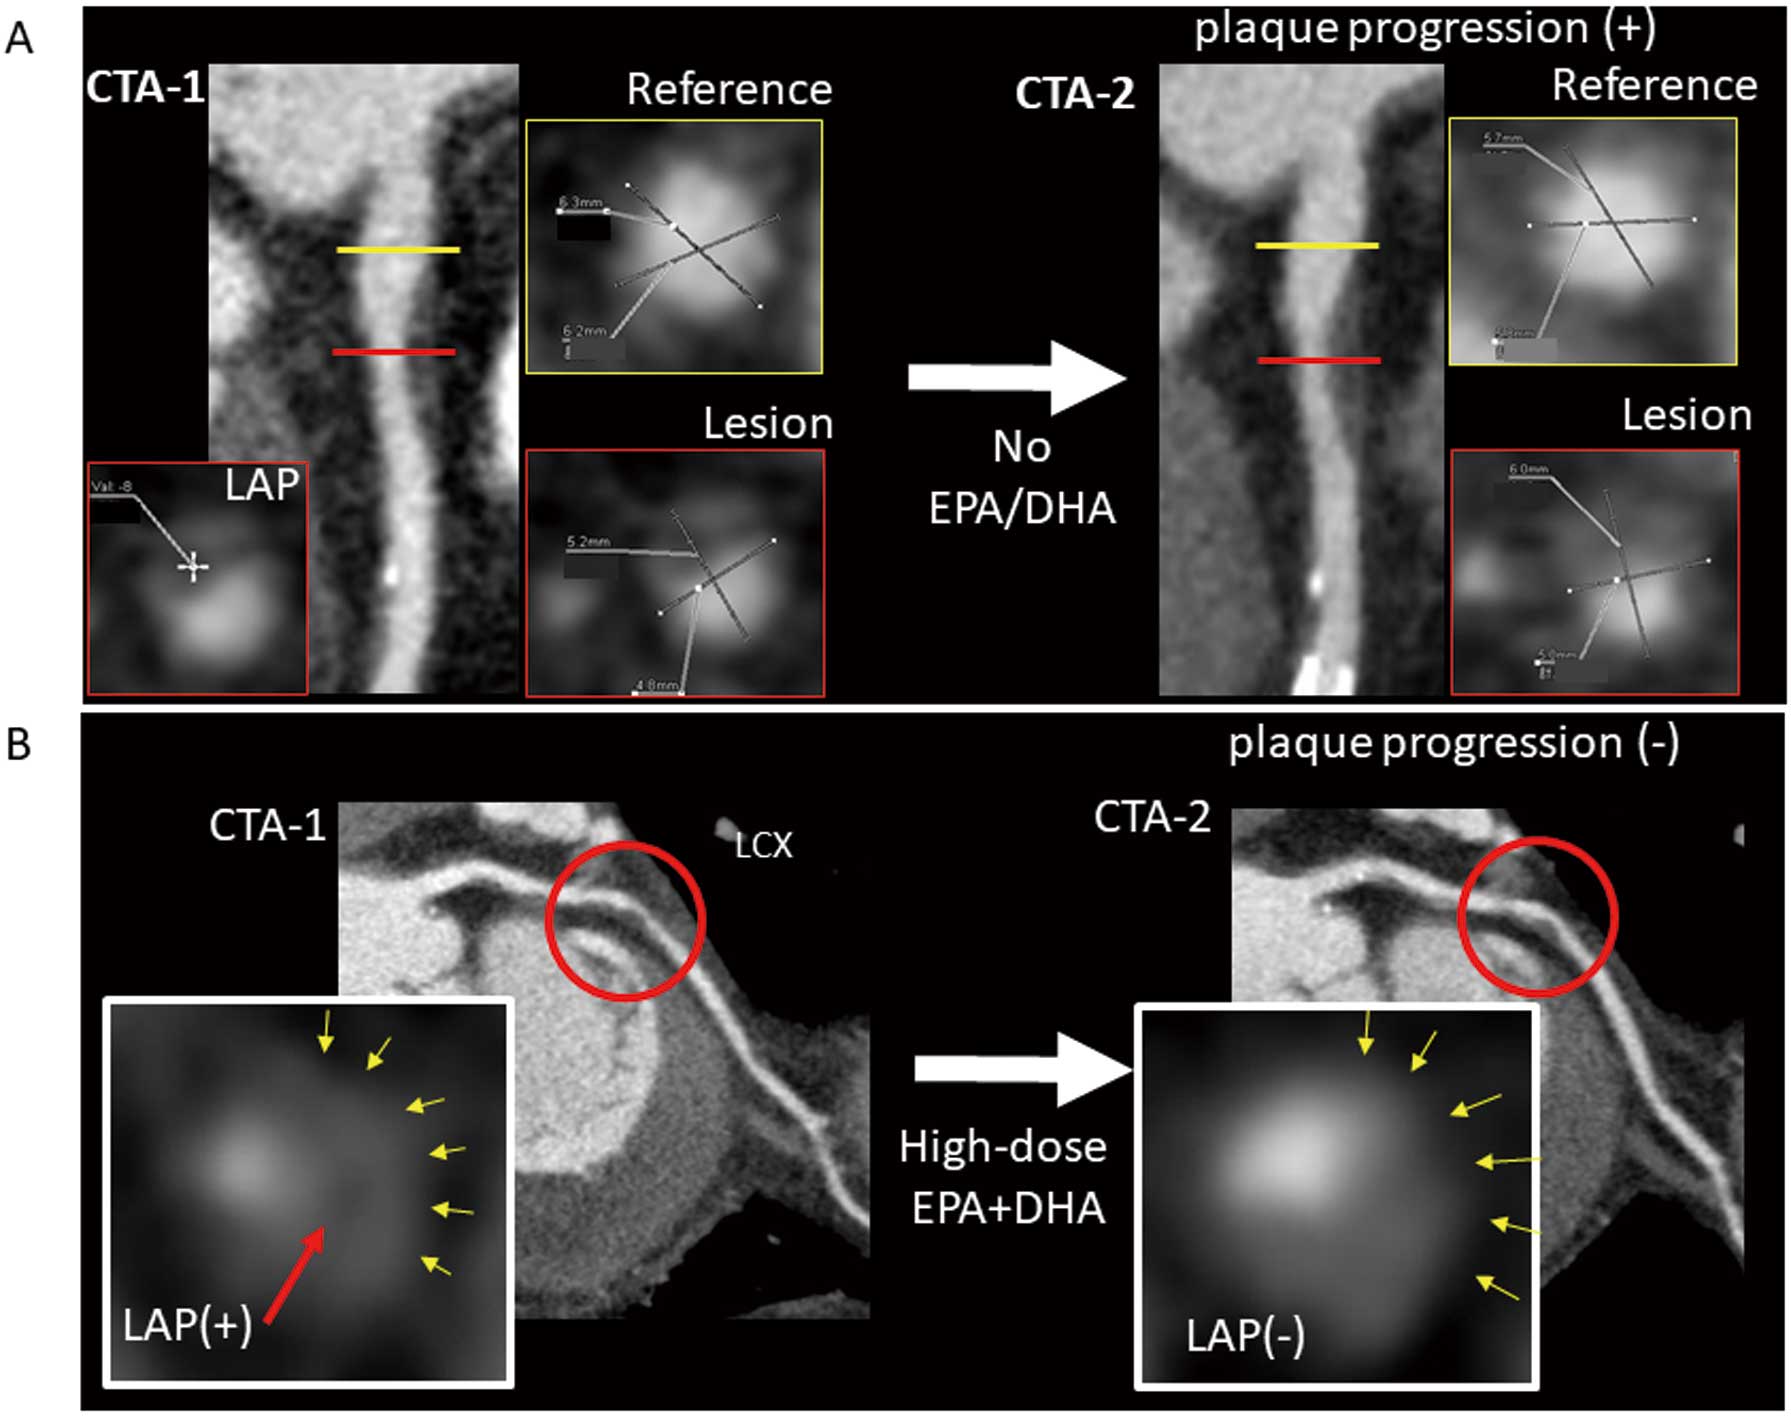
Multivariate logistic regression analysis adjusted for age and sex revealed that HRP on CTA-1 (OR 6.61, 95% CI 2.63–18.05, P<0.0001), EPA/DHA dose and statin drugs were the independent predictors of plaque progression on serial CTA (Table 4). EPA/DHA treatment resulted in less plaque progression; although the high-dose EPA+DHA group (P=0.0044) and the high-dose EPA alone group (P=0.0021) had limited plaque progression compared to the no EPA/DHA group, there was no significant difference between the high-dose EPA+DHA and high-dose EPA alone groups (P=0.1617) (model 1). In model 2, patients were reclassified into 3 groups based on EPA dose, regardless of the presence of DHA: EPA-none, EPA-low (low-dose EPA+DHA), and EPA-high (high-dose EPA+DHA and high-dose EPA alone). The EPA-high compared to the EPA-none group revealed an OR of 0.13 (95% CI=0.03–0.42, P=0.0004). Rosuvastatin was associated with less plaque progression compared with Pitavastatin (model 1: OR 0.25, 95% CI 0.07–0.74, P=0.0117; model 2: OR 0.24, 95% CI 0.07–0.70, P=0.0079). The presentative case was shown in Figure 2.
Table 4. Univariate and Multivariate Logistic Regression Analysis for Plaque Progression on Serial CTA
| |
Univariate |
Multivariate |
| OR (95% CI) |
P value |
OR (95% CI) |
P value |
OR (95% CI) |
P value |
| Age§ |
1.01 (0.97–1.04) |
0.6902 |
1.00 (0.96–1.04) |
0.6484 |
1.01 (0.96–1.05) |
0.6226 |
| Male |
0.52 (0.22–1.35) |
0.1750 |
0.31 (0.10–0.94) |
0.0394 |
0.32 (0.10–0.96) |
0.0442 |
| BMI§ |
0.97 (0.87–1.09) |
0.5929 |
|
|
|
|
| Hypertension |
0.77 (0.34–1.78) |
0.5405 |
|
|
|
|
| Dyslipidemia |
0.71 (0.31–1.76) |
0.4467 |
|
|
|
|
| Diabetes mellitus |
1.05 (0.43–2.43) |
0.9100 |
|
|
|
|
| Current smoking |
1.31 (0.56–2.97) |
0.5251 |
|
|
|
|
| Past CAD |
1.75 (0.54–4.83) |
0.3242 |
|
|
|
|
| OMI |
1.22 (0.27–3.98) |
0.7680 |
|
|
|
|
| CACS |
1.00 (0.99–1.00) |
0.5952 |
|
|
|
|
| HRP on CTA-1 |
4.78 (2.07–11.78) |
0.0002 |
6.61 (2.63–18.05) |
<0.0001 |
6.44 (2.57–17.45) |
<0.0001 |
| TG§ |
1.00 (0.99–1.00) |
0.6822 |
|
|
|
|
| TC§ |
1.00 (0.99–1.01) |
0.9997 |
|
|
|
|
| HDL-C§ |
0.99 (0.97–1.01) |
0.3677 |
|
|
|
|
| LDL-C§ |
1.00 (0.99–1.01) |
0.7905 |
|
|
|
|
| DGLA§ |
0.99 (0.97–1.03) |
0.9056 |
|
|
|
|
| AA§ |
1.00 (0.99–1.00) |
0.3569 |
|
|
|
|
| EPA§ |
1.01 (0.99–1.02) |
0.4259 |
|
|
|
|
| DHA§ |
1.00 (0.99–1.02) |
0.3594 |
|
|
|
|
| EPA+DHA§ |
1.00 (0.99–1.01) |
0.3459 |
|
|
|
|
| EPA/AA† |
1.14 (0.92–1.48) |
0.2458 |
|
|
|
|
| DHA/AA† |
1.14 (0.96–1.38) |
0.1457 |
|
|
|
|
| EPA+DHA/AA† |
0.08 (0.97–1.22) |
0.1191 |
|
|
|
|
| HbA1c§ |
0.95 (0.72–1.35) |
0.7434 |
|
|
|
|
| hs-CRP‡ |
1.00 (0.99–1.00) |
0.0932 |
|
|
|
|
| Statin drug |
|
<0.0001 |
|
0.0359 |
|
0.0246 |
| Pitavastatin vs. Atorvastatin |
1.44 (0.36–9.68) |
0.6316 |
2.66 (0.53–21.60) |
0.2481 |
2.78 (0.57–22.13) |
0.2196 |
| Rosuvastatin vs. Atorvastatin |
0.54 (0.11–3.97) |
0.5027 |
0.68 (0.11–5.89) |
0.7019 |
0.67 (0.11–5.74) |
0.6910 |
| Rosuvastatin vs. Pitavastatin |
0.37 (0.13–0.94) |
0.0363 |
0.25 (0.07–0.74) |
0.0117 |
0.24 (0.07–0.70) |
0.0079 |
| Model 1: EPA and DHA dose |
|
0.0107 |
|
0.0024 |
|
|
High-dose EPA alone vs.
no EPA/DHA |
0.30 (0.09–0.84) |
0.0217 |
0.17 (0.04–0.54) |
0.0021 |
|
|
Low-dose EPA+DHA vs.
no EPA/DHA |
0.73 (0.27–1.86) |
0.5169 |
0.34 (0.10–1.06) |
0.0646 |
|
|
High-dose EPA+DHA vs.
no EPA/DHA |
NA* |
0.0051 |
NA* |
0.0044 |
|
|
Low-dose EPA+DHA vs.
high-dose EPA alone |
2.41 (0.75–8.46) |
0.1366 |
2.01 (0.56–7.71) |
0.2788 |
|
|
High-dose EPA+DHA vs.
high-dose EPA alone |
NA* |
0.1071 |
NA* |
0.1617 |
|
|
High-dose vs. low-dose
EPA+DHA |
NA* |
0.0171 |
NA* |
0.0625 |
|
|
| Model 2: EPA dose |
|
0.0136 |
|
|
|
0.0020 |
| EPA-low vs. EPA-none |
0.73 (0.27–1.87) |
0.5169 |
|
|
0.34 (0.10–1.04) |
0.0604 |
| EPA-high vs. EPA-none |
0.23 (0.07–0.64) |
0.0043 |
|
|
0.13 (0.03–0.42) |
0.0004 |
| EPA-high vs. EPA-low |
0.32 (0.09–1.00) |
0.0510 |
|
|
0.40 (0.10–1.43) |
0.1611 |
§Per 1 increase, †Per 0.1 increase, ‡0.01 increase. *Not applicable (NA) because there was no plaque progression in the high-dose EPA+DHA group. CI, confidence interval; OR, odds ratio. Other abbreviations as in Tables 1,2.
Quantitative PV was compared among the no EPA/DHA, high-dose EPA+DHA, low-dose EPA+DHA, and high-dose EPA alone groups. Five lesions with cardiac events between CTA-1 and CTA-2 were excluded from quantitative plaque analysis. For patient-based analysis, total PV and NCP volume were significantly reduced in the high-dose EPA alone group (Supplementary Table 3). In a comparison based on EPA dose regardless of the presence of DHA, interval change of the total PV and NCP volume were significantly larger in the EPA-high group compared with the EPA-none and EPA-low groups.
For lesion-based characterization, 563 plaques were quantitatively analyzed (Table 5). In the no EPA/DHA, low-dose EPA+DHA, high-dose EPA+DHA, and high-dose EPA alone groups, total PV, fibrous PV, fibrofatty plaque, low attenuation PV, and total non-calcified PV were significantly reduced in the high-dose EPA alone group. In the high-dose EPA+DHA group, fibrofatty plaque and total non-calcified PV were reduced, but it was not significantly different between CTA-1 and CTA-2. Interval change of total PV and total non-calcified PV were significantly different; the high-dose EPA+DHA and high-dose EPA alone groups were significantly different compared with the no EPA/DHA group, and there was a significant difference between the high-dose EPA+DHA and the low-dose EPA alone groups. In a comparison based on EPA dose regardless of the presence of DHA, the interval change of total PV and total non-calcified PV were significantly larger in the EPA-high group and EPA-low groups compared with the EPA-none group. LAP volume change was significantly different between the 3 groups; LAP volume was significantly increased in the EPA-none group and significantly decreased in the EPA-high group. Median change of the remodeling index was increased in the EPA-none and EPA-low groups and decreased in the EPA-high group.
Table 5. Lesion-Based Quantitative Plaque Analysis
| |
All plaques
(n=563) |
EPA/DHA dose |
EPA dose |
No EPA/DHA
(n=176) |
Low-dose
EPA+DHA (n=139) |
High-dose
EPA+DHA (n=51) |
High-dose
EPA alone (n=197) |
P value |
EPA-none
(n=176) |
EPA-low
(n=139) |
EPA-high
(n=248) |
P value |
| Total plaque volume (mm3), median (IQR) |
| CTA-1 |
104.61
(50.45~200.78) |
122.24
(53.01~197.37) |
79.10
(47.65~171.53) |
104.39
(49.72~208.49) |
104.39
(49.72~208.49) |
0.3214 |
122.24
(53.01~197.37) |
79.10
(47.65~171.53) |
110.85
(50.05~210.86) |
0.1967 |
| CTA-2 |
103.24
(50.14~195.89) |
119.31
(56.80~224.24) |
93.34
(48.82~185.13) |
99.37
(42.78~171.63) |
99.37
(42.78~171.63) |
0.0895 |
119.31
(56.80~224.24) |
93.34
(48.82~185.13) |
103.19
(45.68~176.48) |
0.0472‡‡ |
| Difference |
0.72
(−10.71~13.91) |
6.39
(−4.26~23.32) |
3.00
(−5.98~23.18) |
−5.20
(−26.06~3.47) |
−5.20
(−26.06~3.47) |
<0.0001*,‡,§ |
6.39
(−4.26~23.32) |
3.00
(−5.98~23.18) |
−4.73
(−24.1~3.82) |
<0.0001‡‡,§§ |
| P value |
<0.0001 |
<0.0001 |
0.0072 |
<0.0001 |
<0.0001 |
|
<0.0001 |
0.0072 |
<0.0001 |
|
| Calcification (mm3), median (IQR) |
| CTA-1 |
15.81
(5.87~36.91) |
18.58
(4.99~40.53) |
14.62
(5.59~31.98) |
15.17
(6.18~41.87) |
15.17
(6.18~41.87) |
0.8985 |
18.58
(4.99~40.53) |
14.62
(5.59~31.98) |
14.98
(6.77~38.35) |
0.7909 |
| CTA-2 |
17.57
(6.91~40.96) |
19.32
(7.49~45.26) |
17.32
(8.25~37.80) |
15.10
(5.91~39.74) |
15.10
(5.91~39.74) |
0.3947 |
19.32
(7.49~45.26) |
17.32
(8.25~37.80) |
15.15
(6.03~37.85) |
0.2284 |
| Difference |
0.86
(−2.33~6.18) |
1.83
(−1.40~8.56) |
1.85
(−1.01~8.02) |
−0.27
(−4.10~2.86) |
−0.27
(−4.10~2.86) |
<0.0001*,§,¶ |
1.83
(−1.40~8.56) |
1.85
(−1.01~8.02) |
−0.04
(−3.78~3.46) |
<0.0001‡‡,§§ |
| P value |
<0.0001 |
<0.0001 |
<0.0001 |
0.0167 |
0.1648 |
|
<0.0001 |
<0.0001 |
0.8858 |
|
| Fibrous plaque (mm3), median (IQR) |
| CTA-1 |
18.61
(10.00~34.18) |
20.05
(10.04~33.36) |
15.68
(9.91~29.85) |
22.5
(12.43~36.07) |
19.06
(9.78~36.45) |
0.4776 |
20.05
(10.04~33.36) |
15.68
(9.91~29.85) |
19.68
(10.02~36.19) |
0.4328 |
| CTA-2 |
17.52
(9.72~33.05) |
17.87
(10.42~38.06) |
16.58
(10.59~32.29) |
20.61
(11.03~32.73) |
17.36
(8.63~32.29) |
0.3573 |
17.87
(10.42~38.06) |
16.58
(10.59~32.29) |
17.96
(9.22~32.35) |
0.4133 |
| Difference |
−0.80
(−4.67~3.66) |
−0.39
(−4.05~5.33) |
0.78
(−2.37~5.43) |
−0.42
(−3.18~3.24) |
−2.13
(−7.13~1.33) |
<0.0001*,§ |
−0.39
(−4.05~5.33) |
0.78
(−2.37~5.43) |
−1.59
(−6.29~1.57) |
<0.0001‡‡,§§ |
| P value |
0.0424 |
0.8156 |
0.0706 |
0.6359 |
<0.0001 |
|
0.8156 |
0.0706 |
<0.0001 |
|
| Fibro-fatty plaque (mm3), median (IQR) |
| CTA-1 |
45.63
(23.31~99.56) |
48.77
(24.57~102.16) |
39.61
(22.59~84.76) |
57.87
(24.87~115.15) |
45.16
(23.04~99.59) |
0.4212 |
48.77
(24.57~102.16) |
39.61
(22.59~84.76) |
47.63
(23.25~100.40) |
0.3506 |
| CTA-2 |
43.68
(22.04~95.98) |
50.17
(25.94~107.46) |
39.18
(20.06~82.76) |
56.24
(20.18~9.036) |
43.01
(20.49~83.60) |
0.1925 |
50.17
(25.94~107.46) |
39.18
(20.06~82.76) |
44.04
(20.48~85.81) |
0.1143 |
| Difference |
−1.01
(−8.60~5.17) |
1.97
(−4.44~10.23) |
−0.06
(−6.02~6.82) |
−3.46
(−10.49~1.2) |
−2.82
(−13.63~1.36) |
<0.0001*,‡,§ |
1.97
(−4.44~10.23) |
−0.06
(−6.02~6.82) |
−3.07
(−12.46~1.27) |
<0.0001‡‡,§§ |
| P value |
0.0092 |
0.0041 |
0.9142 |
0.0022 |
<0.0001 |
|
0.0041 |
0.9142 |
<0.0001 |
|
| Low attenuation plaque (mm3), median (IQR) |
| CTA-1 |
6.26
(1.81~20.39) |
7.30
(1.80~21.61) |
5.52
(1.80~15.66) |
10.95
(1.9~25.62) |
5.22
(1.82~22.59) |
0.5501 |
7.30
(1.80~21.61) |
5.52
(1.80~15.66) |
5.96
(1.84~22.63) |
0.5231 |
| CTA-2 |
6.18
(1.79~20.39) |
9.04
(2.76~23.78) |
4.99
(1.32~17.85) |
10.25
(1.77~20.26) |
5.20
(1.83~17.94) |
0.0454 |
9.04
(2.76~23.78) |
4.99
(1.32~17.85) |
5.58
(1.81~20.02) |
0.0251††,‡‡ |
| Difference |
0.01
(−2.64~1.99) |
0.56
(−1.44~5.80) |
−0.10
(−2.45~1.53) |
−0.24
(−2.79~1.92) |
−0.21
(−4.82~0.88) |
<0.0001* |
0.56
(−1.44~5.80) |
−0.10
(−2.45~1.53) |
−0.23
(−4.53~1.00) |
<0.0001††,‡‡ |
| P value |
0.6204 |
0.0016 |
0.6973 |
0.4202 |
0.0014 |
|
0.0016 |
0.6973 |
0.0012 |
|
| Total non-calcified plaque (mm3), median (IQR) |
| CTA-1 |
74.05
(36.43~157.48) |
78.65
(38.49~159.47) |
63.05
(35.68~137.11) |
95.16
(38.53~183.18) |
76.15
(35.13~163.14) |
0.4133 |
78.65
(38.49~159.47) |
63.05
(35.68~137.11) |
77.34
(36.08~164.52) |
0.3288 |
| CTA-2 |
70.20
(36.27~151.62) |
82.68
(40.62~174.35) |
65.6
(33.66~133.25) |
88.12
(34.62~141.09) |
67.38
(32.46~129.76) |
0.1800 |
82.68
(40.62~174.35) |
65.6
(33.66~133.25) |
68.82
(32.92~134.37) |
0.1152 |
| Difference |
−1.04
(−10.63~7.82) |
3.16
(−5.52~16.99) |
0.30
(−7.97~11.55) |
−3.42
(−11.04~4.3) |
−4.27
(−20.22~1.29) |
<0.0001*,‡,§ |
3.16
(−5.52~16.99) |
0.30
(−7.97~11.55) |
−4.18
(−18.71~1.97) |
<0.0001‡‡,§§ |
| P value |
0.0434 |
0.0003 |
0.4118 |
0.0621 |
<0.0001 |
|
0.0003 |
0.4118 |
<0.0001 |
|
| Remodeling index, median (IQR) |
| CTA-1 |
114.5
(99.7~133.1) |
117.7
(101.1~135.7) |
109.5
(98.1~129.7) |
115.65
(99.39~135.23) |
114.3
(99.7~134.6) |
0.1634 |
117.7
(101.1~135.7) |
109.5
(98.1~129.7) |
114.5
(99.6~134.6) |
0.0806 |
| CTA-2 |
114.5
(101.1~134.1) |
121.9
(103.5~142.5) |
114.8
(102.7~130.0) |
108.58
(101.4~132.5) |
111.8
(98.4~133.4) |
0.0740 |
121.9
(103.5~142.5) |
114.8
(102.7~130.0) |
110.8
(98.7~132.3) |
0.0325‡‡ |
| Difference |
1.46
(−11.04~12.83) |
1.91
(−13.01~16.10) |
5.35
(−5.71~13.33) |
−0.32
(−14.95~12.66) |
−0.58
(−12.11~10.12) |
0.0131§ |
1.91
(−13.01~16.10) |
5.35
(−5.71~13.33) |
−0.47
(−12.68~10.51) |
0.0046§§ |
| P value |
0.2318 |
0.3237 |
0.0008 |
0.5353 |
0.2273 |
|
0.3237 |
0.0008 |
0.1670 |
|
*No EPA vs. high-dose EPA alone, P<0.05. ‡No EPA vs. high-dose EPA+DHA, P<0.05. §High-dose EPA alone vs. low-dose EPA+DHA, P<0.05. ¶High-dose EPA alone vs. high-dose EPA+DHA, P<0.05. ††EPA-none vs. EPA-low, P<0.05. ‡‡EPA-none vs. EPA-high, P<0.05. §§EPA-low vs. EPA-high, P<0.05. CTA, computed tomography angiography; EPA, eicosapentaenoic acid; IQR, interquartile range.
Discussion
Addition of the high-dose EPA regardless of DHA to statin therapy in patients after ACS restricted plaque progression, as verified by serial CTA compared, with no added EPA. Plaque progression was detected on serial CTA in 13% of patients with ACS who were receiving statin treatment. Addition of EPA substantially reduced the frequency of plaque progression (5.6%). Although high-dose EPA+DHA combination also limited plaque progression compared to low-dose EPA+DHA combination or no EPA/DHA, there was no significant difference between a high-dose EPA+DHA combination and high-dose EPA alone.
Omega-3 Fatty Acids and Cardiovascular Events
Reduction of LDL-C with statin treatment is indispensable for secondary and primary prevention of major adverse cardiac events.1–4 Although several studies have reported that addition of EPA to statins reduces cardiac events or death,10–12 the efficacy of n-3 fatty acids has not been conclusive.23–26 Meta-analysis of 20 randomized clinical trials was reported, including 13 secondary prevention studies, 4 mixed primary and secondary prevention studies, and 3 studies for prevention of arrhythmogenic events. The omega-3 fatty acid supplementation was not associated with a lower risk of cardiovascular event. In this report, the mean dose of omega-3 was 1.51 g per day (0.77 g EPA, 0.60 g DHA).25 Another meta-analysis of 10 studies that investigated secondary prevention of CAD had also demonstrated that omega-3 fatty acids had no significant effect on cardiovascular events. In these studies, the dose of EPA varied between 226 and 1,800 mg and DHA between 150 and 1,700 mg.26
Dose of the Omega-3 Fatty Acids and Potential Efficacy
Recently conducted primary prevention of CAD studies allude to the importance of omega-3 fatty acid dose. The ASCENT study evaluated the effect of an omega-3 fatty acid supplement on cardiovascular disease in 15,480 patients with diabetes but without past evidence of CAD.27 Patients received 1-g capsules containing either omega-3 fatty acids (840 mg including EPA 460 mg and DHA 380 mg) or a matching placebo (olive oil) daily. There was no significant difference in the risk of major adverse vascular events between the fatty acid and placebo groups. The VITAL study evaluated the efficacy of omega-3 fatty acids for primary prevention of CAD in 25,871 general population assigned to receive either omega-3 fatty acids (1 g per day as a fish-oil capsule containing EPA 460 mg and DHA 380 mg) or a placebo.28 Similar to the ASCENT study, the VITAL study also concluded that supplementation with omega-3 fatty acids did not lower the incidence of major cardiovascular events.
In contrast, 2 other studies have evaluated the feasibility of using higher doses of omega-3 fatty acids. The REDUCE-IT study reported the effect of 4 g of EPA in patients at high risk of cardiovascular events.29 They included 8,179 patients with a high triglyceride level who have been receiving statin therapy, and patients were assigned to receive either 4 g of icosapent ethyl (high-purity prescription form of EPA) or a placebo; the risk of a cardiovascular event was significantly lower with EPA treatment. The JELIS study (Japan EPA Lipid Intervention Study) recruited 18,645 hypercholesterolemia patients to receive either statin therapy plus 1.8 g of pure EPA or statin therapy alone.12 The risk of major adverse cardiac events was significantly lower in the group that received the combination treatment than in the group that received statin therapy alone. Compared to the ASCENT and VITAL studies, the JELIS and REDUCE-IT studies used a substantially higher dose of omega-3 fatty acids, and this could explain the discrepancy in outcomes.
In the present study, high-dose EPA (EPA-high: high-dose EPA+DHA and high-dose EPA alone) could prevent plaque progression on serial CTA, compared to no EPA (EPA-none). Although high-dose EPA+DHA (1,860+1,500 mg) group also limited plaque progression compared to low-dose EPA+DHA (930+750 mg) and no EPA/DHA, there was no significant difference compared with high-dose EPA alone. A comparison of the current study with previous studies suggests that the plaque modification may contribute to the efficacy of omega-3 fatty acid supplementation.
Plaque Progression on Serial CTA as a Surrogate Marker of Future Cardiac Events
CTA-verified HRP has been reported as a predictor of adverse future cardiac events in studies including patients both with and without known CAD.13,14 It is further reported that not all HRP result in cardiac events, and most of the fateful HRP demonstrates plaque progression before an event. In 423 patients undergoing serial CTA, plaque progression was detected in 13.2% at a mean interval of 1 year.14 During a median follow up of 4.1 years after CTA-2, patients with plaque progression had a significantly higher rate of future events (14.3%) than those without plaque progression (0.3%; P<0.05). Plaque progression emerged as the independent predictor of ACS. We have recently proposed that plaque progression is a necessary predecessor of future cardiac events, and that the prevention of progression would contribute to prevention of adverse cardiac events.16 In the present study, plaque progression upon CTA-2 was observed in 13%. HRP on both CTA-1 and CTA-2 was significantly more frequent in the plaque progression group compared with the no plaque progression group. HRP was even more frequently detected on CTA-2 compared to CTA-1. HRP played an important role in plaque progression and future cardiac events as well.
The patients treated with high-dose EPA (EPA-high) demonstrated a significantly lower rate of plaque progression (5.6%) than patients treated without EPA (20.3%). Although the REDUCE-IT study had included patients only with ≥150 mg/dL triglyceride levels, cardiovascular risk reduction was not associated with a reduction in triglyceride level. The observed cardiovascular benefit was similar across all baseline tertiles of triglycerides (<150, ≥150 to <200, and ≥200 mg/dL), and the lower risk of major adverse cardiovascular events with EPA (vs. placebo) occurred irrespective of the attained triglyceride level at 1 year (≥150 or <150 mg/dL). Based on these observations, it was suggested that the cardiovascular risk reduction was not associated with attainment of a more normal triglyceride level, and at least some of the effect of EPA might be explained by metabolic effects other than a reduction of triglyceride levels. The present study included patients with a lower level of a median triglyceride level (114 mg/dL) at baseline. Although triglycerides were significantly reduced when a higher dose of EPA was taken, triglyceride level at CTA-2 was not significantly different in patients with and without plaque progression. It has also been proposed that the omega-3 fatty acids exert beneficial effects by their anti-thrombotic, blood-pressure-lowering, and anti-inflammatory effects.30,31 In the serial CTA study, we have previously demonstrated that a reduction in LDL-C with statin treatment results in a reduction in PV over time and could contribute to plaque stability.15 Previous studies that evaluated the effect of statin therapy with intravascular ultrasound (IVUS) also reported that intensive statin therapy reduced PV.32,33 In the present study, there was no regression effect on total non-calcified PV in the EPA-none group. Although all patients were on statin therapy, only 13% were on maximum dose; median LDL-C at follow up was 80 mg/dL. More intensive statin therapy could have helped to reduce the PV. The high-dose EPA+DHA group had a higher rate (65%) of patients on Rosvastatin and lower LDL-C (median (OQR): 73 (65–103) mg/dL) at follow up. In addition, on multivariate logistic regression analysis, statin drug was the independent predictor of plaque progression at CTA-2 (patients with Rosvastatin had significantly less plaque progression compared with patients with Pitavastatin). These results supported the importance of LDL-C reduction with intensive stain therapy. In the present study for the secondary prevention of CAD, all patients were on statin therapy. The limited plaque progression in the EPA-high group, therefore, suggests that plaque modification is a result of non-lipid-related mechanisms. The present study, however, confirms the efficacy of omega-3 fatty acid supplementation, but it is not able to specify the pathogenetic basis of favorable plaque characteristics.
Study Limitations
This study has several limitations. First, this is retrospective and single center study with a low number of patients. Second, the dose and variety of statin treatment was not identical between groups. Finally, selection of omega-3 fatty acids was determined by the attending physician. Although the selection of omega-3 fatty acids could be subjected to bias, there was no significant difference in patient baseline characteristics.
Conclusions
In patients with ACS, addition of high-dose EPA regardless of DHA (EPA-high) to statin therapy, compared to statin therapy without EPA, was associated with a lower rate of plaque progression. The limited plaque progression could explain the efficacy of high-dose omega-3 fatty acid supplementation addition to intensive statin therapy for favorable effects on cardiovascular outcomes.
Disclosures
The authors did not have any financial support to conduct this study. S.M., Y.O. and H.I. are members of Circulation Journal’s Editorial Team.
IRB Information
The ethics committee at Fujita Health University approved this study (HM19-260).
Supplementary Files
Please find supplementary file(s);
http://dx.doi.org/10.1253/circj.CJ-21-0615
References
- 1.
Baigent C, Keech A, Kearney PM, Blackwell L, Buck G, Pollicino C, et al. Efficacy and safety of cholesterol-lowering treatment: Prospective meta-analysis of data from 90,056 participants in 14 randomised trials of statins. Lancet 2005; 366: 1267–1278.
- 2.
Cannon CP, Braunwald E, McCabe CH, Rader DJ, Rouleau JL, Belder R, et al. Intensive versus moderate lipid lowering with statins after acute coronary syndromes. N Engl J Med 2004; 350: 1495–1504.
- 3.
LaRosa JC, Grundy SM, Waters DD, Shear C, Barter P, Fruchart JC, et al. Intensive lipid lowering with atorvastatin in patients with stable coronary disease. N Engl J Med 2005; 352: 1425–1435.
- 4.
Cholesterol Treatment Trialists’ (CTT) Collaboration; Baigent C, Blackwell L, Emberson J, Holland LE, Reith C, Bhala N, et al. Efficacy and safety of more intensive lowering of LDL cholesterol: A meta-analysis of data from 170,000 participants in 26 randomised trials. Lancet 2010; 376: 1670–1681.
- 5.
Kaasenbrood L, Boekholdt SM, van der Graaf Y, Ray KK, Peters RJ, Kastelein JJ, et al. Distribution of estimated 10-year risk of recurrent vascular events and residual risk in a secondary prevention population. Circulation 2016; 134: 1419–1429.
- 6.
Ridker PM, Everett BM, Thuren T, MacFadyen JG, Chang WH, Ballantyne C, et al. Antiinflammatory therapy with canakinumab for atherosclerotic disease. N Engl J Med 2017; 377: 1119–1131.
- 7.
Cannon CP, Blazing MA, Giugliano RP, McCagg A, White JA, Theroux P, et al. Ezetimibe added to statin therapy after acute coronary syndromes. N Engl J Med 2015; 372: 2387–2397.
- 8.
Sabatine MS, Giugliano RP, Keech AC, Honarpour N, Wiviott SD, Murphy SA, et al. Evolocumab and clinical outcomes in patients with cardiovascular disease. N Engl J Med 2017; 376: 1713–1722.
- 9.
Schwartz GG, Steg PG, Szarek M, Bhatt DL, Bittner VA, Diaz R, et al. Alirocumab and cardiovascular outcomes after acute coronary syndrome. N Engl J Med 2018; 379: 2097–2107.
- 10.
Burr ML, Fehily AM, Gilbert JF, Rogers S, Holliday RM, Sweetnam PM, et al. Effects of changes in fat, fish, and fibre intakes on death and myocardial reinfarction: Diet and reinfarction trial (DART). Lancet 1989; 2: 757–761.
- 11.
Dietary supplementation with n-3 polyunsaturated fatty acids and vitamin E after myocardial infarction: Results of the GISSI-Prevenzione trial. Gruppo Italiano per lo Studio della Sopravvivenza nell’Infarto miocardico. Lancet 1999; 354: 447–455.
- 12.
Yokoyama M, Origasa H, Matsuzaki M, Matsuzawa Y, Saito Y, Ishikawa Y, et al. Effects of eicosapentaenoic acid on major coronary events in hypercholesterolaemic patients (JELIS): A randomised open-label, blinded endpoint analysis. Lancet 2007; 369: 1090–1098.
- 13.
Motoyama S, Sarai M, Harigaya H, Anno H, Inoue K, Hara T, et al. Computed tomographic angiography characteristics of atherosclerotic plaques subsequently resulting in acute coronary syndrome. J Am Coll Cardiol 2009; 54: 49–57.
- 14.
Motoyama S, Ito H, Sarai M, Kondo T, Kawai H, Nagahara Y, et al. Plaque characterization by coronary computed tomography angiography and the likelihood of acute coronary events in mid-term follow-up. J Am Coll Cardiol 2015; 66: 337–346.
- 15.
Inoue K, Motoyama S, Sarai M, Sato T, Harigaya H, Hara T, et al. Serial coronary CT angiography-verified changes in plaque characteristics as an end point: Evaluation of effect of statin intervention. JACC Cardiovasc Imaging 2010; 3: 691–698.
- 16.
Ahmadi A, Argulian E, Leipsic J, Newby DE, Narula J. From subclinical atherosclerosis to plaque progression and acute coronary events: JACC State-of-the-Art Review. J Am Coll Cardiol 2019; 74: 1608–1617.
- 17.
Agatston AS, Janowitz WR, Hildner FJ, Zusmer NR, Viamonte M Jr, Detrano R. Quantification of coronary artery calcium using ultrafast computed tomography. J Am Coll Cardiol 1990; 15: 827–832.
- 18.
Leipsic J, Abbara S, Achenbach S, Cury R, Earls JP, Mancini GJ, et al. SCCT guidelines for the interpretation and reporting of coronary CT angiography: A report of the Society of Cardiovascular Computed Tomography Guidelines Committee. J Cardiovasc Comput Tomogr 2014; 8: 342–358.
- 19.
Motoyama S, Kondo T, Anno H, Sugiura A, Ito Y, Mori K, et al. Atherosclerotic plaque characterization by 0.5-mm-slice multislice computed tomographic imaging. Circ J 2007; 71: 363–366.
- 20.
Motoyama S, Kondo T, Sarai M, Sugiura A, Harigaya H, Sato T, et al. Multislice computed tomographic characteristics of coronary lesions in acute coronary syndromes. J Am Coll Cardiol 2007; 50: 319–326.
- 21.
Park HB, Lee BK, Shin S, Heo R, Arsanjani R, Kitslaar PH, et al. Clinical feasibility of 3D automated coronary atherosclerotic plaque quantification algorithm on coronary computed tomography angiography: Comparison with intravascular ultrasound. Eur Radiol 2015; 25: 3073–3083.
- 22.
de Graaf MA, Broersen A, Kitslaar PH, Roos CJ, Dijkstra J, Lelieveldt BP, et al. Automatic quantification and characterization of coronary atherosclerosis with computed tomography coronary angiography: Cross-correlation with intravascular ultrasound virtual histology. Int J Cardiovasc Imaging 2013; 29: 1177–1190.
- 23.
Kromhout D, Giltay EJ, Geleijnse JM, Alpha Omega Trial Group. n-3 fatty acids and cardiovascular events after myocardial infarction. N Engl J Med 2010; 363: 2015–2026.
- 24.
ORIGIN Trial Investigators; Bosch J, Gerstein HC, Dagenais GR, Díaz R, Dyal L, Jung H, et al. n-3 fatty acids and cardiovascular outcomes in patients with dysglycemia. N Engl J Med 2012; 367: 309–318.
- 25.
Rizos EC, Ntzani EE, Bika E, Kostapanos MS, Elisaf MS. Association between omega-3 fatty acid supplementation and risk of major cardiovascular disease events: A systematic review and meta-analysis. JAMA 2012; 308: 1024–1033.
- 26.
Aung T, Halsey J, Kromhout D, Gerstein HC, Marchioli R, Tavazzi L, et al. Associations of omega-3 fatty acid supplement use with cardiovascular disease risks: Meta-analysis of 10 Trials Involving 77917 Individuals. JAMA Cardiol 2018; 3: 225–234.
- 27.
ASCEND Study Collaborative Group; Bowman L, Mafham M, Wallendszus K, Stevens W, Buck G, Barton J, et al. Effects of n-3 fatty acid supplements in diabetes mellitus. N Engl J Med 2018; 379: 1540–1550.
- 28.
Manson JE, Cook NR, Lee IM, Christen W, Bassuk SS, Mora S, et al. Marine n-3 fatty acids and prevention of cardiovascular disease and cancer. N Engl J Med 2019; 380: 23–32.
- 29.
Bhatt DL, Steg PG, Miller M, Brinton EA, Jacobson TA, Ketchum SB, et al. Cardiovascular risk reduction with icosapent ethyl for hypertriglyceridemia. N Engl J Med 2019; 380: 11–22.
- 30.
Nicholls SJ, Lincoff AM, Bash D, Ballantyne CM, Barter PJ, Davidson MH, et al. Assessment of omega-3 carboxylic acids in statin-treated patients with high levels of triglycerides and low levels of high-density lipoprotein cholesterol: Rationale and design of the STRENGTH trial. Clin Cardiol 2018; 41: 1281–1288.
- 31.
Mozaffarian D, Wu JH. Omega-3 fatty acids and cardiovascular disease: Effects on risk factors, molecular pathways, and clinical events. J Am Coll Cardiol 2011; 58: 2047–2067.
- 32.
Hiro T, Kimura T, Morimoto T, Miyauchi K, Nakagawa Y, Yamagishi M, et al. Effect of intensive statin therapy on regression of coronary atherosclerosis in patients with acute coronary syndrome: A multicenter randomized trial evaluated by volumetric intravascular ultrasound using pitavastatin versus atorvastatin (JAPAN-ACS (Japan assessment of pitavastatin and atorvastatin in acute coronary syndrome) study). J Am Coll Cardiol 2009; 54: 293–302.
- 33.
Okazaki S, Yokoyama T, Miyauchi K, Shimada K, Kurata T, Sato H, et al. Early statin treatment in patients with acute coronary syndrome: Demonstration of the beneficial effect on atherosclerotic lesions by serial volumetric intravascular ultrasound analysis during half a year after coronary event: The ESTABLISH Study. Circulation 2004; 110: 1061–1068.

