Abstract
Background: Microvascular reperfusion following percutaneous coronary intervention (PCI) is associated with the prognosis of patients with ST-segment elevation myocardial infarction (STEMI). We investigated how plaque characteristics detected by optical coherence tomography (OCT) in STEMI patients affect the status of the microcirculation during PCI.
Methods and Results: This retrospective, single-center study was a post hoc analysis basedon the multicenter SALVAGE randomized control trial (NCT03581513) that enrolled 629 STEMI patients, and finally we enrolled 235 patients who underwent PCI and pre-intervention OCT. Microvascular perfusion was evaluated using the Thrombolysis in Myocardial Infarction (TIMI) myocardial perfusion frame count (TMPFC). Patients were divided into 3 groups based on the change in TMPFC from before to after PCI: improving TMPFC (n=11; 4.7%), stable TMPFC (n=182; 77.4%), and worsening TMPFC group (n=42; 17.9%). The proportion of patients with a microcirculation dysfunction before reperfusion was 11.9%, which increased significantly by (P=0.079) 8.5% to 20.4% after reperfusion. Compared with plaque characteristics in the stable and worsening TMPFC groups, the improving TMPFC group had fewer thrombi (90.7% and 90.5% vs. 89.4%, respectively; P=0.018), a lower proportion of plaque rupture (66.5% and 66.3% vs. 54.5%, respectively; P=0.029), and a lower proportion of lipid-rich plaques (89.6% and 88.1% vs. 63.6%, respectively; P=0.036).
Conclusions: PCI may not always achieve complete myocardial reperfusion. Thrombi, plaque rupture, and lipid-rich plaques detected by OCT can indicate microcirculation dysfunction during the reperfusion period.
With the continuous development of medical technologies, such as emergency thrombolysis and percutaneous coronary intervention (PCI), the prognosis of acute ST-segment elevation myocardial infarction (STEMI) has been substantially improved. PCI can successfully restore coronary artery blood flow in epicardial arteries in over 95% of patients. However, in 50% of patients, microvascular perfusion in the distal coronary arteries is not completely restored, and long-term microvascular dysfunction predicts poor long-term outcomes and reduces the benefits of PCI for patients.1 In addition, patients with microvascular dysfunction after PCI have a high recurrence rate of angina pectoris and major adverse cardiovascular events (MACE).2 Moreover, changes in microcirculation function are related to myocardial damage and adverse outcomes.3,4 Therefore, predicting and preventing microvascular dysfunction during PCI is of considerable importance to improve the long-term prognosis of STEMI patients.
Editorial p 1633
Optical coherence tomography (OCT) is a high-resolution imaging modality that enables the observation of important morphological features of atherosclerotic plaques, such as thin-cap fibroatheroma (TCFA) or thrombus,5–7 and is widely used. Several studies have shown that lipid core length, TCFA, plaque burden analyzed by intravascular ultrasound, and vulnerable plaques may be associated with the occurrence of impaired coronary blood flow after PCI.8–13 However, few studies have focused on the dynamic changes from before to after PCI. Therefore, the aim of the present study was to investigate how coronary artery plaque characteristics detected by OCT affect dynamic changes in microvascular function during PCI in patients with STEMI.
Methods
Study Design and Patients
The present retrospective, single-center study was a post hoc analysis based on the Deferred or Immediate Stent Implantation Based on Microvascular Function in STEMI (SALVAGE) study (NCT03581513), a multicenter prospective randomized controlled trial that enrolled 629 patients with STEMI and intended for PCI with stent implantation. Eligible patients were randomly assigned to undergo immediate or delayed stenting with angiographic guidance in a 1 : 1 ratio if residual stenosis was >70% and with a Thrombolysis in Myocardial Infarction (TIMI) Grade 3 (specific inclusion and exclusion criteria are presented in the Supplementary File). Of the 629 patients in the SALVAGE study, 235 patients who underwent pre-intervention OCT examination were included in the present study. A flowchart of patient selection and subsequent patient grouping are shown in Figure 1.

This study was approved by the Ethics Committee of the Second Affiliated Hospital of Harbin Medical University (Reference no. KY2017-252). Given the retrospective nature of this study, the need for written informed consent was waived. The study was performed in accordance with the Declaration of Helsinki and the ethical standards of the responsible committee on human experimentation.
Coronary Angiography and OCT Procedure
Patients were given aspirin (300 mg), ticagrelor (180 mg), or clopidogrel (300 mg) orally and intravenous unfractionated heparin (100 IU/kg) before the procedure. After intracoronary administration of 100–200 mg nitroglycerin, a 6- or 7-Fr sheath was inserted via the radial or femoral artery for coronary angiography. The initial TIMI flow grade was measured by the treating cardiologist. Manual thrombus aspiration (using an export aspiration catheter; Medtronic Cardiovascular, Santa Rosa, CA, USA) was performed in cases of initial TIMI Grade ≤1 or extensive thrombus. Following the restoration of antegrade coronary flow, culprit lesions were imaged using frequency domain OCT.
Angiographic and Microcirculation Function Analysis
Angiographic data were analyzed offline in an independent core angiographic laboratory with a computer-based cardiovascular angiographic analysis system by 2 experienced angiographers who were blinded to all data apart from the coronary angiograms.
Quantitative Coronary Angiography (QCA) Analysis The Cardiovascular Angiography Analysis System (CAAS) 5.10 system (Pie Medical Imaging B.V., Maastricht, Netherlands) was used to perform a quantitative analysis of coronary angiography images. First, culprit and non-culprit vessels (e.g., left main artery, left anterior descending artery, left circumflex artery, and right coronary artery) were identified and their corresponding CASS segments were determined. The TIMI flow grade of the culprit or non-culprit vessels was evaluated at end-diastole. All measurements were made on the image with the least foreshortening, and at the frame with the optimal contrast opacification of the coronary artery at end-diastole. Calibrations were performed before starting the measurements. The quantitative parameters measured included lesion length, reference vessel diameter (RVD), minimum lumen diameter (MLD), and percentage diameter stenosis (DS%). RVD was defined as the diameter of the vessel at the diameter of the normal vessel approximately 5 mm proximal or distal to the narrowest segment of the lesion. MLD was defined as the diameter of the vessel at the site of the most severe narrowing within the lesion. DS% was calculated as (1 − MLD / RVD) × 100. Lesion length was measured from the normal vessel segment proximal to the target lesion to the normal segment distal to the target lesion. If thrombus aspiration was performed in the culprit vessel, measurement data obtained before intervention were used in subsequent statistical analyses.
Microvascular perfusion was assessed by the TIMI myocardial perfusion frame count (TMPFC).14,15 TMPFC is a new indicator for the quantitative evaluation of myocardial perfusion and is calculated by counting the number of frames showing contrast agent entering and exiting the myocardium.14,15 Briefly, the first frame of the TMPFC was defined as the frame that clearly showed the first appearance of myocardial blush beyond the infarct-related artery (IRA; F1). The last frame of the TMPFC was then defined as the frame in which the contrast or myocardial blush disappeared (F2). TMPFC was calculated by subtracting F1 from F2 minus at a filming rate of 15 frames/s, or as (F2 − F1) × 2 for a corrected filming rate of 30 frames/s. TMPFC ≥95.5 is regarded as the cut-off value for microcirculation dysfunction.16
OCT Analysis
The OCT image analysis method used a commercially available frequency domain OCT system (ILUMIEN OPTIS; Abbott Vascular, Santa Clara, CA, USA). The OCT results in this study were evaluated by 2 experienced investigators who were blinded to the clinical and angiographic data. OCT findings, such as plaque rupture, thrombus, calcification, TCFA, lipid-rich plaque, and lipid arc, were evaluated as reported previously.17
Ruptured plaques were defined as those in which the fibrous cap was not continuous and a cavity had formed within the plaque. Thrombus was defined as a mass protruding from the luminal surface of the vessel wall into the lumen. Lipid-rich plaques were defined as lesions with a lipid arc >180°. TCFAs were defined as lipid-rich plaques with a fibrous cap thickness <65μm. Lipid quantification was semiquantitative and based on the number of involved quadrants in cross-sectional images.5–7
Statistical Analysis
Continuous data are presented as the mean±SD or as the median with interquartile range (IQR). Continuous variables were compared between groups using either paired t-tests or the Wilcoxon rank-sum test, depending on data distribution, and categorical were compared between groups using a Chi-squared test or an exact probability test. Ordinal data were compared using the Wilcoxon rank-sum test. Statistical analyses were performed using SPSS 26.0 software (IBM Corp., Armonk, NY, USA). All statistical tests were 2-tailed and P<0.05 was considered statistically significant.
Results
In all, 235 STEMI patients who underwent PCI and pre-intervention OCT were included in the present retrospective study. TMPFC, angiographic, and OCT plaque characteristics were analyzed.
According to the changes in TMPFC from before to after PCI, patients were divided into 3 groups (Figure 1) as follows:
• improving TMPFC: TMPFC changed from ≥95.5 to ≤95.5 (n=11; 4.7%)
• stable TMPFC: TMPFC did not exceed the critical value (n=182; 77.4%)
• worsening TMPFC: TMPFC changed from ≤95.5 to ≥95.5, or from ≥95.5 to an even greater value (n=42; 17.9%).
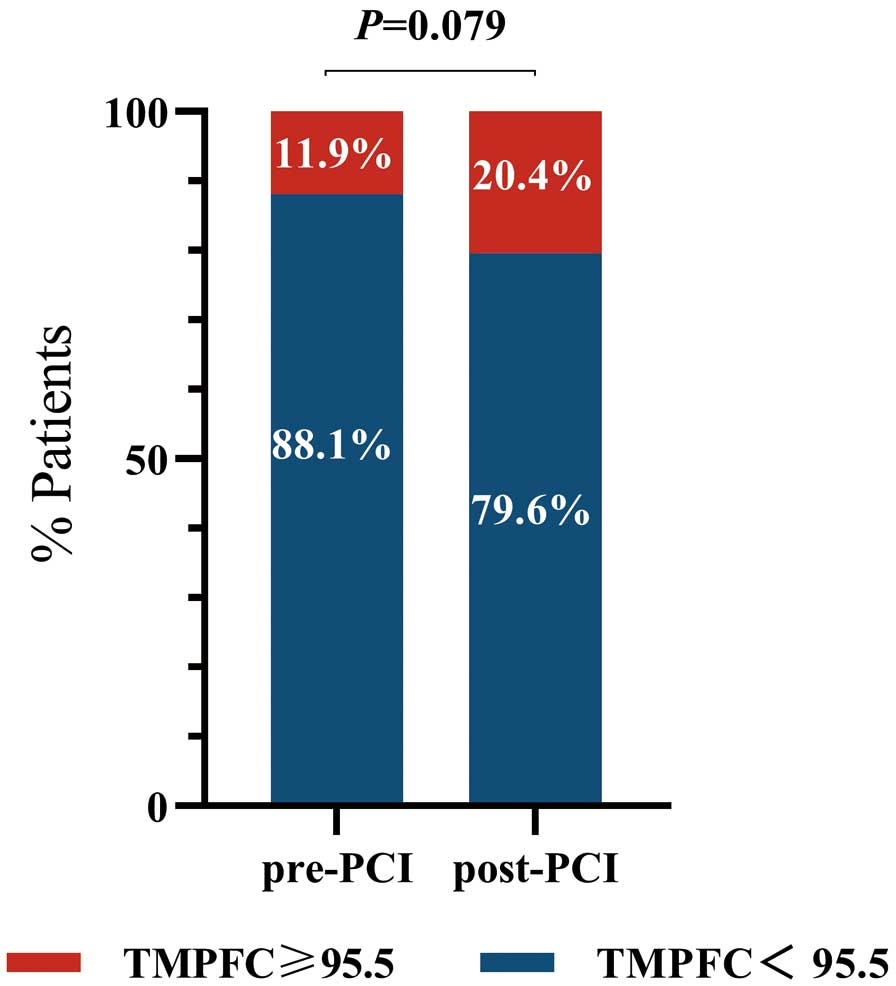
The incidence of pre-PCI microcirculation dysfunction was 11.9%, and this increased to 20.4% after PCI (P=0.079; Figure 2).
The baseline and clinical characteristics and laboratory results for the 3 TMPFC groups are presented in Table 1. The mean age of the enrolled patients was 59.0±9.8 years, 68.5% were male, 155 (66.0%) patients had a history of smoking history, and 41 (17.4%) patients had lipid abnormalities. There were no significant differences in baseline clinical characteristics among the improving, stable, and worsening TMPFC groups except for total cholesterol levels (4.5±0.9, 4.8±1.0 and 4.3±0.9 mmol/L, respectively; P=0.034).
Table 1.
Baseline Clinical Characteristics
| Variables |
All
(n=235) |
Improving TMPFC
(n=11) |
Stable TMPFC
(n=182) |
Worsening TMPFC
(n=42) |
P value |
| Male sex |
161 (68.5) |
8 (72.7) |
123 (67.6) |
30 (71.4) |
0.848 |
| Age (years) |
59.0±9.8 |
63.8±6.8 |
58.4±9.7 |
60.6±10.6 |
0.100 |
| Age >65 years |
73 (31.1) |
6 (54.5) |
51 (28.0) |
16 (38.1) |
0.101 |
| BMI (kg/m2) |
24.8±3.5 |
24.2±3.8 |
25.0±3.6 |
24.1±2.7 |
0.254 |
| Coronary risk factors |
| Diabetes |
42 (17.9) |
0 |
36 (19.8) |
6 (14.3) |
0.076 |
| Dyslipidemia |
145 (61.7) |
5 (45.5) |
117 (64.3) |
23 (54.8) |
0.273 |
| Current smoker |
105 (44.7) |
5 (45.5) |
79 (43.4) |
21 (50.0) |
0.740 |
| Hypertension |
101 (43.0) |
5 (45.5) |
76 (41.8) |
20 (47.6) |
0.776 |
| CKD |
5 (2.1) |
0 |
3 (1.7) |
2 (4.8) |
0.423 |
| Laboratory findings |
| TC (mmol/L) |
4.7±1.0 |
4.5±0.9 |
4.8±1.0 |
4.3±0.9 |
0.034 |
| Triglyceride (mmol/L) |
1.5±0.9 |
1.3±0.7 |
1.6±0.9 |
1.3±0.6 |
0.082 |
| LDL-C (mmol/L) |
2.9±0.9 |
2.9±0.8 |
3.0±0.9 |
2.8±0.8 |
0.330 |
| HDL-C (mmol/L) |
1.3±0.3 |
1.3±0.3 |
1.3±0.3 |
1.2±0.3 |
0.265 |
| TC/HDL ratio |
3.9±1.1 |
3.6±0.9 |
3.9±1.1 |
3.7±0.9 |
0.394 |
| cTnI (mg/L ) |
63.8
[28.9–158.5] |
55.8
[20.2–114.7] |
64.1
[28.9–158.6] |
63.9
[31.8–160.5] |
0.248 |
| Peak CK (U/L) |
2,108.0
[1,159.0–3,502.0] |
1,948.0
[779.0–4,063.0] |
2,072.5
[1,158.8–3,414.3] |
2,209.0
[1,363.0–4,655.0] |
0.603 |
| Peak CK-MB (U/L) |
222.5
[114.1–380.0] |
224.9
[88.7–479.2] |
219.1
[112.7–379.4] |
231.9
[139.7–450.6] |
0.501 |
| HbAlc (%) |
6.4±1.5 |
5.9±0.8 |
6.5±1.6 |
6.1±1.1 |
0.162 |
| hs-CRP (mg/L) |
3.3 [1.8–7.6] |
5.0 [1.9–7.6] |
3.3 [1.8–6.7] |
3.4 [1.5–8.8] |
0.586 |
| LVEF (%) |
57.4±6.7 |
54.8±10.3 |
57.8±6.6 |
57.2±5.8 |
0.396 |
| Medication at the time of admission |
| Aspirin |
231 (99.1) |
11 (100.0) |
179 (99.4) |
41 (97.6) |
0.488 |
| DAPT |
231 (98.3) |
11 (100.0) |
179 (98.4) |
41 (97.6) |
0.857 |
| Statins |
229 (98.7) |
11 (100.0) |
176 (98.3) |
42 (100.0) |
0.638 |
Unless indicated otherwise, values are given as the mean±SD, median [interquartile range], or n (%). P<0.05 was considered statistically significant. BMI, body mass index; CK, creatine kinase; CK-MB, creatine kinase MB fraction; CKD, chronic kidney disease; cTnI, cardiac troponin I; DAPT, dual antiplatelet therapy; HDL-C, high-density lipoprotein cholesterol; hs-CRP, high sensitivity C-reactive protein; LDL-C, low-density lipoprotein cholesterol; LVEF, left ventricular ejection fraction; TC, total cholesterol; TMPFC, Thrombolysis in Myocardial Infarction myocardial perfusion frame count.
The results of angiography and procedural characteristics are presented in Table 2. There were no significant differences among the 3 groups in terms of the culprit vessel, lesion location, interventional procedure, and results of the QCA analysis.
Table 2.
Procedural Characteristics, Angiographic Findings, and Clinical Results
| Variables |
All
(n=235) |
Improving TMPFC
(n=11) |
Stable TMPFC
(n=182) |
Worsening TMPFC
(n=42) |
P value |
| Culprit vessel |
|
|
|
|
0.259 |
| LAD |
113 (48.1) |
4 (36.4) |
94 (51.6) |
15 (35.7) |
|
| LCX |
21 (8.9) |
1 (9.1) |
17 (9.3) |
3 (7.1) |
|
| RCA |
101 (43.0) |
6 (54.5) |
71 (39.0) |
24 (57.1) |
|
| Distance to ostium |
|
|
|
|
0.943 |
| Proximal |
90 (30.3) |
4 (36.4) |
70 (38.5) |
16 (38.1) |
|
| Middle |
105 (44.7) |
5 (45.5) |
83 (45.6) |
17 (40.5) |
|
| Distal |
40 (17.0) |
2 (18.2) |
29 (15.9) |
9 (21.4) |
|
| Multivessel disease |
160 (68.1) |
6 (54.5) |
122 (67.0) |
32 (76.2) |
0.341 |
| Procedure |
| DTB time (min) |
71.4±47.9 |
52.1±14.5 |
74.37±52.0 |
63.6±30.0 |
0.290 |
| OTD time (min) |
296.4±152.8 |
332.6±164.3 |
287.5±149.4 |
325.43±162.9 |
0.252 |
| STR (mV) |
0.3±0.2 |
0.2±0.1 |
0.3±0.2 |
0.3±0.3 |
0.577 |
| STR >70% |
92 (39.1) |
3 (27.3) |
72 (39.6) |
17 (40.5) |
0.706 |
| Thrombolysis |
15 (6.4) |
1 (9.1) |
11 (6.1) |
3 (7.1) |
0.910 |
| Thrombectomy |
197 (83.8) |
10 (90.9) |
155 (85.2) |
32 (76.2) |
0.293 |
| Successful thrombus aspiration |
197 (83.8) |
10 (90.9) |
155 (85.2) |
32 (76.2) |
0.293 |
| Predilation |
106 (50.0) |
7 (63.6) |
79 (47.9) |
20 (55.6) |
0.458 |
| Post-dilation |
107 (50.7) |
4 (36.4) |
84 (51.2) |
19 (52.8) |
0.611 |
| Initial TIMI Grade ≤1 |
138 (58.7) |
7 (63.6) |
108 (59.3) |
23 (54.8) |
0.815 |
| ACC/AHA classification B2/C |
202 (86.0) |
11 (100.0) |
153 (84.1) |
38 (90.5) |
0.218 |
| Maximum stent diameter (mm) |
3.2±0.4 |
3.2±0.3 |
3.2±0.4 |
3.3±0.5 |
0.647 |
| Total stent length (mm) |
30.0±13.2 |
27.4±12.6 |
31.0±13.8 |
26.5±10.3 |
0.117 |
Maximum expansion pressure
(atm) |
15.3±4.3 |
14.9±3.6 |
15.4±4.4 |
15.2±4.1 |
0.933 |
| QCA analysis |
| RVD (mm) |
2.7±0.8 |
2.9±0.5 |
2.7±0.9 |
2.9±0.7 |
0.425 |
| MLD (mm) |
0.9±0.8 |
0.7±0.2 |
0.9±0.9 |
0.8±0.7 |
0.267 |
| DS (%) |
78.0±6.8 |
78.0±4.2 |
77.6±7.1 |
79.8±5.8 |
0.242 |
| Lesion length (mm) |
22.1±8.1 |
22.0±8.8 |
21.6±8.2 |
24.1±7.5 |
0.272 |
Unless indicated otherwise, values are given as the mean±SD or n (%). P<0.05 was considered statistically significant. ACC, American College of Cardiology; AHA, American Heart Association; DS, diameter stenosis; DTB, door-to-balloon; LAD, left anterior descending artery; LCX, left circumflex artery; MLD, minimum lumen diameter; OTD, onset to device; QCA, quantitative coronary angiography; RCA, right coronary artery; RVD, reference vessel diameter; STR, ST-segment resolution; TIMI, Thrombolysis in Myocardial Infarction; TMPFC, TIMI myocardial perfusion frame count.
The OCT results are shown in Figure 3. Compared with plaque characteristics in the stable and worsening TMPFC groups, the improving TMPFC group had less intracoronary thrombosis (90.7% and 90.5% vs. 89.4%, respectively; P=0.018), a lower plaque rupture rate (66.5% and 66.3% vs. 54.5%, respectively; P=0.029), and fewer lipid-rich plaques (89.6% and 88.1% vs. 63.6%, respectively; P=0.036; Table 3).

Table 3.
OCT Findings
| Variables |
All
(n=235) |
Improving TMPFC
(n=11) |
Stable TMPFC
(n=182) |
Worsening TMPFC
(n=42) |
P value |
| OCT analysis |
| Lesion length (mm) |
25.2±7.6 |
26.3±7.1 |
25.3±8.0 |
24.4±5.9 |
0.720 |
| Reference lumen area (mm2) |
| Proximal |
8.7±2.9 |
9.9±2.2 |
8.6±3.0 |
8.7±2.5 |
0.374 |
| Distal |
6.2±2.6 |
7.1±2.4 |
6.1±2.7 |
6.4±2.3 |
0.404 |
| MLA (mm2) |
1.2±0.4 |
1.2±0.3 |
1.2±0.4 |
1.3±0.5 |
0.343 |
| AS (%) |
82.4±7.5 |
84.7±4.6 |
82.4±7.6 |
81.9±8.1 |
0.558 |
| Culprit lesion |
|
|
|
|
0.029 |
| Plaque rupture |
154 (65.5) |
6 (54.5) |
121 (66.5) |
27 (64.3) |
|
| Plaque erosion |
66 (28.1) |
2 (18.2) |
54 (29.7) |
10 (23.8) |
|
| Calcified nodule |
7 (3.0) |
1 (9.0) |
3 (1.6) |
3 (7.1) |
|
| Thrombus |
210 (89.4) |
7 (63.6) |
165 (90.7) |
38 (90.5) |
0.018 |
| Lipid-rich plaques |
| Thinnest FCT (μm) |
0.08±0.04 |
0.08±0.06 |
0.08±0.04 |
0.08±0.04 |
0.994 |
| Mean FCT (μm) |
0.12±0.05 |
0.12±0.06 |
0.12±0.05 |
0.12±0.05 |
0.762 |
| Mean lipid arc (°) |
243.1±84.3 |
200.3±101.9 |
243.8±79.8 |
251.4±96.8 |
0.199 |
| Maximum lipid arc (°) |
315.5±98.9 |
217.2±144.9 |
319.8±91.1 |
309.9±110.3 |
0.267 |
| Lipid core length (mm) |
13.0±8.4 |
13.5±9.7 |
13.2±8.5 |
12.4±7.9 |
0.850 |
| Lipid index |
3,146.8
[1,781.2–4,709.9] |
2,586.1
[1,157.3–5,987.6] |
3,151.8
[1,926.3–4,611.6] |
3,145.4
[1,765.2–5,005.0] |
0.969 |
| LRP |
207 (88.1) |
7 (63.6) |
163 (89.6) |
37 (88.1) |
0.036 |
| TCFA |
120 (51.1) |
5 (45.5) |
93 (51.1) |
22 (52.4) |
0.920 |
| Cholesterol crystal |
118 (50.2) |
4 (36.4) |
91 (50.0) |
23 (54.8) |
0.550 |
| Macrophage |
135 (57.7) |
3 (27.3) |
109 (60.2) |
23 (54.8) |
0.091 |
| Microchannel |
24 (10.2) |
0 |
19 (10.4) |
5 (11.9) |
0.498 |
| Spotty calcium |
73 (31.2) |
2 (18.2) |
58 (32.0) |
13 (31.0) |
0.628 |
| Calcification |
97 (41.3) |
3 (27.3) |
75 (41.2) |
19 (45.2) |
0.559 |
| Thrombus type |
|
|
|
|
0.470 |
| White |
145 (69.0) |
4 (57.1) |
112 (67.9) |
29 (76.3) |
|
| Red |
65 (31.0) |
3 (42.9) |
53 (32.1) |
9 (23.7) |
|
Unless indicated otherwise, values are given as the mean±SD, median [interquartile range], or n (%). P<0.05 was considered statistically significant. AS, area stenosis; FCT, fibrous cap thickness; LRP, lipid-rich plaque; MLA, minimum lumen area; OCT, optical coherence tomography; TCFA, thin-cap fibroatheroma; TMPFC, Thrombolysis in Myocardial Infarction myocardial perfusion frame count.
Discussion
This retrospective study included 235 STEMI patients who underwent PCI and pre-intervention OCT and analyzed the relationship between plaque vulnerability features and dynamic changes in microcirculation function before and after reperfusion. The main findings of the study are as follows: (1) the proportion of STEMI patients with microcirculation dysfunction increased from 11.4% before PCI to 20.4% after PCI; and (2) OCT detection of intracoronary thrombosis, plaque rupture, and lipid-rich plaques was associated with an increased risk of microcirculation dysfunction during reperfusion.
Incidence of Microcirculation Dysfunction During Reperfusion
Current clinical guidelines recommend PCI as the preferred method for reperfusion therapy in STEMI patients.18 In the present study, the proportion of patients with microcirculation dysfunction increased to 20.4% after PCI, compared with 11.4% before PCI, suggesting that the PCI process does not always improve myocardial perfusion and that microcirculation dysfunction may worsen in certain types of lesions. De Maria et al19 used the index of microcirculatory resistance (IMR) to measure microcirculation function in 85 STEMI patients and compared changes in microcirculation function before and after stent implantation. In that study, stent implantation was shown to improve microcirculation function. However, one-third of patients in that study still had microcirculation dysfunction after PCI, and the main disease characteristics of these patients were a longer ischemic time and larger thrombus load,19 which is consistent with the findings in the present study. PCI does not completely improve myocardial perfusion in STEMI, and although the opening of epicardial vessels effectively improves epicardial perfusion, it is not always ideal for improving myocardial reperfusion. Therefore, for further myocardial protection in STEMI patients, attention should focus on the characteristics of the lesions themselves, and personalized preventive and protective measures should be taken.
Relationship Between Worsening TMPFC and Vulnerable Plaque Characteristics
In this study we used OCT to evaluate the characteristics of vulnerable plaques in patients with acute myocardial infarction, and investigated the relationship between these characteristics and changes in microcirculation function during reperfusion. We found that 3 key plaque characteristics, namely thrombus, plaque rupture, and lipid-rich plaques, were associated with microcirculation dysfunction. The incidence of all 3 characteristics was significantly higher in the stable and worsening TMPFC groups than in the improving TMPFC group, and the presence of thrombus, plaque rupture, and lipid-rich plaques in culprit lesions of STEMI patients may indicate further deterioration of microvascular function during reperfusion.
The formation of a thrombus following the rupture of vulnerable plaques is an important pathogenic mechanism of acute myocardial infarction.20 The contents of the larger necrotic core released after plaque rupture include fibrous proteins and platelets that promote thrombus formation, which can serve as a substrate for the formation of large red thrombi.6,21,22 This increases the risk of distal microvascular embolism and promotes rapid deterioration of microcirculation function.23,24 In addition, lipid-rich plaques have a larger necrotic core containing many vulnerable components, such as foam cell lipid deposits, intraplaque hemorrhage, or cholesterol crystals. These components are usually separated from the vascular lumen by a thin fibrous cap and are easily damaged during coronary stent implantation, leading to thrombus formation, which is released as tiny emboli.
Previous studies have shown that thrombus detachment leading to distal microvascular embolization is an important cause of microvascular dysfunction after PCI.25–27 It has been reported that suspicious necrotic core components are related to the release of small embolic particles during coronary stent implantation.27 Virtual histology intravascular ultrasound evaluation of plaque necrotic core components has also been shown to be independently correlated with the release of embolic particles during stent implantation.28 Kawamoto et al27 confirmed a close correlation between the number of embolic particles released from the necrotic core during PCI and postoperative microvascular dysfunction using high-intensity transient signals. The release of necrotic core components is a precursor to microvascular distal embolism and postoperative microvascular dysfunction.28 The results of these previous studies reveal the critical role of coronary thrombus, necrotic core, and plaque rupture in the deterioration of microvascular function, and are consistent with the finding of the present study.
Other studies have shown that in STEMI patients a larger CK-AUC or larger myocardial infarction areas evaluated by cardiac magnetic resonance imaging after PCI are closely related to the occurrence of plaque rupture,12,29,30 which further confirm the conclusions of the present study from a cardiac imaging perspective. The results of the present study indicate that the presence of vulnerable plaques, including plaque rupture and lipid-rich plaques, increases the risk of thrombus formation and distal microvascular embolization during interventional procedures, thus greatly increasing the risk of post-PCI microcirculation dysfunction.
Future Recommendations
The findings of this study have significant implications for clinical diagnosis and treatment; specifically, for STEMI patients with vulnerable plaques that may rupture, lipid-rich plaques, and thrombi, more protective measures are needed before PCI to prevent postoperative microcirculation dysfunction. These measure could include the intracoronary administration of glycoprotein IIb/IIIa receptor antagonists, nitroprusside, verapamil, or nicardipine.31,32 Using OCT to identify vulnerable plaques based on their characteristics will also have an important guiding role to protect microcirculation function during reperfusion. OCT is expected to become a useful tool for preventing microcirculation dysfunction in STEMI patients during the reperfusion period, such that individualized intervention strategies or protective measures can be implemented before starting PCI to prevent microcirculation dysfunction and to strive for early protection of the myocardium, thus improving the long-term prognosis of patients.
Study Limitations
This study has several limitations. First, the patients in this study were from a prospective multicenter randomized controlled trial, which may have some selection bias. Second, the sample size of the improving TMPFC group was small, which limits the statistical power of the analyses. Further experimental validation is needed with a larger sample size and more generalizable patients such as ACS patients. Third, although cardiac magnetic resonance imaging has advantages in evaluating myocardial reperfusion injury, in the present study we used a new developed quantitative index (TMPFC) to analyze coronary microcirculation function, which can quantify TIMI Myocardial Perfusion Grading (TMPG) and objectively evaluate myocardial perfusion. The accuracy and feasibility of this index have been validated in previous studies, and it is simple and easy to use.14,15 In future research, if experimental conditions permit, more accurate methods and larger sample sizes can be used for further investigation.
Conclusions
PCI is not universally associated with improvements in the myocardial microcirculation. Thrombosis, plaque rupture, and lipid plaques detected by OCT are associated with poor microcirculation perfusion after PCI.
Acknowledgments
The authors gratefully acknowledge all those who took part in this study.
Sources of Funding
This work was supported by the National Key R&D Program of China (Grant no. 2016YFC1301100 to B.Y., 2016YFC1301104 to B.Y.), the National Natural Science Foundation of China (Grant no. 81827806 to B.Y.), and the Natural Science Foundation of Heilongjiang Province (Grant no. TD2020H001 to B.Y.).
Disclosures
B.Y. is a member of Circulation Journal’s Editorial Team. The remaining authors declare no conflicts of interest.
IRB Information
This study was approved by the Ethics Committee of the Second Affiliated Hospital of Harbin Medical University (Reference no. 32).
Data Availability
The deidentified participant data will not be shared.
Supplementary Files
Please find supplementary file(s);
https://doi.org/10.1253/circj.CJ-23-0200
References
- 1.
Niccoli G, Montone RA, Ibanez B, Thiele H, Crea F, Heusch G, et al. Optimized treatment of ST-elevation myocardial infarction. Circ Res 2019; 125: 245–258.
- 2.
Montone RA, Vetrugno V, Santacroce G, Del Buono MG, Meucci MC, Camilli M, et al. Recurrence of angina after ST-segment elevation myocardial infarction: The role of coronary microvascular obstruction. Eur Heart J Acute Cardiovasc Care 2019, doi:10.1177/2048872619880661.
- 3.
Chan W, Stub D, Clark DJ, Ajani AE, Andrianopoulos N, Brennan AL, et al. Usefulness of transient and persistent no-reflow to predict adverse clinical outcomes following percutaneous coronary intervention. Am J Cardiol 2012; 109: 478–485.
- 4.
Porto I, Belloni F, Niccoli G, Larosa C, Leone AM, Burzotta F, et al. Filter no-reflow during percutaneous coronary intervention of saphenous vein grafts: Incidence, predictors and effect of the type of protection device. EuroIntervention 2011; 7: 955–961.
- 5.
Kubo T, Imanishi T, Takarada S, Kuroi A, Ueno S, Yamano T, et al. Assessment of culprit lesion morphology in acute myocardial infarction: Ability of optical coherence tomography compared with intravascular ultrasound and coronary angioscopy. J Am Coll Cardiol 2007; 50: 933–939.
- 6.
Jia H, Abtahian F, Aguirre AD, Lee S, Chia S, Lowe H, et al. In vivo diagnosis of plaque erosion and calcified nodule in patients with acute coronary syndrome by intravascular optical coherence tomography. J Am Coll Cardiol 2013; 62: 1748–1758.
- 7.
Higuma T, Soeda T, Yamada M, Yokota T, Yokoyama H, Izumiyama K, et al. Does residual thrombus after aspiration thrombectomy affect the outcome of primary PCI in patients with ST-segment elevation myocardial infarction?: An optical coherence tomography study. JACC Cardiovasc Interv 2016; 9: 2002–2011.
- 8.
Gamou T, Sakata K, Matsubara T, Yasuda T, Miwa K, Inoue M, et al. Impact of thin-cap fibroatheroma on predicting deteriorated coronary flow during interventional procedures in acute as well as stable coronary syndromes: Insights from optical coherence tomography analysis. Heart Vessels 2015; 30: 719–727.
- 9.
Ozaki Y, Tanaka A, Tanimoto T, Kitabata H, Kashiwagi M, Kubo T, et al. Thin-cap fibroatheroma as high-risk plaque for microvascular obstruction in patients with acute coronary syndrome. Circ Cardiovasc Imaging 2011; 4: 620–627.
- 10.
Tanaka A, Imanishi T, Kitabata H, Kubo T, Takarada S, Tanimoto T, et al. Lipid-rich plaque and myocardial perfusion after successful stenting in patients with non-ST-segment elevation acute coronary syndrome: An optical coherence tomography study. Eur Heart J 2009; 30: 1348–1355.
- 11.
Ikenaga H, Ishihara M, Inoue I, Kawagoe T, Shimatani Y, Miura F, et al. Longitudinal extent of lipid pool assessed by optical coherence tomography predicts microvascular no-reflow after primary percutaneous coronary intervention for ST-segment elevation myocardial infarction. J Cardiol 2013; 62: 71–76.
- 12.
Satogami K, Ino Y, Kubo T, Tanimoto T, Orii M, Matsuo Y, et al. Impact of plaque rupture detected by optical coherence tomography on transmural extent of infarction after successful stenting in ST-segment elevation acute myocardial infarction. JACC Cardiovasc Interv 2017; 10: 1025–1033.
- 13.
Usui E, Yonetsu T, Kanaji Y, Hoshino M, Yamaguchi M, Hada M, et al. Optical coherence tomography-defined plaque vulnerability in relation to functional stenosis severity and microvascular dysfunction. JACC Cardiovasc Interv 2018; 11: 2058–2068.
- 14.
Ding S, Pu J, Qiao Z, Shan, Song W, Du Y, et al. TIMI myocardial perfusion frame count: A new method to assess myocardial perfusion and its predictive value for short-term prognosis. Catheter Cardiovasc Interv 2010; 75: 722–732.
- 15.
Pu J, Ding S, Ge H, Han Y, Guo J, Lin R, et al. Efficacy and safety of a pharmaco-invasive strategy with half-dose alteplase versus primary angioplasty in ST-segment-elevation myocardial infarction: EARLY-MYO trial (Early Routine Catheterization After Alteplase Fibrinolysis Versus Primary PCI in Acute ST-Segment-Elevation Myocardial Infarction). Circulation 2017; 136: 1462–1473.
- 16.
Ge H, Ding S, An D, Li Z, Ding H, Yang F, et al. Frame counting improves the assessment of post-reperfusion microvascular patency by TIMI myocardial perfusion grade: Evidence from cardiac magnetic resonance imaging. Int J Cardiol 2016; 203: 360–366.
- 17.
Tearney GJ, Regar E, Akasaka T, Adriaenssens T, Barlis, Bezerra HG, et al. Consensus standards for acquisition, measurement, and reporting of intravascular optical coherence tomography studies: A report from the International Working Group for Intravascular Optical Coherence Tomography Standardization and Validation. J Am Coll Cardiol 2012; 59: 1058–1072.
- 18.
Ibanez B, James S, Agewall S, Antunes MJ, Bucciarelli-Ducci C, Bueno H, et al. 2017 ESC guidelines for the management of acute myocardial infarction in patients presenting with ST-segment elevation: The Task Force for the Management of Acute Myocardial Infarction in Patients Presenting with ST-segment Elevation of the European Society of Cardiology (ESC). Eur Heart J 2018; 39: 119–177.
- 19.
De Maria GL, Cuculi F, Patel N, Dawkins S, Fahrni G, Kassimis G, et al. How does coronary stent implantation impact on the status of the microcirculation during primary percutaneous coronary intervention in patients with ST-elevation myocardial infarction? Eur Heart J 2015; 36: 3165–3177.
- 20.
DeWood MA, Spores J, Notske R, Mouser LT, Burroughs R, Golden MS, et al. Prevalence of total coronary occlusion during the early hours of transmural myocardial infarction. N Engl J Med 1980; 303: 897–902.
- 21.
Hu S, Zhu Y, Zhang Y, Dai J, Li L, Dauerman H, et al. Management and outcome of patients with acute coronary syndrome caused by plaque rupture versus plaque erosion: An intravascular optical coherence tomography study. J Am Heart Assoc 2017; 6: e004730, doi:10.1161/JAHA.116.004730.
- 22.
Cao M, Zhao L, Ren X, Wu T, Yang G, Du Z, et al. Pancoronary plaque characteristics in STEMI caused by culprit plaque erosion versus rupture: 3-Vessel OCT study. JACC Cardiovasc Imaging 2021; 14: 1235–1245.
- 23.
Sato Y, Hatakeyama K, Yamashita A, Marutsuka K, Sumiyoshi A, Asada Y. Proportion of fibrin and platelets differs in thrombi on ruptured and eroded coronary atherosclerotic plaques in humans. Heart 2005; 91: 526–530.
- 24.
Burke AP, Farb A, Malcom GT, Liang Y, Smialek J, Virmani R. Effect of risk factors on the mechanism of acute thrombosis and sudden coronary death in women. Circulation 1998; 97: 2110–2116.
- 25.
Kotani J, Nanto S, Mintz GS, Kitakaze M, Ohara T, Morozumi T, et al. Plaque gruel of atheromatous coronary lesion may contribute to the no-reflow phenomenon in patients with acute coronary syndrome. Circulation 2002; 106: 1672–1677.
- 26.
Katayama Y, Taruya A, Kashiwagi M, Ozaki Y, Shiono Y, Tanimoto T, et al. No-reflow phenomenon and in vivo cholesterol crystals combined with lipid core in acute myocardial infarction. Int J Cardiol Heart Vasc 2022; 38: 100953.
- 27.
Kawamoto T, Okura H, Koyama Y, Toda I, Taguchi H, Tamita K, et al. The relationship between coronary plaque characteristics and small embolic particles during coronary stent implantation. J Am Coll Cardiol 2007; 50: 1635–1640.
- 28.
Ohshima K, Ikeda S, Kadota H, Yamane K, Izumi N, Ohshima K, et al. Impact of culprit plaque volume and composition on myocardial microcirculation following primary angioplasty in patients with ST-segment elevation myocardial infarction: Virtual histology intravascular ultrasound analysis. Int J Cardiol 2013; 167: 1000–1005.
- 29.
Kusama I, Hibi K, Kosuge M, Nozawa N, Ozaki H, Yano H, et al. Impact of plaque rupture on infarct size in ST-segment elevation anterior acute myocardial infarction. J Am Coll Cardiol 2007; 50: 1230–1237.
- 30.
Hayashi T, Kiyoshima T, Matsuura M, Ueno M, Kobayashi N, Yabushita H, et al. Plaque erosion in the culprit lesion is prone to develop a smaller myocardial infarction size compared with plaque rupture. Am Heart J 2005; 149: 284–290.
- 31.
Matsuo H, Watanabe S, Watanabe T, Warita S, Kojima T, Hirose T, et al. Prevention of no-reflow/slow-flow phenomenon during rotational atherectomy: A prospective randomized study comparing intracoronary continuous infusion of verapamil and nicorandil. Am Heart J 2007; 154: 994.e1–e6.
- 32.
Shinozaki N, Ichinose H, Yahikozawa K, Shimada H, Hoshino K. Selective intracoronary administration of nitroprusside before balloon dilatation prevents slow reflow during percutaneous coronary intervention in patients with acute myocardial infarction. Int Heart J 2007; 48: 423–433.