Abstract
Background: Endothelial dysfunction and increased left ventricular (LV) stiffness are associated with the incidence of heart failure with preserved ejection fraction (HFpEF). This study evaluated the association between endothelial dysfunction and LV diastolic stiffness.
Methods and Results: Endothelial dysfunction evaluated by flow-medicated vasodilation (FMD) and the reactive hyperemia index (RHI), which reflects endothelial dysfunction in the microvasculature, was measured in 112 subjects with hypertension in the Flow-Mediated Dilation Japan (FMD-J) study. Using transthoracic echocardiography, LV diastolic stiffness was evaluated by measuring diastolic wall strain (DWS) in the LV posterior wall. In this cross-sectional study, associations among FMD, RHI, and DWS were investigated using multiple regression analyses. The mean (±SD) age of the subjects 65±9 years, and 63% were men. DWS was significantly associated with RHI, but not FMD, on multivariate linear regression analysis (β=0.39; P<0.0001). This association was preserved in subjects without LV hypertrophy (β=0.46; P<0.0001). A DWS ≤median, suggesting increased LV diastolic stiffness, was significantly associated with RHI on multivariate logistic regression analysis (odds ratio 20.58; 95% confidence interval 4.83–87.63; P<0.0001). The receiver operating characteristic curve presented a cut-off value of 2.21 for RHI, with a sensitivity of 77% and a specificity of 71%, for DWS ≤median.
Conclusions: RHI, rather than FMD, was associated with DWS. Endothelial dysfunction in the microvasculature may be associated with increased LV diastolic stiffness.
With the current increase in the older population, heart failure (HF) with preserved ejection fraction (HFpEF), which develops from increased left ventricular (LV) stiffness, is a crucial and increasing public health problem. The pathophysiology of HFpEF is complex, but increased LV diastolic stiffness is thought to play a key role in many patients.1 The Doppler indices of diastolic stiffness do not directly reflect the slope of the LV end-diastolic pressure-volume relationship that is obtained by invasive measurement.2 Recently, indices based on the laws of physics have been shown to represent a more direct measure of myocardial stiffness. Diastolic wall strain (DWS) is based on the linear elastic theory, which predicts that in the presence of a preserved ejection fraction, impaired diastolic wall thinning reflects resistance to deformation in diastole, and thus increased diastolic myocardial stiffness. In rat models, DWS was correlated with the diastolic stiffness constant measured invasively.3 In a community-based cohort of HFpEF patients, low DWS was associated with high rates of death and HF hospitalization. DWS, which is a simple index, is useful for assessing LV diastolic stiffness.4
Endothelial dysfunction occurs as the initial step in the pathogenesis of atherosclerosis, and plays a crucial role in its progression.5,6 Measurement of flow-mediated vasodilation (FMD) and determining the reactive hyperemia index (RHI) by peripheral arterial tonometry have become widely used techniques for the assessment of vascular endothelial function. FMD reflects endothelial function in the conduit arteries and RHI reflects endothelial function in the peripheral resistance arterioles.7,8 The significance of evaluating endothelial dysfunction using FMD or RHI is due to the crucial role of endothelial dysfunction in the development of atherosclerotic cardiovascular diseases.9 Moreover, endothelial dysfunction may modulate cardiac loading conditions, which may also affect the risk of HF.10 Although it has been reported that patients with symptomatic HF have concomitant endothelial dysfunction,11,12 less is known regarding whether endothelial dysfunction is associated with the incidence of preclinical cardiac disorders of HF, such as increased LV diastolic stiffness.
Thus, we sought to determine whether LV diastolic stiffness evaluated by DWS is correlated with endothelial dysfunction, as evaluated by FMD and RHI, in subjects with atherosclerotic risk factors.
Methods
Subjects
This study was conducted using data of subjects from the Flow-Mediated Dilation Japan (FMD-J) study. The FMD-J study was a prospective multicenter study in Japan to investigate the usefulness of the assessment of FMD for the management of patients at risk of cardiovascular disease. Detailed information on the subjects and FMD-J study protocol has been published previously.13,14 Patients aged 20–80 years with controlled hypertension who had been receiving antihypertensive treatment for at least 6 months and who did not have any history of ischemic heart diseases were enrolled in FMD-J study; of these patients, those who also underwent transthoracic echocardiography (TTE) at Tokyo Medical University Hospital (n=112) were enrolled in the present study. Some of the data from the FMD-J study have been reported elsewhere.14
This study was conducted in accordance with the Declaration of Helsinki. The study protocol was approved by the Ethic Committee of Tokyo Medical University Hospital (Approval no. T2021-304). Written informed consent was obtained from all subjects.
Measurements of Endothelial Function
Subjects fasted the previous night and abstained from alcohol, smoking, caffeine, and antioxidant vitamins on the day of the FMD and RHI examinations. Subjects were kept in the supine position in a quiet, dark, air-conditioned room (constant temperature of 23–26℃) throughout the study. FMD was measured after at least 20 min of maintaining the supine position. The sonographers were blinded to the details of the examination. A 10-MHz linear array ultrasound transducer (UNEXEF 18G; UNEX Co. Ltd., Nagoya, Japan) was placed on the proximal right brachial artery to measure FMD, and the manchette was placed on the forearm. For FMD measurement, longitudinal ultrasound images were recorded at baseline and continuously from 30 s before to 2 min or longer after cuff deflation, following compression for 5 min with a cuff pressure that was 50 mmHg above the systolic blood pressure of the right forearm. The diastolic diameter of the brachial artery was determined semiautomatically using an instrument equipped with software for measuring brachial artery diameter. FMD was estimated as the percentage change in the brachial artery diameter at maximum dilation during observation compared with the baseline value.
For the RHI measurement, a peripheral arterial tonometry probe (EndoPAT-2000; Itamar Medical Ltd., Caesarea, Israel) was placed on the right index finger, and a control tonometry probe was placed on the left index finger to eliminate sympathetic nerve effects. The peripheral arterial tonometry probes were exchanged for each patient. The RHI value was calculated as the ratio of the reactive hyperemia between the 2 hands. All recordings obtained during the measurement of FMD and RHI were individually analyzed by a well-experienced reader at Tokyo Medical University Hospital who did not have any information about the subjects.
Measurement of Pulse Wave Velocity (PWV) and Augmentation Index
The brachial-ankle PWV was measured using a volume-plethysmographic apparatus (Form/ABI; Omron Healthcare Co., Ltd., Kyoto, Japan), as described previously.15 Measurements were conducted after the subjects had rested for at least 5 min in the supine position, in a temperature-controlled room (23–26℃) designed exclusively for this purpose. Measurement of the radial augmentation index was conducted after the subjects had rested for at least 5 min in a seated position. The left radial arterial waveform was recorded using an arterial applanation tonometry probe equipped with an array of 40 micro piezoresistive transducers (HEM-9010AI; Omron Healthcare). Subsequently, the first and second peaks of the radial pressure waveform (SBP1 and SBP2, respectively) and brachial diastolic blood pressure (DBP) were automatically detected using the fourth derivatives for each radial arterial waveform and then averaged. The radial augmentation index (%), a marker of the central augmentation index, was calculated as follows:16
Radial augmentation index = (SBP2 − brachial DBP) / (SBP1 − brachial DBP) × 100
The reproducibility and accuracy of brachial-ankle PWV and radial augmentation index measurements have been reported to be acceptable elsewhere.15–17
Echocardiography
TTE was performed with a 2.5-MHz transducer by registered diagnostic cardiac sonographers using a commercially available echocardiographic machine (Vivid E9; GE Medical Systems, Horten, Norway). LV end-diastolic dimensions (LVEDD), end-diastolic interventricular septal thickness (IVSTd), and end-diastolic LV posterior wall thickness (PWTd) were measured at end-diastole in accordance with the standards established by the American Society of Echocardiography.18 LV ejection fraction was determined by the biplane Simpson method. Maximum left atrial (LA) volume was calculated using the Simpson method and indexed to body surface area (LA volume index). LV mass was calculated using the American Society of Echocardiography method18 as follows:
LV mass = 0.8 (1.04 [(IVSTd + LVEDD + PWTd)3 − LVEDD3] + 0.6)
with the LV mass index (LVMI) calculated as the LV mass divided by body surface area.
The septal mitral annular early diastolic velocity (E′) was determined by spectral tissue Doppler imaging using standard methods. Early transmitral flow velocity (E), its deceleration time, and atrial contraction flow velocity (A) were measured by the pulsed-wave Doppler method, and the E/A and E/E′ ratios were also calculated.2 As reported previously,3,4 DWS was calculated using the following formula:
DWS = (PWTs − PWTd) / PWTs
where PWTs is the posterior free wall thickness at end-systole. The reproducibility of each measurement of posterior free wall thickness at Tokyo Medical University hospital was as follows: in 40 volunteers, there was good agreement between 2 observers’ measurements for PWTs, PWTd, and DWS (r=0.96, r=0.98, and r=0.91 respectively). Inter- and intraobserver variabilities for the measurements were 4.3% and 4.1%, respectively.
Blood Measurements
Serum concentrations of triglyceride, low-density lipoprotein cholesterol, high-density lipoprotein cholesterol, creatinine (Cr), and high sensitivity C-reactive protein (hs-CRP), as well as plasma glucose concentrations and HbA1c, were measured using standard enzymatic methods (Falco Biosystems, Co. Ltd, Tokyo, Japan). Serum hs-CRP was measured by the latex-aggregation method. All blood samples were obtained in the morning after the participants had fasted overnight. Serum Cr and age were used to calculate the estimated glomerular filtration rate (eGFR; mL/min/1.73 m2). The following estimation formula modified for the Japanese population with respect to modification of diet in renal disease was used:19
eGFR = 0.808 × 175 × Cr−1.154 × age−0.203 (× 0.742 for women)
Statistical Analyses
All data are expressed as the mean±SD. Correlations between DWS and blood sampling data, echocardiographic parameters, and arterial stiffness parameters, including brachial-ankle PWV and augmentation index, were analyzed using Spearman’s correlation analysis. Multivariate linear regression analysis was used to build models for the association of DWS with blood sampling data, echocardiographic parameters, and arterial stiffness parameters. In addition, multivariate logistic regression analysis using demographic variables, atherosclerotic risk variables, echocardiographic parameters, and arterial stiffness parameters was used to build models for the association between DWS of less than the median and other parameters. Receiver operating characteristic curve analysis was performed using binary analysis of DWS of less than the median value to evaluate the diagnostic performance of FMD and RHI. All analyses were conducted using SPSS software for Windows, version 28.0J (SPSS Inc., Chicago, IL, USA) and a two-tailed P<0.05 was considered statistically significant.
Results
Baseline Characteristics
Subjects’ characteristics, including demographic, blood sampling, echocardiographic, hemodynamic, arterial stiffness, and endothelial function data, are presented in Table 1. The mean age of the subjects was 65±9 years, and 71 (63%) were men. All subjects had hypertension and 10 (9%) had diabetes. The mean HbA1c was 5.8±0.5%. LV hypertrophy was defined as an LVMI >115 g/m2
in men and >95 g/m2
in women. Fifty subjects (45%) had categorical LV hypertrophy.
Table 1. Characteristics of the Study Subjects
| Age, years |
65±9 |
| Male sex |
71 (63) |
| Smoking |
54 (48) |
| Alcohol intake |
69 (61) |
| Hypertension |
112 (100) |
| Diabetes |
10 (9) |
| Body mass index (kg/m2) |
23.5±3.5 |
| Medications |
| Calcium channel blockers |
72 (64) |
| ACEI/ARB |
81 (72) |
| β-blockers |
24 (21) |
| Thiazide diuretics |
29 (26) |
| Statin |
26 (23) |
| Fasting blood glucose (mg/dL) |
101±16 |
| HbA1c (%) |
5.8±0.5 |
| Total cholesterol (mg/dL) |
199±28 |
| Triglyceride (mg/dL) |
115±54 |
| LDL-C (mg/dL) |
115±24 |
| HDL-C (mg/dL) |
55±14 |
| Uric acid (mg/dL) |
5.7±1.5 |
| Serum creatinine (mg/dL) |
0.78±0.20 |
| eGFR (mL/min/1.73 m2) |
73.1±15.3 |
| hs-CRP (ng/mL) |
1,417±497 |
| LVEF (%) |
66±5 |
| LVMI (g/m2) |
103±21 |
| LV hypertrophy |
50 (45) |
| E/A ratio |
0.85±0.26 |
| Deceleration time (ms) |
214±44 |
| E′ (cm/s) |
5.7±1.8 |
| E/E′ |
11.2±3.5 |
| LA volume index (mL/m2) |
33±11 |
| DWS |
0.36±0.05 |
| SBP (mmHg) |
143±17 |
| DBP (mmHg) |
83±12 |
| Heart rate (beats/min) |
64±10 |
| Brachial-ankle PWV (m/s) |
1,644±305 |
| Augmentation index (%) |
86±13 |
| FMD (%) |
4.1±2.8 |
| RHI |
2.32±0.56 |
Data are presented as the mean±SD or as n (%). Hypertension was defined as systolic blood pressure (SBP) >140 mmHg, diastolic blood pressure (DBP) of 90 mmHg, or antihypertensive medication use. Diabetes was defined as HbA1c ≥6.5%, fasting blood sugar ≥126 mg/dL, or the use of hypoglycemic medication. Left ventricular (LV) hypertrophy was defined as an LV mass index (LVMI) >115 g/m2 in men or >95 g/m2 in women. A, atrial contraction filling velocity; ACEI, angiotensin converting enzyme inhibitor; ARB, angiotensin receptor blocker; DWS, diastolic wall strain; E, early diastolic filling velocity; E′, tissue Doppler velocity of the left ventricular septum in the early diastolic phase; eGFR, estimated glomerular filtration rate; FMD, flow-mediated vasodilation; HDL-C, high-density lipoprotein cholesterol; hs-CRP, high-sensitivity C-reactive protein; LA, left atrial; LDL-C, low-density lipoprotein cholesterol; LVEF, left ventricular ejection fraction; PWV, pulse wave velocity; RHI, reactive hyperemia index.
Although FMD was not significantly correlated with DWS, RHI was independently associated with DWS on multivariate linear regression analysis (Table 2). In the next step, the associations between FMD or RHI and DWS in subjects with or without LV hypertrophy were analyzed. In subjects with LV hypertrophy, RHI, but not FMD, was significantly associated with DWS on univariate and multivariate linear regression analyses (Table 3). In addition, RHI, but not FMD, was significantly associated with DWS in subjects without LV hypertrophy using the same analyses (Table 4).
Table 2. Results of Univariate and Multivariate Analyses to Assess the Association of DWS With Various Factors in All Subjects
| |
DWS |
| Univariate analysis |
Multivariate analysis (R2=0.642) |
| r |
P value |
β |
P value |
| Age |
0.05 |
0.61 |
−0.03 |
0.75 |
| Sex |
0.09 |
0.37 |
−0.06 |
0.49 |
| Smoking |
0.04 |
0.96 |
|
|
| Alcohol drinking |
−0.08 |
0.42 |
|
|
| Medications |
| Calcium channel blocker |
−0.14 |
0.14 |
|
|
| ACEI/ARB |
−0.16 |
0.09 |
|
|
| β-blocker |
0.01 |
0.96 |
|
|
| Thiazide diuretics |
−0.24 |
0.01 |
−0.05 |
0.44 |
| Statin |
−0.18 |
0.06 |
|
|
| Body mass index |
−0.25 |
0.009 |
0.05 |
0.56 |
| HbA1c |
−0.09 |
0.35 |
|
|
| Fasting blood sugar |
−0.03 |
0.75 |
|
|
| Total cholesterol |
−0.01 |
0.91 |
|
|
| Triglyceride |
−0.36 |
<0.0001 |
−0.17 |
0.04 |
| HDL-C |
0.28 |
0.003 |
0.03 |
0.69 |
| LDL-C |
−0.03 |
0.78 |
|
|
| Serum creatinine |
−0.16 |
0.10 |
|
|
| eGFR |
0.09 |
0.37 |
|
|
| Uric acid |
−0.29 |
0.002 |
−0.09 |
0.23 |
| hs-CRP |
0.15 |
0.12 |
|
|
| LVEF |
0.11 |
0.21 |
|
|
| E/A ratio |
0.24 |
0.01 |
0.01 |
0.96 |
| Deceleration time |
−0.19 |
0.04 |
−0.04 |
0.60 |
| E′ |
0.29 |
0.002 |
0.08 |
0.48 |
| E/E′ |
−0.28 |
0.003 |
−0.17 |
0.09 |
| LVMI |
−0.54 |
<0.0001 |
−0.37 |
<0.0001 |
| LA volume index |
−0.13 |
0.19 |
|
|
| SBP |
−0.17 |
0.07 |
|
|
| DBP |
−0.21 |
0.03 |
−0.21 |
0.008 |
| Heart rate |
−0.08 |
0.43 |
|
|
| Augmentation index |
0.19 |
0.04 |
0.13 |
0.09 |
| Brachial-ankle PWV |
−0.09 |
0.33 |
|
|
| FMD |
0.13 |
0.16 |
|
|
| RHI |
0.57 |
<0.0001 |
0.39 |
<0.0001 |
β, standardized coefficient; r, correlation coefficient. Other abbreviations as in Table 1.
Table 3. Results of Univariate and Multivariate Analyses to Assess the Association of DWS With Various Factors in Subjects With LV Hypertrophy
| |
DWS |
| Univariate analysis |
Multivariate analysis (R2=0.505) |
| r |
P value |
β |
P value |
| Age |
0.06 |
0.70 |
0.06 |
0.66 |
| Sex |
0.13 |
0.38 |
0.15 |
0.25 |
| Smoking |
0.06 |
0.67 |
|
|
| Alcohol intake |
0.16 |
0.28 |
|
|
| Medications |
| Calcium channel blocker |
−0.26 |
0.07 |
|
|
| ACEI/ARB |
0.10 |
0.47 |
|
|
| β-blocker |
−0.06 |
0.67 |
|
|
| Thiazide diuretics |
−0.33 |
0.02 |
−0.14 |
0.28 |
| Statin |
−0.40 |
0.005 |
−0.17 |
0.21 |
| Body mass index |
−0.15 |
0.29 |
|
|
| HbA1c |
−0.02 |
0.88 |
|
|
| Fasting blood sugar |
0.08 |
0.58 |
|
|
| Total cholesterol |
0.14 |
0.32 |
|
|
| Triglyceride |
−0.28 |
0.053 |
|
|
| HDL-C |
0.33 |
0.02 |
0.14 |
0.31 |
| LDL-C |
0.07 |
0.63 |
|
|
| Serum creatinine |
−0.18 |
0.20 |
|
|
| eGFR |
0.14 |
0.34 |
|
|
| Uric acid |
−0.15 |
0.30 |
|
|
| hs-CRP |
0.04 |
0.81 |
|
|
| LVEF |
0.29 |
0.04 |
0.06 |
0.64 |
| E/A ratio |
0.16 |
0.27 |
|
|
| Deceleration time |
−0.17 |
0.25 |
|
|
| E′ |
0.20 |
0.17 |
|
|
| E/E′ |
−0.34 |
0.02 |
−0.34 |
0.03 |
| LA volume index |
−0.02 |
0.92 |
|
|
| SBP |
0.01 |
0.98 |
|
|
| DBP |
−0.18 |
0.21 |
|
|
| Heart rate |
−0.09 |
0.52 |
|
|
| Augmentation index |
0.37 |
0.009 |
|
|
| Brachial-ankle PWV |
0.03 |
0.86 |
|
|
| FMD |
0.03 |
0.82 |
|
|
| RHI |
0.51 |
<0.0001 |
0.38 |
0.003 |
Abbreviations as in Tables 1,2.
Table 4. Results of Univariate and Multivariate Analyses to Assess the Association of DWS With Various Factors in Subjects Without LV Hypertrophy
| |
DWS |
| Univariate analysis |
Multivariate analysis (R2=0.542) |
| r |
P value |
β |
P value |
| Age |
0.11 |
0.38 |
0.14 |
0.21 |
| Sex |
0.21 |
0.11 |
−0.03 |
0.78 |
| Smoking |
0.01 |
0.93 |
|
|
| Alcohol intake |
−0.23 |
0.07 |
|
|
| Medications |
| Calcium channel blocker |
0.01 |
0.95 |
|
|
| ACEI/ARB |
−0.04 |
0.84 |
|
|
| β-blocker |
0.12 |
0.54 |
|
|
| Thiazide diuretics |
0.10 |
0.61 |
|
|
| Statin |
−0.04 |
0.82 |
|
|
| Body mass index |
−0.21 |
0.10 |
|
|
| HbA1c |
−0.10 |
0.44 |
|
|
| Fasting blood sugar |
−0.10 |
0.43 |
|
|
| Total cholesterol |
−0.30 |
0.02 |
−0.19 |
0.06 |
| Triglyceride |
−0.49 |
<0.0001 |
−0.25 |
0.046 |
| HDL-C |
0.22 |
0.08 |
|
|
| LDL-C |
0.18 |
0.16 |
|
|
| Serum creatinine |
−0.14 |
0.29 |
|
|
| eGFR |
0.04 |
0.75 |
|
|
| Uric acid |
−0.43 |
<0.0001 |
−0.12 |
0.30 |
| hs-CRP |
0.18 |
0.14 |
|
|
| LVEF |
0.02 |
0.87 |
|
|
| E/A ratio |
0.18 |
0.16 |
|
|
| Deceleration time |
−0.06 |
0.64 |
|
|
| E′ |
0.21 |
0.10 |
|
|
| E/E′ |
−0.08 |
0.52 |
|
|
| LA volume index |
0.05 |
0.72 |
|
|
| SBP |
−0.14 |
0.30 |
|
|
| DBP |
−0.25 |
0.049 |
−0.21 |
0.08 |
| Heart rate |
−0.11 |
0.39 |
|
|
| Augmentation index |
0.16 |
0.22 |
|
|
| Brachial-ankle PWV |
−0.13 |
0.33 |
|
|
| FMD |
0.09 |
0.48 |
|
|
| RHI |
0.61 |
<0.0001 |
0.46 |
<0.0001 |
Abbreviations as in Tables 1,2.
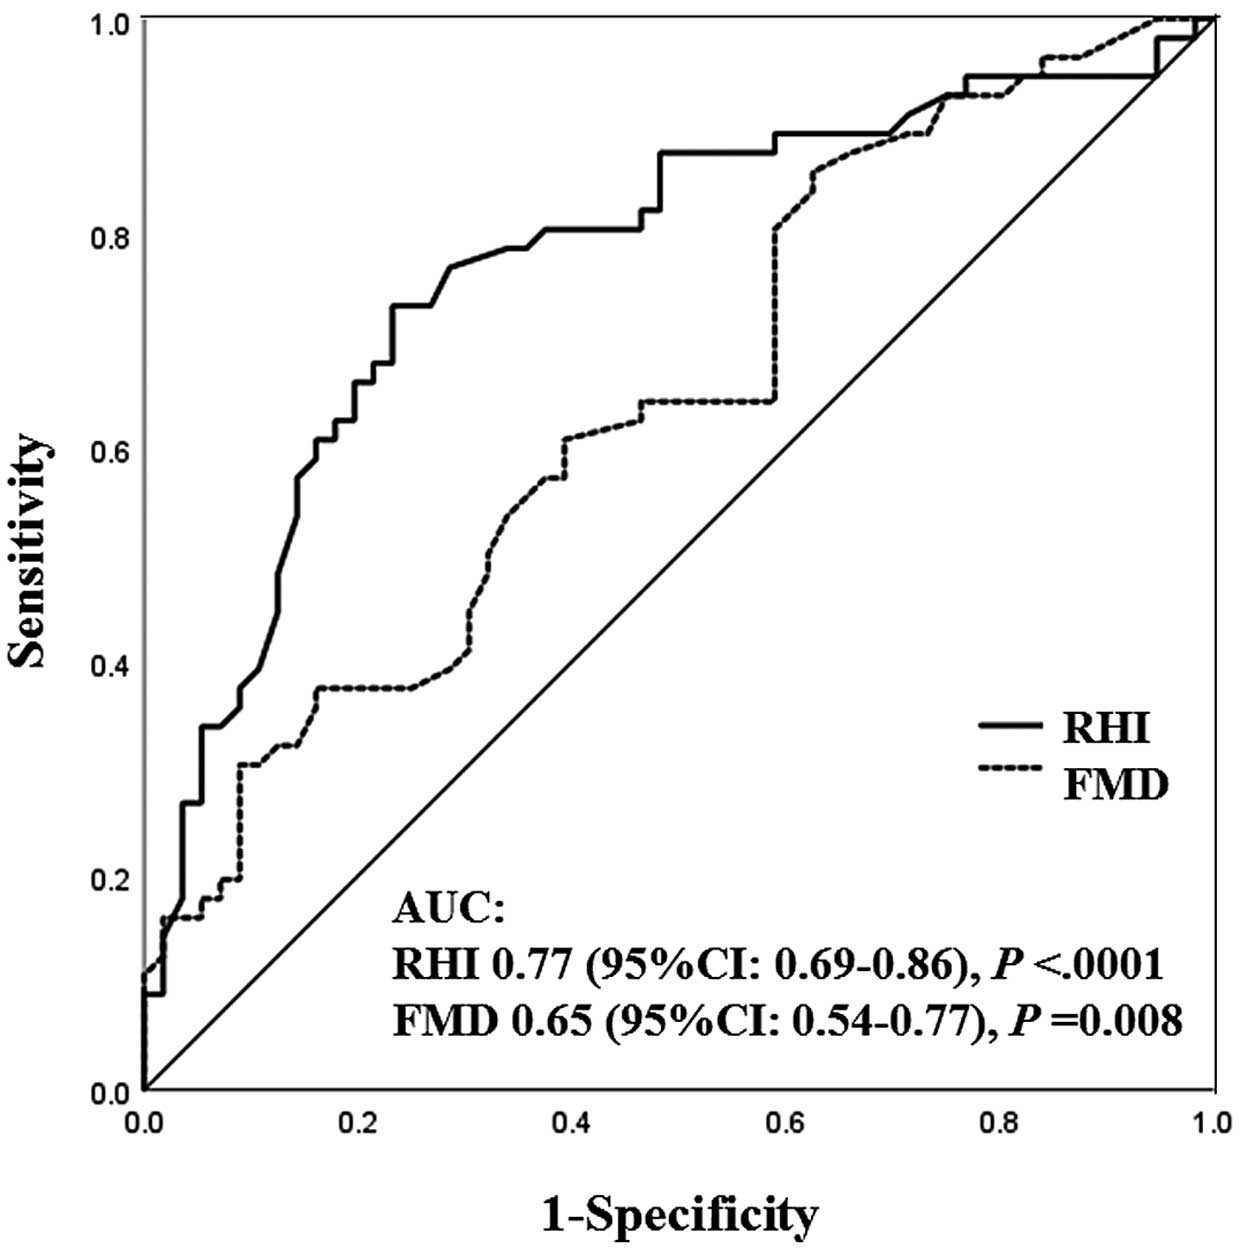
As dichotomous DWS, subjects were divided into a high DWS group (DWS >median) and a low DWS group (DWS ≤median) using the median value of 0.36 for DWS. Associations of FMD and RHI with low DWS, suggesting increased LV diastolic stiffness, were evaluated with univariate and multivariate logistic regression analyses (Table 5). Although both FMD and RHI were significantly associated with low DWS in the crude model (Model 1), after adjusting for age, sex, and medication use (Model 2), as well as atherosclerotic risk factors, including smoking, body mass index, systolic blood pressure, HbA1c, total cholesterol, triglyceride, uric acid, eGFR, and hs-CRP (Model 3), as well as the LVMI, E/E′ ratio, and arterial stiffness parameters, including brachial-ankle PWV and the augmentation index (Model 4), RHI was more strongly associated with a low DWS than FMD. As shown in the Figure, the area under the receiver operating characteristic curve (AUC), indicating the diagnostic performance of RHI or FMD for low DWS, was significantly larger for RHI (AUC 0.77; 95% confidential interval [CI] 0.69–0.86; P<0.0001) than for FMD (AUC 0.65, 95% CI 0.54–0.77; P=0.008), with a difference of 0.12 (P<0.0001). A cut-off value of 2.21 for RHI had a sensitivity of 77% and a specificity of 71% for low DWS.
Table 5. ORs of Low DWS (≤Median) by FMD and the RHI
| |
Model 1 |
Model 2 |
Model 3 |
Model 4 |
| OR |
95% CI |
P value |
OR |
95% CI |
P value |
OR |
95% CI |
P value |
OR |
95% CI |
P value |
| FMD |
1.25 |
1.07–1.46 |
0.006 |
1.21 |
1.01–1.44 |
0.04 |
1.34 |
1.08–1.65 |
0.007 |
1.38 |
1.07–1.75 |
0.01 |
| RHI |
8.22 |
3.29–20.56 |
<0.0001 |
8.55 |
3.35–21.80 |
<0.0001 |
9.05 |
3.29–24.92 |
<0.0001 |
20.58 |
4.83–87.63 |
<0.0001 |
Model 1 was unadjusted. Model 2 was adjusted for age, sex, calcium channel blocker use, ACEI/ARB use, β-blocker use, thiazide diuretics use, and statin use. Model 3 was adjusted for all the factors in Model 2 plus smoking, body mass index, SBP, HbA1c, triglyceride, total cholesterol, uric acid, eGFR, and hs-CRP. Model 4 was adjusted for all the factors in Model 3 plus LV mass index, E/E′, brachial-ankle pulse wave velocity, and the augmentation index. CI, confidence interval; OR, odds ratio. Other abbreviations as in Table 1.
Discussion
In the present study, RHI (reflecting endothelial dysfunction in the peripheral microvasculature) rather than FMD (reflecting endothelial dysfunction in the macrovasculature) was significantly associated with DWS after adjusting for subjects’ demographic factors, atherosclerotic risk factors, LV diastolic function, and arterial stiffness. This association was preserved independently of LV hypertrophy. Low DWS, which is associated with increased LV diastolic stiffness, was more strongly associated with RHI than FMD.
Possible Mechanism for the Different Associations of FMD and RHI With DWS
Increased LV diastolic stiffness is a major component of LV diastolic dysfunction that is thought to lead to an increase in filling pressure in HFpEF. The concept of DWS is based on the linear elastic theory, which considers the physical properties of myocardial tissue in the diastolic phase.3 Low DWS is theoretically associated with increased LV myocardial stiffness in the diastolic phase and reflects a fundamental abnormality contributing to the progression of HFpEF.4
Although RHI and FMD have been established as parameters to evaluate vascular endothelial function, a previous report showed only a weak association between RHI and FMD.20 The reason has been thought to be that target vascular area, its mechanistic process, and cardiovascular risk assessment partially overlap, but are different between RHI and FMD. The target vascular area in the FMD is the conduit arteries, whereas that in the RHI is the peripheral resistance arterioles. Nitric oxide (NO), derived from the vascular endothelium, is a major factor contributing to vasodilation caused by reactive hyperemia, and its effect is more prominent in the conduit arteries than in the peripheral resistance arterioles.21 Conversely, autonomic nervous system activation, particularly sympathetic activation, was reported to affect RHI rather than FMD in subjects with hypertension.22 Sympathetic nervous system activation attenuates peripheral blood flow by causing microvascular vasoconstriction.23 The reduced NO release plays a central role in the pathophysiology of endothelial dysfunction in the conduit arteries, which is reflected by FMD. Conversely, in addition to reduced NO bioavailability, metabolic factors, sympathetic nervous system activation, and other factors (e.g., endothelium-derived hyperpolarizing factors) are thought to play important roles in the pathophysiology of endothelial dysfunction in the peripheral resistance arterioles, reflected by RHI.22 FMD can identify individuals with early stage atherosclerosis who show vascular functional abnormalities that precede vascular structural abnormalities, such as an increase in intima-media thickness, vascular calcification, plaque formation and arterial stiffness. FMD is also closely associated with the angiographic severity of coronary artery disease;24 however, it does not enable the direct assessment of endothelial function in the coronary circulation.25
Increased LV diastolic stiffness, which corresponds to preclinical disorders of HFpEF, is caused by a stiffened myocardium and increased myocardial interstitial fibrosis through coronary microvascular dysfunction. In addition, LV stiffness is associated with arterial stiffness through ventricular-arterial coupling.26 A low FMD may be associated in part or indirectly with low DWS via increased arterial stiffness. Similarly, FMD was found to be associated with dichotomous DWS (≤median) on multivariate logistic regression analyses in the present study; however, FMD was not significantly associated with continuous DWS. Furthermore, RHI rather than FMD was closely associated with DWS after adjusting for atherosclerotic risk factors and parameters of arterial stiffness. In hypertensive subjects, these results may suggest that endothelial dysfunction in the peripheral resistance arterioles is more strongly associated with increased LV diastolic stiffness than endothelial dysfunction in the conduit arteries.
Association Between RHI as a Surrogate Marker for Coronary Microvascular Function and LV Diastolic Stiffness
HFpEF is a crucial problem in modern medicine, and this may reflect the lack of an accurate understanding of its pathophysiology. Endothelial dysfunction has been shown to be involved in the pathogenesis of HF, which reflects long-term systemic atherosclerosis.27 Peripheral endothelial function assessed by RHI is significantly correlated with future cardiovascular events in patients with HFpEF, and remains an independent predictor after adjusting for B-type natriuretic peptide and E/E′.28 Although a close association between RHI and HFpEF has been reported,27,28 indicating that RHI is a strong predictor for cardiovascular events in HFpEF patients, its mechanism has not been fully clarified.
Coronary microvascular dysfunction in HFpEF was first hypothesized in an autopsy study showing that HFpEF patients had lower microvascular density and more myocardial fibrosis than control subjects.29 This was subsequently confirmed in vivo when it was noted that HFpEF was associated with reduced myocardial flow reserve by cardiac positron emission tomography, suggesting that coronary microvascular dysfunction may play a role in the disease process of HFpEF.30 The presence of a proinflammatory state leads to coronary microvascular endothelial inflammation and reduced NO bioavailability, which ultimately results in HF.31 Inflammation is the main driver of HFpEF via an increase in inducible NO synthase, resulting in a decrease in the unfolded protein response, and low protein kinase G activity in cardiomyocytes induces the development of hypertrophy and increases resting tension.32 Both stiffened cardiomyocytes and myocardial interstitial fibrosis contribute to high diastolic LV stiffness and HF.33 RHI was associated with coronary endothelial dysfunction evaluated by coronary flow reserve in patients without coronary artery stenosis,34 and is thus a possible surrogate marker for coronary microvascular dysfunction. A low RHI, reflecting coronary microvascular dysfunction, may affect the increase in LV diastolic stiffness through stiffened myocytes and increased myocardial interstitial fibrosis. Therefore, the association of RHI with DWS demonstrated in the present study may be a reasonable mechanism for HFpEF. The correlation between RHI and DWS leads to an understanding of cardiovascular characteristics in patients with HFpEF.
Study Limitations
There are several limitations to this study. First, all subjects were registered at a single institution, and hence the number of registered subjects was small. Second, although RHI was shown to be significantly associated with DWS in the present cross-sectional study, the association was not confirmed in a longitudinal analysis. Hence, further studies are required to clarify whether RHI may also reflect the pathophysiological abnormalities associated with increased LV diastolic stiffness. Third, our results cannot be applied to patients with autonomous nervous system dysfunction who may show alterations in the peripheral circulation. We measured vascular function only once in every individual, which does not account for intraindividual variability and circadian rhythms. Both pathological and non-pathological conditions may interfere with the measurement of RHI. However, we did control for environmental factors by performing peripheral artery tonometry in standardized settings (i.e., a quiet, dark, temperate [23–26℃] room). None of the subjects had been diagnosed with Raynaud syndrome, vasculitis, or other vascular diseases, which may have affected the results for the peripheral endothelial dysfunction. Fourth, although it has been reported that DWS reflects LV diastolic stiffness and is not affected by volume loading in rat models,3 it has the possibility to be affected by partial loading conditions in the clinical setting or in hypertensive subjects under medication. In the present study, although univariate analyses showed correlations between the parameters of filling pressure and DWS in the overall subjects, these correlations were not significant on multivariate analysis.
Conclusions
In the present cross-sectional study, RHI reflecting endothelial dysfunction in the peripheral microvasculature, rather than FMD in the brachial artery, was significantly associated with DWS independently of LV hypertrophy. This association suggested that coronary endothelial dysfunction (i.e., coronary microvascular dysfunction) may lead to HFpEF through the worsening of LV diastolic stiffness. Confirmation of the role of peripheral endothelial function in LV diastolic stiffness by performing larger prospective studies may lead to a better understanding of HFpEF.
Acknowledgments
The authors gratefully acknowledge the medical editors of the Center for International Education and Research of Tokyo Medical University for English language editing of the manuscript.
Sources of Funding
This study was supported by a Grant-in-Aid for Scientific Research from the Ministry of Education, Science, and Culture of Japan (18590815 and 21590898 to Y.H.) and a grant from the Japanese Arteriosclerosis Prevention Fund (to Y.H.).
Disclosures
The authors declare there are no competing interests regarding this manuscript.
IRB Information
This study was approved by the Institutional Review Board of the Center for Research Administration in Tokyo Medical University (Reference no. T2021-304).
References
- 1.
Redfield MM, Jacobsen SJ, Burnett JC Jr, Mahoney DW, Bailey KR, Rodeheffer RJ. Burden of systolic and diastolic ventricular dysfunction in the community: Appreciating the scope of the heart failure epidemic. JAMA 2003; 289: 194–202.
- 2.
Nagueh SF, Smiseth OA, Appleton CP, Byrd BF 3rd, Dokainish H, Edvardsen T, et al. Recommendation for the evaluation of left ventricular diastolic function by echocardiography: An update from the American Society of Echocardiography and the European Association of Cardiovascular Imaging. J Am Soc Echocardiogr 2016; 29: 277–314.
- 3.
Takeda Y, Sakata Y, Higashimori M, Mano T, Nishio M, Ohtani T, et al. Noninvasive assessment of wall distensibility with the evaluation of diastolic epicardial movement. J Card Fail 2009; 15: 68–77.
- 4.
Ohtani T, Mohammed SF, Yamamoto K, Dunlay SM, Weston SA, Sakata Y, et al. Diastolic stiffness as assessed by diastolic wall strain is associated with adverse remodeling and poor outcomes in heart failure with preserved ejection fraction. Eur Heart J 2012; 33: 1742–1749.
- 5.
Ross R. Atherosclerosis: An inflammatory disease. N Engl J Med 1999; 340: 115–126.
- 6.
Higashi Y, Noma K, Yoshizumi M, Kihara Y. Endothelial function and oxidative stress in cardiovascular diseases. Circ J 2009; 73: 411–418.
- 7.
Yeboah J, Folsom AR, Burke GL, Johnson C, Polak JF, Post W, et al. Predictive value of brachial flow-mediated dilation for incident cardiovascular events in a population-based study: The multi-ethnic study of atherosclerosis. Circulation 2009; 120: 502–509.
- 8.
Rubinshtein R, Kuvin JT, Soffler M, Lennon RJ, Lavi S, Nelson RE, et al. Assessment of endothelial function by non-invasive peripheral arterial tonometry predicts late cardiovascular adverse events. Eur Heart J 2010; 31: 1142–1148.
- 9.
Vlachopoulos C, Xaplanteris P, Aboyans V, Brodmann M, Cífková R, Cosentino F, et al. The role of vascular biomarkers for primary and secondary prevention. A position paper from the European Society of Cardiology Working Group on peripheral circulation: Endorsed by the Association for Research into Arterial Structure and Physiology (ARTERY) Society. Atherosclerosis 2015; 241: 507–532.
- 10.
Hasegawa T, Boden-Albala B, Eguchi K, Jin Z, Sacco RL, Homma S, et al. Impaired flow-mediated vasodilatation is associated with increased left ventricular mass in a multiethnic population: The Northern Manhattan Study. Am J Hypertens 2010; 23: 413–419.
- 11.
Lam CS, Brutsaert DL. Endothelial dysfunction: A pathophysiologic factor in heart failure with preserved ejection fraction. J Am Coll Cardiol 2012; 60: 1787–1789.
- 12.
Maréchaux S, Samson R, van Belle E, Breyne J, de Monte J, Dédrie C, et al. Vascular and microvascular endothelial function in heart failure with preserved ejection fraction. J Card Fail 2016; 22: 3–11.
- 13.
Tomiyama H, Kohro T, Higashi Y, Takase B, Suzuki T, Ishizu T, et al. A multicenter study design to assess the clinical usefulness of semi-automatic measurement of flow-mediated vasodilatation of the brachial artery. Int Heart J 2012; 53: 170–175.
- 14.
Tomiyama H, Kohro T, Higashi Y, Takase B, Suzuki T, Ishizu T, et al. Reliability of measurement of endothelial function across multiple institutions and establishment of reference values in Japanese. Atherosclerosis 2015; 242: 433–442.
- 15.
Yamashina A, Tomiyama H, Takeda K, Tsuda H, Arai T, Hirose K, et al. Validity, reproducibility, and clinical significance of noninvasive brachial-ankle pulse wave velocity measurement. Hypertens Res 2002; 25: 359–364.
- 16.
McEniery CM, Yasmin, Hall IR, Qasem A, Wilkinson IB, Cockcroft JR, et al. Normal vascular aging: Differential effects on wave reflection and aortic pulse wave velocity: The Angio-Cardiff Collaborative Trial (ACCT). J Am Coll Cardiol 2005; 46: 1753–1760.
- 17.
Tomiyama H, Yamashina A. Non-invasive vascular function tests: Their pathophysiological background and clinical application. Circ J 2010; 74: 24–33.
- 18.
Lang RM, Badano LP, Mor-Avi V, Afilalo J, Armstrong A, Ernande L, et al. Recommendations for cardiac chamber quantification by echocardiography in adults: An update from the American Society of Echocardiography and the European Association of Cardiovascular Imaging. J Am Soc Echocardiogr 2015; 28: 1–39.
- 19.
Matsuo S, Imai E, Horio M, Yasuda Y, Tomita K, Nitta K, et al. Revised equations for estimated GFR from serum creatinine in Japan. Am J Kidney Dis 2009; 53: 982–992.
- 20.
Woo JS, Jang WS, Kim HS, Lee JH, Choi EY, Kim JB, et al. Comparison of peripheral arterial tonometry and flow-mediated vasodilation for assessment of the severity and complexity of coronary artery disease. Coron Artery Dis 2014; 25: 421–426.
- 21.
Tagawa T, Imaizumi T, Endo T, Shiramoto M, Harasawa Y, Takeshita A. Role of nitric oxide in reactive hyperemia in human forearm vessels. Circulation 1994; 90: 2285–2290.
- 22.
Tomiyama H, Yoshida M, Higashi Y, Takase B, Furumoto T, Kario K, et al. Autonomic nervous activation triggered during induction of reactive hyperemia exerts a greater influence on the measured reactive hyperemia index by peripheral arterial tonometry than on flow-mediated vasodilatation of the brachial artery in patients with hypertension. Hypertens Res 2014; 37: 914–918.
- 23.
Söderström T, Stefanovska A, Veber M, Svensson H. Involvement of sympathetic nerve activity in skin blood flow oscillations in humans. Am J Physiol Heart Circ Physiol 2003; 284: H1638–H1646.
- 24.
Neunteufl T, Uehata A, Gerhard MD, Meredith IT, Knab S, Delagrange D, et al. Systemic endothelial function is related to the extent and severity of coronary artery disease. Atherosclerosis 1997; 129: 111–118.
- 25.
Tanaka A, Tomiyama H, Maruhashi T, Matsuzawa Y, Miyoshi T, Kabutoya T, et al. Physiological diagnostic criteria for vascular failure. Hypertension 2018; 72: 1060–1071.
- 26.
Borlaug BA, Kass DA. Ventricular-vascular interaction in heart failure. Heart Fail Clin 2008; 4: 23–36.
- 27.
Fischer D, Rossa S, Landmesser U, Spiekermann S, Engberding N, Hornig B, et al. Endothelial dysfunction in patients with chronic heart failure is independently associated with increased incidence of hospitalization, cardiac transplantation, or death. Eur Heart J 2005; 26: 65–69.
- 28.
Akiyama E, Sugiyama S, Matsuzawa Y, Nozaki T, Ohba K, Matsubara J, et al. Incremental prognostic significance of peripheral endothelial dysfunction in patients with heart failure with normal left ventricular ejection fraction. J Am Coll Cardiol 2012; 60: 1778–1786.
- 29.
Borbély A, van der Velden J, Papp Z, Bronzwaer JG, Edes I, Stienen GJ, et al. Cardiomyocyte stiffness in diastolic heart failure. Circulation 2005; 111: 774–781.
- 30.
Srivaratharajah K, Coutinho T, deKemp R, Liu P, Haddad H, Stadnick E, et al. Reduced myocardial flow in heart failure patients with preserved ejection fraction. Circ Heart Fail 2016; 9: e002562.
- 31.
Dryer K, Gajjar M, Narang N, Lee M, Paul J, Shah AP, et al. Coronary microvascular dysfunction in patients with heart failure with preserved ejection fraction. Am J Physiol Heart Circ Physiol 2018; 314: H1033–H1042.
- 32.
Paulus WJ, Tschöpe C. A novel paradigm for heart failure with preserved ejection fraction: Comorbidities drive myocardial dysfunction and remodeling through coronary microvascular endothelial inflammation. J Am Coll Cardiol 2013; 62: 263–271.
- 33.
Mohammed SF, Hussain S, Mirzoyev SA, Edwards WD, Maleszewski JJ, Redfield MM. Coronary microvascular rarefaction and myocardial fibrosis in heart failure with preserved ejection fraction. Circulation 2015; 131: 550–559.
- 34.
Bonetti PO, Pumper GM, Higano ST, Holmes DR Jr, Kuvin JT, Lerman A. Noninvasive identification of patients with early atherosclerosis by assessment of digital reactive hyperemia. J Am Coll Cardiol 2004; 44: 2137–2141.