Abstract
Background: Hypertensive patients show highly heterogeneous treatment effects (HTEs) and cardiovascular prognosis, and not all benefit from intensive blood pressure treatment.
Methods and Results: We used the causal forest model to identify potential HTEs of patients in the Systolic Blood Pressure Intervention Trial (SPRINT). Cox regression was performed to assess hazard ratios (HRs) for cardiovascular disease (CVD) outcomes and to compare the effects of intensive treatment among groups. The model revealed 3 representative covariates and patients were partitioned into 4 subgroups: Group 1 (baseline body mass index [BMI] ≤28.32 kg/m2
and estimated glomerular filtration rate [eGFR] ≤69.53 mL/min/1.73 m2); Group 2 (baseline BMI ≤28.32 kg/m2
and eGFR >69.53 mL/min/1.73 m2); Group 3 (baseline BMI >28.32 kg/m2
and 10-year CVD risk ≤15.8%); Group 4 (baseline BMI >28.32 kg/m2
and 10-year CVD risk >15.8%). Intensive treatment was shown to be beneficial only in Group 2 (HR 0.54, 95% confidence interval [CI] 0.35–0.82; P=0.004) and Group 4 (HR 0.69, 95% CI 0.52–0.91; P=0.009).
Conclusions: Intensive treatment was effective for patients with high BMI and 10-year CVD risk, or low BMI and normal eGFR, but not for those with low BMI and eGFR, or high BMI and low 10-year CVD risk. Our study could facilitate the categorization of hypertensive patients, ensuring individualized therapy.
Hypertension (HTN) is the leading preventable cause of cardiovascular disease (CVD), chronic kidney disease (CKD) and dementia.1–3 With population aging, severe COVID-19 complications,4 and worsening trends in HTN control,5 the health burden of HTN will remain a global social challenge worldwide. In 2015, the number of all-cause deaths attributable to systolic blood pressure (SBP) ≥140 mmHg was estimated at 7.8 million (14.0% of all deaths) and the number for SBP ≥110–115 mmHg was 10.7 million (19.2% of all deaths).6,7 According to the Global Burden of Disease Study,8 non-optimal BP has been and continues to be the most prominent risk factor for disease and all-cause deaths globally, resulting in 9.4 million deaths and 212 million disability-adjusted life years annually. Although antihypertension treatment reduces the incidence of major adverse cardiovascular events (MACEs), a substantial proportion of treated patients still have uncontrolled BP.9,10 Most importantly, the optimal BP treatment target remains controversial due to discordant findings from the latest observational studies and randomized controlled trials (RCTs).11
The Systolic Blood Pressure Intervention Trial (SPRINT) demonstrated the benefits of an intensive SBP treatment target (<120 mmHg) vs. a standard target (<140 mmHg) in reducing cardiovascular events and all-cause death in adults without diabetes.12 However, other studies have reported no benefit or increased risk of CVD death.13–15 The Action to Control Cardiovascular Risk in Diabetes (ACCORD) study, for instance, found that intensive treatment aimed at a SBP target <120 mmHg did not significantly reduce the CVD risk compared with standard treatment (SBP target <140 mmHg) in patients with type 2 diabetes. The discordance in these studies can be attributed to the crucial heterogeneous treatment effects (HTEs) of hypertensive patients with heterogeneous phenotypic features. Existing evidence has suggested significant heterogeneity among hypertensive patients,10 and some post-hoc analyses have attempted to identify hidden HTEs for patients enrolled in SPRINT.16,17 However, traditional subgroup analyses are typically limited to studying a single clinical feature at a time rather than a combination of multiple covariates, leaving physicians with the dilemma of how best to interpret these controversial results.18 Additionally, studies may be underpowered to identify hidden HTEs owing to the limitation of estimation bias, multiple testing concerns, and prespecified univariate covariate testing.19
Therefore, it is crucial to discover the hidden HTEs and identify subgroups of patients who will poorly respond to intensive BP treatment through the use of a more advanced statistical predictive model. The causal forest algorithm, a machine-learning approach to causal inference, is good at detecting potential HTEs in large populations with a rich set of covariates.20 Therefore, in the present study, we applied the causal forest method to fit Cox proportional hazards models to the SPRINT data, aiming to detect those patients with HTN who would benefit from intensive BP treatment, enabling physicians to provide personalized and cost-effective care.
Methods
Study Design and Participants
The study used for model development consisted of all participants in the SPRINT trial, which was a randomized, controlled open-label trial that compared the effects of intensive (SBP target <120 mmHg) vs. standard (SBP target <140 mmHg) BP treatment in 9,361 participants from Puerto Rico and the USA. Full details of the original study methods and detailed inclusion and exclusion criteria have been published before.12,21 Briefly, participants eligible for inclusion in the SPRINT trial were at least 50 years old, with SBP between 130 and 180 mmHg, and an increased risk of CVD, which was defined by at least 1 of the following: clinical or subclinical CVD other than stoke; CKD (estimated glomerular filtration rate [eGFR] 20 to <60 mL/min/1.73 m2); age 75 years or older; a Framingham risk score (FRS) for 10-year CVD risk ≥15%. Major exclusion criteria included diabetes mellitus, kidney disease, proteinuria >1 g/day; congestive heart failure (HF), and postural hypotension (SBP <110 mmHg 1 min after standing).
Study Outcomes
The primary outcome was a composite of non-fatal myocardial infarction (MI), acute coronary syndrome, stroke, acute decompensated HF, or CVD death. The secondary outcomes included the individual components of the primary outcome and all-cause death. Serious adverse events (SAEs) were defined as events that were life threatening or fatal and resulted in persistent disability or hospitalization or other medical events identified to be clinically significant harm to the patient, including hypotension, bradycardia, syncope and acute renal failure.12
Statistical Analysis
We applied the causal forest method,22 a nonparametric supervised statistical learning algorithm designed to identify subgroups with HTEs for different interventions to subgroup the population in the study. To begin with, we randomly selected half of the 9,361 observations without replacement. Then, those selected patients were divided into 2 groups: 1 group was used to construct a tree, and the other was used to estimate treatment effects. We repeated this procedure 500 times. Consequently, there were 500 causal trees as the causal forest, and each tree had one-quarter of observations.
After the 500 causal trees were obtained, we needed to identify the most representative tree for an explicit and unique subgroup structure. The tree distance metric23 that measures the similarity of both covariates was used to split the trees and the clustering of patients in the terminal nodes of the trees was used as a practice. Thus, the most representative tree in the ensemble was chosen to minimize the average distance between a tree and all other trees in the ensemble. We studied 23 baseline predictors to estimate HTEs. The flow chart shows the process of selecting the most representative tree (Supplementary Figure 1). We divided the patients into 4 groups based on this tree.
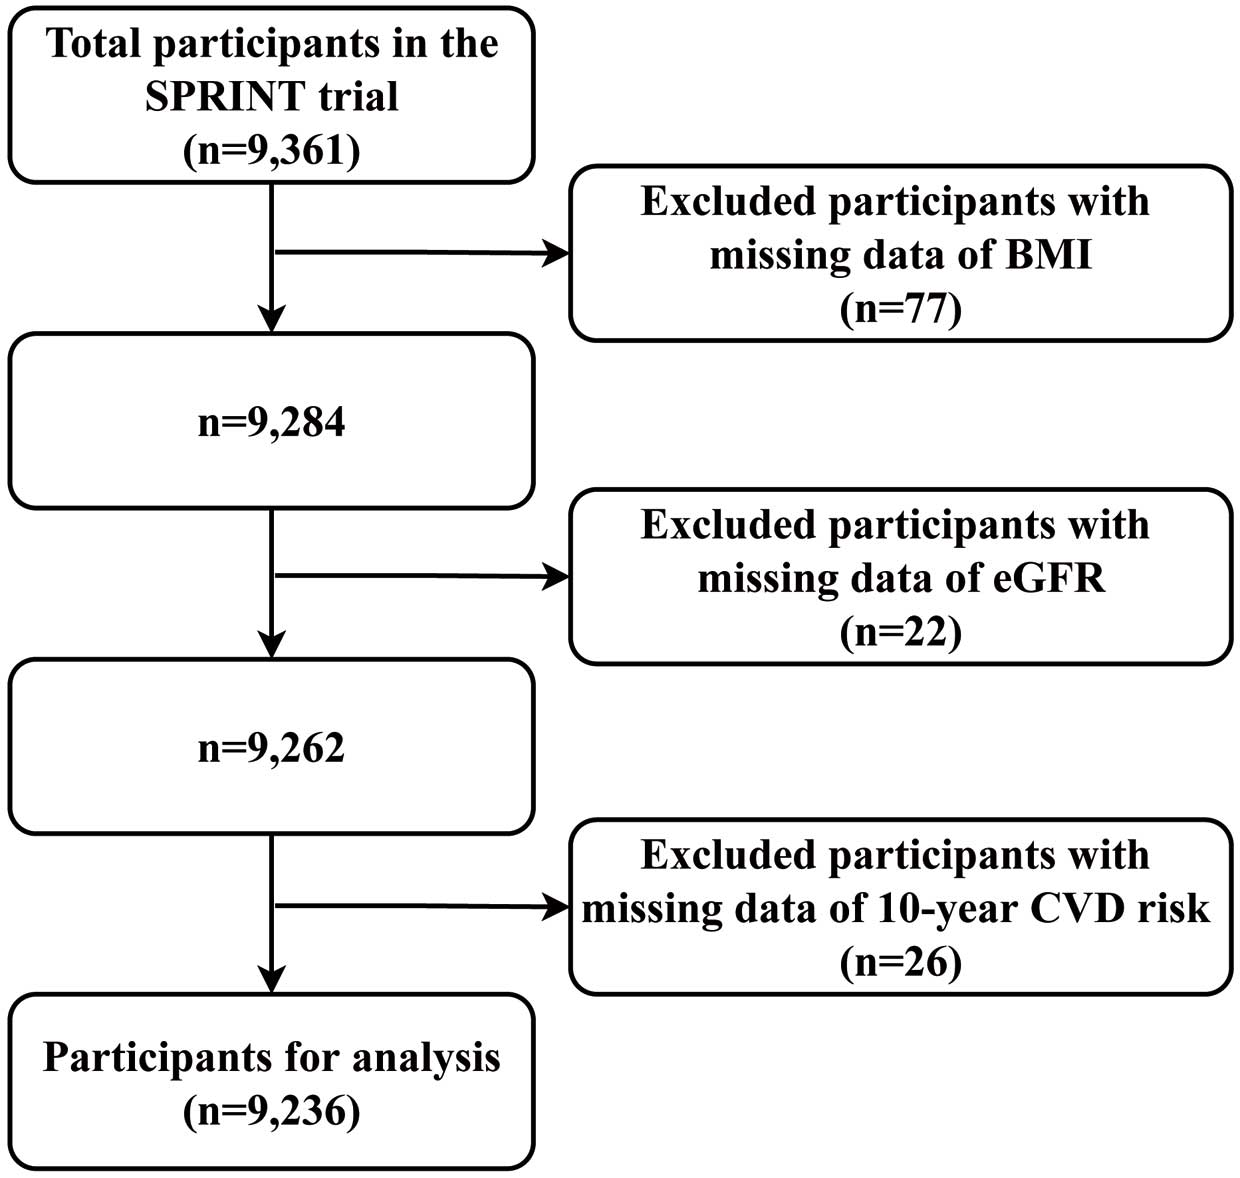
In the next exploration, we excluded missing data (n=125) for body mass index (BMI), eGFR, and 10-year CVD risk (Figure 1). Finally, 9,236 individuals were included, 4,626 in the intensive treatment arm and 4,610 in the standard treatment arm. After that, univariable Cox proportional hazard regression was performed to report hazard ratios (HRs) and 95% confidence intervals (CIs) to explore HTEs among the 4 groups. Additionally, following the standardized protocol for testing HTEs, the Cox model comprised a subgroup dummy variable, study group assignment, and their interactions.24 To further explore HTEs among the groups, interaction tests between groups and treatments were conducted through a likelihood ratio test.
Based on the casual forest analysis results, we divided the raw data into 4 subgroups. Baseline characteristics for these groups were compared by one-way ANOVA test for continuous variables, chi-squared tests for categorical variables, and Kruskal-Wallis test as appropriate. Kaplan-Meier curves were drawn to estimate the time-to-event outcomes. Differences between cumulative incidence curves were assessed by the log-rank test. Absolute risk reduction (ARR) was calculated by subtracting the control event rate from the treatment event rate. Post-hoc comparisons of effects across subgroups were tested. All tests were two-sided, and the prespecified significance level was P<0.05.
Statistical analyses were performed by Stata Statistical Software version 15.0 and R version 3.6.0.
Results
The causal forest model identified 3 variables, baseline BMI, eGFR and 10-year CVD risk, that had primary efficacy in distinguishing individuals with high vs. low benefits from intensive BP treatment. Participants were partitioned into 4 subgroups: Group 1 (baseline BMI ≤28.32 kg/m2
and eGFR ≤69.53 mL/min/1.73 m2, n=2,010); Group 2 (baseline BMI ≤28.32 kg/m2
and eGFR >69.53 mL/min/1.73 m2, n=2,080); Group 3 (baseline BMI >28.32 kg/m2
and 10-year CVD risk ≤15.8%, n=2,371); Group 4 (baseline BMI >28.32 kg/m2
and 10-year CVD risk >15.8%, n=2,775) (Figure 2).

The baseline characteristics of the included SPRINT sample are given in Table 1. At baseline, the mean age was 67.9±9.4 years, 3,276 (48.3%) were female and 2,907 (31.5%) were black. During the average follow-up period of 3.26 years (interquartile range 2.79–73.79 years), a total of 241 (5.2%) of 4,626 included participants in the intensive treatment arm, and 314 (6.8%) of 4,610 included participants in the standard treatment arm experienced primary outcome events (Tables 1,2).
Table 1. Baseline Characteristics of the Study Participants (n=9,236) by Group
| Variables |
Overall
(n=9,236) |
Group 1
(n=2,010) |
Group 2
(n=2,080) |
Group 3
(n=2,371) |
Group 4
(n=2,775) |
P value |
| Age, mean (SD), years |
67.9 (9.4) |
73.1 (9.1) |
67.4 (9.3) |
62.8 (7.7) |
68.8 (8.7) |
<0.001 |
| ≥75 years, n (%) |
2,612 (28.3) |
1,021 (50.8) |
553 (26.6) |
215 (9.1) |
823 (29.7) |
<0.001 |
| Female, n (%) |
3,276 (35.5) |
790 (39.3) |
661 (31.8) |
1,444 (60.9) |
381 (13.7) |
<0.001 |
| Black, n (%) |
2,907 (31.5) |
418 (20.8) |
678 (32.6) |
1,114 (47.0) |
697 (25.1) |
<0.001 |
| 10-year CVD risk, points |
20.1 (10.9) |
22.3 (11.6) |
20.4 (10.4) |
10.8 (3.1) |
26.3 (9.4) |
<0.001 |
| History of clinical CVD, n (%) |
1,550 (16.8) |
408 (20.3) |
349 (16.8) |
330 (13.9) |
463 (16.7) |
<0.001 |
| CKD, n (%) |
2,620 (28.4) |
1,259 (62.6) |
0 (0.0) |
591 (24.9) |
770 (27.7) |
<0.001 |
| SBP, mean (SD), mmHg |
139.7 (15.6) |
141.2 (16.2) |
140.5 (15.2) |
133.3 (13.7) |
143.5 (15.3) |
<0.001 |
| DBP, mean (SD), mmHg |
78.1 (11.9) |
74.2 (12.3) |
78.1 (11.5) |
78.8 (10.9) |
80.5 (12.2) |
<0.001 |
| BMI, mean (SD), kg/m2 |
29.9 (5.8) |
25.0 (2.4) |
25.1 (2.4) |
34.5 (5.2) |
32.9 (4.2) |
<0.001 |
| Smoking status |
|
|
|
|
|
<0.001 |
| Current, n (%) |
1,233 (13.3) |
213 (10.6) |
420 (20.2) |
182 (7.7) |
418 (15.1) |
|
| Ever, n (%) |
3,925 (42.5) |
892 (44.4) |
787 (37.8) |
931 (39.3) |
1,315 (47.4) |
|
| Never, n (%) |
4,078 (44.2) |
905 (45.0) |
873 (42.0) |
1,258 (53.1) |
1,042 (37.5) |
|
| eGFR, mL/min/1.73 m2 |
71.8 (20.6) |
54.0 (11.5) |
86.8 (14.8) |
73.7 (21.1) |
71.9 (19.3) |
<0.001 |
| TC, mean (SD), mg/dL |
190.1 (41.2) |
188.1 (40.4) |
193.2 (41.2) |
187.2 (39.7) |
191.9 (42.8) |
<0.001 |
| LDL-cholesterol, mean (SD), mg/dL |
112.4 (35.1) |
108.6 (34.1) |
113.9 (35.2) |
110.3 (34.7) |
115.9 (35.8) |
<0.001 |
| HDL-cholesterol, mean (SD), mg/dL |
52.9 (14.5) |
56.4 (15.6) |
57.0 (15.7) |
53.5 (13.5) |
46.7 (11.0) |
<0.001 |
| Aspirin, n (%) |
4,713 (51.1) |
1,126 (56.0) |
971 (46.8) |
1,130 (47.7) |
1,486 (53.6) |
<0.001 |
| Statin, n (%) |
4,010 (43.7) |
978 (48.9) |
814 (39.3) |
1,031 (43.7) |
1,187 (43.1) |
<0.001 |
Data are mean (SD), or number (%), unless otherwise indicated. BMI, body mass index; CKD, chronic kidney disease; CVD, cardiovascular disease; DBP, diastolic blood pressure; GFR, glomerular filtration rate; HDL, high-density lipoprotein; LDL, low-density lipoprotein; SBP, systolic blood pressure; TC, total cholesterol.
Table 2. Observed Primary Outcome by Subgroups Stratified by Causal Forest Model
| |
No. of patients
in intensive
treatment arm
(no. of events) |
No. of patients
in standard
treatment arm
(no. of events) |
Absolute risk
reduction, %
(95% CI) |
P value |
HR (95% CI) |
P value |
| Overall |
4,626 (241) |
4,610 (314) |
1.60 (0.63, 2.58) |
0.001 |
0.76 (0.64, 0.90) |
0.001 |
| |
|
|
|
|
|
0.080
(interaction) |
| Group 1 |
1,019 (81) |
991 (78) |
−0.08 (−2.45, 2.30) |
0.938 |
1.03 (0.75, 1.40) |
0.862 |
| Group 2 |
1,049 (34) |
1,031 (61) |
2.68 (0.88, 4.47) |
0.005 |
0.54 (0.35, 0.82) |
0.004 |
| Group 3 |
1,183 (41) |
1,188 (52) |
0.91 (−0.67, 2.50) |
0.253 |
0.78 (0.52, 1.17) |
0.779 |
| Group 4 |
1,375 (85) |
1,400 (123) |
2.60 (0.65, 4.56) |
0.011 |
0.69 (0.52, 0.91) |
0.009 |
CI, confidence interval; HR, hazard ratio.
We further investigated the effects of intensive BP treatment on the subgroups for primary and secondary outcomes. In terms of the primary outcome, HRs for MACEs with intensive treatment in Groups 1–4 were 1.03 (95% CI 0.75–71.40), 0.54 (95% CI 0.35, 0.82), 0.78 (95% CI 0.52, 1.17) and 0.69 (95% CI 0.52, 0.91), respectively. In Groups 2 and 4, compared with the patients in the standard treatment group, patients with intensive treatment had ARR of 2.68% (95% CI 0.88–84.47; P=0.005), 2.60% (95% CI 0.65–64.56; P=0.011), respectively. However, no significant risk reduction was observed in Group 1 (P=0.938) or Group 3 (P=0.253). These results indicated HTEs (P for interaction=0.080; Table 2). Similarly, in terms of the secondary outcomes, we found that intensive BP treatment significantly reduced MI events in Group 2 (HR: 0.37; 95% CI 0.18–0.74; P for interaction=0.015). For the secondary outcome of HF, intensive BP treatment significantly reduced the event rates in the overall population, especially in Groups 2 and 4. In addition, intensive BP treatment significantly reduced the risk of CV death and all-cause death, especially in high-risk Group 4 (Supplementary Table 1).
The HRs and event rates for safety outcomes among groups are summarized in Supplementary Figure 2. Of the 9,236 participants, 3,486 (37.7%) experienced SAEs, with no significant difference between intensive and standard treatment (HR: 1.04, P=0.238), although some specific AEs occurred more often in the intensive treatment arm. HRs for severe pharmacotherapy-related AEs with intensive treatment in Groups 1–4 were 1.03 (95% CI 0.91–91.18; P=0.628), 1.03 (95% CI 0.89–81.20; P=0.685), 1.00 (95% CI 0.87–81.15; P=0.986), 1.09 (95% CI 0.97–91.22; P=0.154), respectively (Supplementary Figure 2). Kaplan-Meier curve analysis across intensive and standard treatment groups was performed to further demonstrate the HTEs among groups (Supplementary Figure 3).
Discussion
In this analysis of the SPRINT trial, with the integration of Cox proportional hazards models and use of the causal forest algorithm, we demonstrated clinically significant heterogeneity and identified subgroups with differential responses to intensive BP treatment (Figure 2). Of note, guideline-recommended phased models of HTN are too simplistic and will put physicians in a quandary when planning individual treatment.10,25,26 Our study can assist in identifying those hypertensive patients who would benefit from intensive BP intervention, thereby directing individualized therapy.
To date, the optimal BP targets in hypertensive patients have been both controversial and elusive. Urgently needed are more studies to determine optimal BP targets for hypertensive patients with different clinical features and comorbidities. Observational epidemiological studies have demonstrated a linear relationship between BP and vascular death down to a BP level of 115/75 mmHg,27 but we cannot assume that lower is better. In addition, other studies have detected that the association between BP and CVD follows a bimodal distribution (‘J’- or ‘U’-shaped curve) and that low and extremely high BP status is associated with increased mortality rates.28–30 As mentioned earlier, the phenotypic characteristics and responses of hypertensive patients to antihypertensive treatment are extremely heterogeneous. Thus for some particular patients, a risk-benefit assessment of intensive BP treatment should be individually performed.
The causal forest algorithm revealed 3 important risk indicators from among 23 predictors, and based on these variables, we allocated 4 subgroups with differential responses to intensive BP treatment. There have been numerous studies demonstrating the association with HTN of these 3 accessible indicators (BMI, eGFR, and 10-year CVD risk). First, prior studies have identified a striking relationship between HTN and BMI.10,31 Population attributable risk estimates from the second Nurses’ Health Study indicated that obesity defined by BMI may be responsible for ≈40% of cases of HTN.32 High BMI is also a known powerful predictor of CVD development.33 Second, eGFR, a powerful indicator of kidney function, is inextricably linked to CVD, and CKD evaluated by eGFR is a well-established risk factor of CVD.34 Existing studies have demonstrated that lower eGFR increases the risk of acute kidney injury (AKI) in patients with and without HTN.35,36 Third, the FRS for 10-year CVD risk is a well-accepted score to estimate CVD risk in the general population, given age, sex, smoking, baseline SBP, antihypertensive treatment, and cholesterol levels.37 Interestingly, an unsupervised data-driven cluster analysis also screened out these 3 indicators, highlighting their importance in the long-term prognosis of hypertensive patients.10
Of the 4 subgroups we categorized, Group 2 (patients with low BMI and relatively normal eGFR) and Group 4 (patients with both high BMI and 10-year CVD risk) were found to benefit from intensive BP treatment, whereas Group 1 (patients with both low BMI and eGFR) and Group 3 (patients with both high BMI and 10-year CVD risk) did not. These results further emphasized the hidden HTEs in hypertensive patients. Our study results were consistent with our previously mentioned cluster analysis.10 However, cluster analysis has to limit aspects of the study to subgroups with available data. It would be hard to categorize hypertensive patients due to a lack of specific cutoff values, thereby limiting its subsequent RCT validation and clinical application.
In terms of of the 2,010 individuals in Group 1, 1,259 had CKD, indicating impaired kidney function. According to the Modification of Diet in Renal Disease (MDRD) study,38 intensive BP treatment appeared less renoprotective in these patients. In the SPRINT trial, the authors demonstrated that the primary outcome benefit of intensive BP treatment was non-significant in the subgroup with previous CKD.12 Moreover, consistent with our findings, Obi et al compared the risk-benefit profile of intensive BP treatment based on eGFR and found that such treatment had little benefit and might even increase mortality risk in patients with moderate-to-advanced CKD.39 However, several meta-analyses have suggested that intensive BP treatment significantly reduces the rates of MACEs in patients with CKD.40,41 This reverse epidemiologic phenomenon may have a bearing on the management of hypertensive patients with CKD. Therefore, it remains debatable whether the association between increased mortality risk and excessive BP lowering is directly causal or indirectly confounded by other baseline characteristics in hypertensive patients with CKD.10 Unfortunately, until now, no RCTs have been conducted to investigate the cardiovascular benefits of intensive BP treatment in this population. Of note, the SPRINT trial excluded patients with diabetes and previous stroke. Therefore, the results above should be interpreted with caution in clinical practice, especially when extrapolating to other CKD patients. There is a need to perform appropriate RCTs to address these issues in the future. Advantageously, our results have the feasibility of conducting a RCT for further validation.
For the participants in Group 3, the mean 10-year CVD risk was 10.8%, indicating low risk for CVD. No significant difference were found in the primary and secondary outcomes in Group 3. A post-hoc analysis of SPRINT suggests that intensive SBP treatment could reduce CVD events and all-cause death in hypertensive patients regardless of baseline FRS.16 However, for the patients in Group 3 (high BMI but low FRS), our study showed that intensive BP treatment was not beneficial, possibly because these people were physically fit except for being obese, so their 10-year CVD risk was lower. The heterogeneous effects of obesity on cardiovascular outcomes deserve further consideration, which will facilitate more individualized therapy for patients with low FRS.
We also performed exploratory analyses of several meaningful secondary outcomes. Interestingly, we found that intensive BP treatment significantly reduced the risk of MI and HF for the patients in Group 2, who were at a relatively low-risk state. In contrast, Group 4, with a mean BMI and 10-year CVD risk of 32.9 kg/m2
and 26.3%, respectively, had a relatively high risk and would benefit from intensive BP treatment. Of note, these results do further strengthen the case that patients at higher baseline cardiovascular risk will benefit from BP-lowering therapy by a greater absolute reduction in cardiovascular outcomes.10,16,42 Future research must determine if the high-risk subgroup with HTN is mechanistically unique or indicates an advanced illness stage.
Study Strengths and Limitations
Our study applied the causal forest model to conduct a post-hoc analysis, which was particularly adept at identifying significant HTEs hidden in large subgroups among existing trials, even if the trials presented average positive effects. We implemented this novel algorithm to identify therapeutically effective patients from the SPRINT trial, which could assist clinicians in making optimal treatment decisions and thus improve patients’ prognoses. Notably, the 3 indicators identified by the causal forest model are accessible in clinical practice, ensuring their application and popularization. In addition, it should be noted that conventional approaches to subgroup analyses are often underpowered and susceptible to estimation bias and multiple testing errors, because only 1 factor at a time is considered, rather than a combination of factors.19,43 Furthermore, our study results had specific cutoff values, which facilitates subsequent validation by a RCT.
However, several limitations should be considered. First, this was a post-hoc analysis, so our findings should be considered as hypothesis-generating and still need to be replicated in other independent cohorts. Second, by splitting the data into separate subsets, we sacrificed statistical power but reserved the validity of the inference. Third, there are intrinsic limitations within the SPRINT trial, which could not be counterbalanced by the current study. Therefore, appropriate RCTs should be conducted before extrapolation to other populations. Finally, enhancing the machine learning algorithm to compare HTEs on a relative scale and further conducting prospective randomized trials to validate the findings before clinical application is necessary.
Conclusions
In conclusion, our study manifested the HTEs of intensive treatment in hypertensive patients enrolled in SPRINT. Intensive treatment was feasible and effective for patients with high BMI and 10-year CVD risk, or low BMI and relatively normal eGFR, but not for those with low BMI and eGFR, or high BMI and relatively low 10-year CVD risk. Our study could facilitate the categorization of hypertensive patients, ensuring better individualized therapy.
Acknowledgments
We thank the staff and participants of the SPRINT study. This work was supported by the National Natural Science Foundation of China (Grant no. 12001554 to T.T., 81870195, 82070384 to X.L.), the Natural Science Foundation of Guangdong Province, China (Grant no. 2021A1515010205 to T.T.), the Science and Technology Program of Guangzhou, China (Grant no. 202201011578 to T.T.) and the Guangdong Basic and Applied Basic Research Foundation (Grant no. 2019A1515011582, 2021A1515011668 to X.L.).
Statements and Declarations
Funding / Disclosures: The authors have no relevant financial or non-financial interests to disclose.
Availability of Data and Material: Not applicable.
Code Availability: Not applicable.
Author Contributions: All authors contributed to the study conception and design. Material preparation, data analysis were performed by R.Z., J.Z., and X.C. The first draft of the manuscript was written by R.Z., J.Z., and X.C., and all authors commented on previous versions of the manuscript. All authors read and approved the final manuscript.
IRB Information: The present study was approved by the National Institutes of Health. Reference no. NCT01206062.
Consent to Participate: Not applicable.
Consent for Publication: Not applicable.
Supplementary Files
Please find supplementary file(s);
https://doi.org/10.1253/circj.CJ-23-0037
References
- 1.
Olsen MH, Angell SY, Asma S, Boutouyrie P, Burger D, Chirinos JA, et al. A call to action and a lifecourse strategy to address the global burden of raised blood pressure on current and future generations: The Lancet Commission on hypertension. Lancet 2016; 388: 2665–2712.
- 2.
Sharp SI, Aarsland D, Day S, Sønnesyn H; Alzheimer’s Society Vascular Dementia Systematic Review Group; Ballard C. Hypertension is a potential risk factor for vascular dementia: Systematic review. Int J Geriatr Psychiatry 2011; 26: 661–669.
- 3.
Hokimoto S, Kaikita K, Yasuda S, Tsujita K, Ishihara M, Matoba T, et al. JCS/CVIT/JCC 2023 guideline focused update on diagnosis and treatment of vasospastic angina (coronary spastic angina) and coronary microvascular dysfunction. Circ J 2023; 87: 879–936.
- 4.
Guzik TJ, Mohiddin SA, Dimarco A, Patel V, Savvatis K, Marelli-Berg FM, et al. COVID-19 and the cardiovascular system: Implications for risk assessment, diagnosis, and treatment options. Cardiovasc Res 2020; 116: 1666–1687.
- 5.
Muntner P, Hardy ST, Fine LJ, Jaeger BC, Wozniak G, Levitan EB, et al. Trends in blood pressure control among US adults with hypertension, 1999–2000 to 2017–2018. JAMA 2020; 324: 1190–1200.
- 6.
Forouzanfar MH, Liu P, Roth GA, Ng M, Biryukov S, Marczak L, et al. Global burden of hypertension and systolic blood pressure of at least 110 to 115 mmHg, 1990–2015. JAMA 2017; 317: 165–182.
- 7.
Mills KT, Stefanescu A, He J. The global epidemiology of hypertension. Nat Rev Nephrol 2020; 16: 223–237.
- 8.
Global Burden of Disease Study 2015 Risk Factors Collaborators. Global, regional, and national comparative risk assessment of 79 behavioural, environmental and occupational, and metabolic risks or clusters of risks, 1990–2015: A systematic analysis for the Global Burden of Disease Study 2015. Lancet 2016; 388: 1659–1724.
- 9.
Mills KT, Bundy JD, Kelly TN, Reed JE, Kearney PM, Reynolds K, et al. Global disparities of hypertension prevalence and control: A systematic analysis of population-based studies from 90 countries. Circulation 2016; 134: 441–450.
- 10.
Yang DY, Nie ZQ, Liao LZ, Zhang SZ, Zhou HM, Sun XT, et al. Phenomapping of subgroups in hypertensive patients using unsupervised data-driven cluster analysis: An exploratory study of the SPRINT trial. Eur J Prev Cardiol 2019; 26: 1693–1706.
- 11.
Wan EYF, Fung WT, Schooling CM, Au Yeung SL, Kwok MK, Yu EYT, et al. Blood pressure and risk of cardiovascular disease in UK Biobank: A Mendelian randomization study. Hypertension 2021; 77: 367–375.
- 12.
SPRINT Research Group; Wright JT Jr, Williamson JD, Whelton PK, Snyder JK, Sink KM, Rocco MV, et al. A randomized trial of intensive versus standard blood-pressure control. N Engl J Med 2015; 373: 2103–2116.
- 13.
Böhm M, Schumacher H, Teo KK, Lonn EM, Mahfoud F, Mann JFE, et al. Achieved blood pressure and cardiovascular outcomes in high-risk patients: Results from ONTARGET and TRANSCEND trials. Lancet 2017; 389: 2226–2237.
- 14.
Cushman W, Evans G, Byington R, Goff D, Grimm R, Cutler J, et al. Effects of intensive blood-pressure control in type 2 diabetes mellitus. N Engl J Med 2010; 362: 1575–1585.
- 15.
Hansson L, Zanchetti A, Carruthers SG, Dahlöf B, Elmfeldt D, Julius S, et al. Effects of intensive blood-pressure lowering and low-dose aspirin in patients with hypertension: Principal results of the Hypertension Optimal Treatment (HOT) randomised trial. HOT Study Group. Lancet 1998; 351: 1755–1762.
- 16.
Zhang L, Sun X, Liao L, Zhang S, Zhou H, Zhong X, et al. Effectiveness of blood pressure-lowering treatment by the levels of baseline Framingham risk score: A post hoc analysis of the Systolic Blood Pressure Intervention Trial (SPRINT). J Clin Hypertens (Greenwich) 2019; 21: 1813–1820.
- 17.
Zang J, Liang J, Zhuang X, Zhang S, Liao X, Wu G. Intensive blood pressure treatment in coronary artery disease: Implications from the Systolic Blood Pressure Intervention Trial (SPRINT). J Hum Hypertens 2022; 36: 86–94.
- 18.
Basu S, Sussman JB, Hayward RA. Detecting heterogeneous treatment effects to guide personalized blood pressure treatment. Ann Intern Med 2017; 166: 354–360.
- 19.
VanderWeele TJ, Knol MJ. Interpretation of subgroup analyses in randomized trials: Heterogeneity versus secondary interventions. Ann Intern Med 2011; 154: 680–683.
- 20.
Scarpa J, Bruzelius E, Doupe P, Le M, Faghmous J, Baum A. Assessment of risk of harm associated with intensive blood pressure management among patients with hypertension who smoke: A secondary analysis of the Systolic Blood Pressure Intervention Trial. JAMA Netw Open 2019; 2: e190005.
- 21.
Ambrosius W, Sink K, Foy C, Berlowitz D, Cheung A, Cushman W, et al. The design and rationale of a multicenter clinical trial comparing two strategies for control of systolic blood pressure: The Systolic Blood Pressure Intervention Trial (SPRINT). Clin Trials 2014; 11: 532–546.
- 22.
Athey S, Imbens G. Recursive partitioning for heterogeneous causal effects. Proc Natl Acad Sci USA 2016; 113: 7353–7360.
- 23.
Banerjee M, Ding Y, Noone A-M. Identifying representative trees from ensembles. Stat Med 2012; 31: 1601–1616.
- 24.
Kent DM, Rothwell PM, Ioannidis JPA, Altman DG, Hayward RA. Assessing and reporting heterogeneity in treatment effects in clinical trials: A proposal. Trials 2010; 11: 85.
- 25.
Beddhu S, Chertow GM, Cheung AK, Cushman WC, Rahman M, Greene T, et al. Influence of baseline diastolic blood pressure on effects of intensive compared with standard blood pressure control. Circulation 2018; 137: 134–143.
- 26.
Shapiro BP, Ambrosius WT, Blackshear JL, Cushman WC, Whelton PK, Oparil S, et al. Impact of intensive versus standard blood pressure management by tertiles of blood pressure in SPRINT (Systolic Blood Pressure Intervention Trial). Hypertension 2018; 71: 1064–1074.
- 27.
Lewington S, Clarke R, Qizilbash N, Peto R, Collins R; Prospective Studies Collaboration. Age-specific relevance of usual blood pressure to vascular mortality: A meta-analysis of individual data for one million adults in 61 prospective studies. Lancet 2002; 360: 1903–1913.
- 28.
Protogerou AD, Safar ME, Iaria P, Safar H, Le Dudal K, Filipovsky J, et al. Diastolic blood pressure and mortality in the elderly with cardiovascular disease. Hypertension 2007; 50: 172–180.
- 29.
Messerli FH, Mancia G, Conti CR, Hewkin AC, Kupfer S, Champion A, et al. Dogma disputed: Can aggressively lowering blood pressure in hypertensive patients with coronary artery disease be dangerous? Ann Intern Med 2006; 144: 884–893.
- 30.
Bangalore S, Messerli FH, Wun CC, Zuckerman AL, DeMicco D, Kostis JB, et al. J-curve revisited: An analysis of blood pressure and cardiovascular events in the Treating to New Targets (TNT) Trial. Eur Heart J 2010; 31: 2897–2908.
- 31.
Harsha DW, Bray GA. Weight loss and blood pressure control (Pro). Hypertension 2008; 51: 1420–1425; discussion 1425.
- 32.
Forman JP, Stampfer MJ, Curhan GC. Diet and lifestyle risk factors associated with incident hypertension in women. JAMA 2009; 302: 401–411.
- 33.
Lin Y, Zhang S, Wang S, Zhong X, Li Y, Xiong Z, et al. Behavioral factors mediating the impact of educational attainment on incident heart failure: A mediation analysis. Circ J 2021; 85: 1545–1552.
- 34.
Wheeler DC, Becker GJ. Summary of KDIGO guideline: What do we really know about management of blood pressure in patients with chronic kidney disease? Kidney Int 2013; 83: 377–383.
- 35.
James MT, Grams ME, Woodward M, Elley CR, Green JA, Wheeler DC, et al. A meta-analysis of the association of estimated GFR, albuminuria, diabetes mellitus, and hypertension with acute kidney injury. Am J Kidney Dis 2015; 66: 602–612.
- 36.
Whelton P, Carey R, Aronow W, Casey D, Collins KJ, Himmelfarb CRD, et al. 2017 ACC/AHA/AAPA/ABC/ACPM/AGS/APhA/ASH/ASPC/NMA/PCNA Guideline for the prevention, detection, evaluation, and management of high blood pressure in adults: A report of the American College of Cardiology/American Heart Association Task Force on Clinical Practice Guidelines. J Am Coll Cardiol 2018; 71: e127–e248.
- 37.
Collins D, Lee J, Bobrovitz N, Koshiaris C, Ward A, Heneghan CJ. Simple and adaptable R implementation of WHO/ISH cardiovascular risk charts for all epidemiological subregions of the world. F1000 Res 2016; 5: 2522, doi:10.12688/f1000research.9742.1.
- 38.
Klahr S, Levey AS, Beck GJ, Caggiula AW, Hunsicker L, Kusek JW, et al. The effects of dietary protein restriction and blood-pressure control on the progression of chronic renal disease: Modification of Diet in Renal Disease Study Group. N Engl J Med 1994; 330: 877–884.
- 39.
Obi Y, Kalantar-Zadeh K, Shintani A, Kovesdy CP, Hamano T. Estimated glomerular filtration rate and the risk-benefit profile of intensive blood pressure control amongst nondiabetic patients: A post hoc analysis of a randomized clinical trial. J Intern Med 2018; 283: 314–327.
- 40.
Ku E, Gassman J, Appel LJ, Smogorzewski M, Sarnak MJ, Glidden DV, et al. BP control and long-term risk of ESRD and mortality. J Am Soc Nephrol 2017; 28: 671–677.
- 41.
Cheung AK, Rahman M, Reboussin DM, Craven TE, Greene T, Kimmel PL, et al. Effects of intensive BP control in CKD. J Am Soc Nephrol 2017; 28: 2812–2823.
- 42.
Thomopoulos C, Parati G, Zanchetti A. Effects of blood pressure lowering on outcome incidence in hypertension. 1: Overview, meta-analyses, and meta-regression analyses of randomized trials. J Hypertens 2014; 32: 2285–2295.
- 43.
Baum A, Scarpa J, Bruzelius E, TamLer R, Basu S, Faghmous J. Targeting weight loss interventions to reduce cardiovascular complications of type 2 diabetes: A machine learning-based post-hoc analysis of heterogeneous treatment effects in the Look AHEAD trial. Lancet Diabetes Endocrinol 2017; 5: 808–815.
