Abstract
Background: This study aimed to investigate the association between estimated pulse wave velocity (ePWV) and mortality outcomes among individuals with hypertension.
Methods and Results: Based on the National Health and Nutrition Examination Survey (NHANES) 1999–2018, a total of 14,396 eligible participants with hypertension were enrolled. The ePWV was calculated using the equation based on blood pressure and age. The mortality outcomes of included participants were directly acquired from the National Death Index database. The multivariable Cox regression analysis was used to examine the relationship between ePWV and mortality outcomes. Moreover, the restricted cubic spline (RCS) was also used to explore this relationship. Receiver operating characteristics curves (ROC) were adopted to evaluate the prognostic ability of ePWV for predicting mortality outcomes of patients with hypertension. The median follow-up duration was 10.8 years; individuals with higher an ePWV had higher risks of mortality from both all causes (HR: 2.79, 95% CI: 2.43–3.20) and cardiovascular diseases (HR: 3.41, 95% CI: 2.50–4.64). After adjusting for confounding factors, each 1 m/s increase in ePWV was associated with a 43% increase in all-cause mortality risk (HR: 1.43, 95% CI: 1.37–1.48) and a 54% increase in cardiovascular mortality risk (HR: 1.54, 95% CI: 1.43–1.66).
Conclusions: This study indicates that ePWV is a novel prognostic indicator for predicting the risks of mortality among patients with hypertension.
Hypertension is a significant global health problem, affecting millions of people worldwide; it is also a leading cause of death globally.1 Despite the availability of effective medications and lifestyle modifications, hypertension remains poorly controlled in many populations, leading to increased morbidity and mortality.2 Arterial stiffness is one of the major complications of hypertension, which can be measured through carotid-femoral pulse wave velocity (cf-PWV).3,4 cf-PWV is a measure of how quickly the pressure wave travels down the arterial tree; it is influenced by the elasticity and compliance of the arterial wall. However, due to the measurement of cf-PWV requiring specialized equipment and an experienced doctor, it is not widely used at present.5
Estimated PWV (ePWV), a novel non-invasive measurement for arterial stiffness, was calculated based on mean arterial blood pressure (MBP) and age; it has been shown to have a favorable prognostic value of cardiovascular disease (CVD) events and mortality outcomes in recent years.6–8 Although ePWV cannot replace cf-PWV, it has been confirmed that ePWV effectively detects arterial stiffness levels.9 Elevated ePWV levels signify stiffness of elastic arteries, which is linked to a higher likelihood of developing CVDs and mortality. The loss of arterial flexibility is a typical characteristic of aging in humans, and it is believed that vascular remodeling plays a crucial role in this process.10,11 Moreover, vascular remodeling is a process that is constantly changing and can be influenced by various factors such as lifestyle choices, genetic and epigenetic factors, as well as biological signals.12–14 Arterial stiffness is greater in patients with hypertension than in individuals without hypertension.9 However, the relationship between ePWV and mortality in people with hypertension remains uncertain.
As far as we know, there have been few studies examining the link between ePWV and mortality outcomes among individuals with hypertension. This study seeks to investigate how ePWV is linked to all-cause mortality and cardiovascular mortality in hypertensive patients through utilizing data from a diverse, large population who participated in the National Health and Nutrition Examination Survey (NHANES).
Methods
Study Population
NHANES is an ongoing survey conducted every 2 years, which aims to evaluate the health and nutrition status of U.S. residents.15 Stratified multistage probability sampling is a method used in survey research to ensure representative and reliable data collection from a population of interest.16 This sampling technique involves multiple stages and incorporates stratification to enhance the precision of estimates and account for population heterogeneity. More information about the survey’s methods can be found on the NHANES website (http://www.cdc.gov/nchs/nhanes.htm). All participants from 10 consecutive NHANES cycles, conducted between 1999 and 2018, were initially enrolled. Individuals meeting any of the following criteria were classified as having hypertension: SBP ≥140 mmHg or DBP ≥90 mmHg, self-reported hypertension, or being prescribed antihypertensive medications.17,18 These criteria align with the guideline of the International Society of Hypertension.19 Of 101,316 NHANES participants, 24,039 were diagnosed with hypertension, and 14,396 adults with hypertension were finally included in this study after excluding ineligible individuals. The exclusion criteria included: (1) individuals aged <18 or ≥80 years; (2) an estimated glomerular filtration rate (eGFR) <60 mL/min/1.73 m2; (3) participants lacking eligible follow-up data; and (4) pregnant individuals (Figure 1).

ePWV Measurement
Experienced examiners followed the blood pressure measurement protocol of the American Heart Association, and participants were required to rest quietly in a seated position for 5 min before measuring their blood pressure.17 The average SBP and DBP were obtained and reported as the average value of three consecutive measurements. Similar to previous studies,20–22 the mean arterial blood pressure (MBP) was measured using algorithm (1):
MBP = DBP + [0.4 × (SBP – DBP)] (1)
ePWV was algorithmically calculated as algorithm (2):
ePWV = 9.587 – (0.402 × age) + [4.560 × 0.001 × (age2)] – [2.621 × 0.00001 × (age2) × MBP] + (3.176 × 0.001 × age × MBP) – (1.832 × 0.01 × MBP) (2)
Mortality Outcomes
All participants in the present study were connected to the National Death Index (NDI) database; this allowed information to be obtained from death certificates and determined if they had passed away. Public death records were used from the beginning until December 31, 2019 (the most recent update of the NDI database). We determined the mortality outcomes in accordance with the International Statistical Classification of Diseases (ICD-10).23,24 In the ICD-10, various codes are assigned to signify cardiovascular death, such as heart failure (I50), strokes or cerebrovascular accidents (CVA) (I60-I69), and negative impacts of agents affecting the cardiovascular system (T46).
Covariates
The NHANES survey collected information on various demographic factors including age, sex, race/ethnicity, education levels, and family income through questionnaires. Health questionnaires were also used to determine the participants’ alcohol consumption, smoking status, and status of other chronic diseases. The Charlson comorbidity index (CCI) was calculated following the processes used in previously published studies.25,26 Body mass index (BMI) was grouped into three categories: <25.0, 25.0–29.9, and >29.9 kg/m2
based on the definitions of obesity and overweight of the World Health Organization.17,27,28 Blood samples were collected after at least an 8-h overnight fast.
Statistical Methods
This study adhered to analytic and reporting guidance of the NHANES group, which utilized stratified multistage probability sampling to minimize bias. Each participant was assigned a specific sampling weight based on the primary sampling unit to ensure representative estimates at the national level. All data were analyzed using the 20-year survey weight. Continuous variables were reported as weighted means with 95% confidence intervals (CI), whereas categorical variables were reported as proportions with 95% CIs. The adjusted Wald test was used for continuous variables, and the Rao-Scott χ2
test was used for categorical variables to compare baseline characteristics. The relationship between ePWV and mortality risks was visualized using a restricted cubic spline (RCS) with three knots. Weighted multivariable Cox regression was utilized to further examine the association between ePWV and mortality risks. We ultimately selected 10 m/s as the cut-off value by referring to previous relevant literature on ePWV and mortality.7 Moreover, it also advises the use of 10 m/s as new cut-off value for cfPWV in expert consensus.29 Significant multicollinearity existed between age, systolic blood pressure, and ePWV; therefore, age and SBP were not included in the adjusted model (Supplementary Table 1). Hazard ratios and 95% CI were reported in Cox regression analysis results. R software (version 4.1.6, Rsoftware core team, Vienna, Austria) was used to carry out all statistical analyses. A P value <0.05 considered statistically significant.
Results
Characteristics of the Study Population
We eventually enrolled 14,396 participants with hypertension, which represents 56.6 million individuals with hypertension. The mean age of the population was 52.8 years, and the weighted mean level of ePWV was 9.00 m/s. The results presented in Table 1 show that individuals with a higher ePWV (ePWV ≥1.0 m/s) were generally older (with an average age of 66.2 years compared to 46.1 years), more likely to have quit smoking, suffer from diabetes (24.7% vs. 18.9%) and CVDs. Additionally, a significantly higher proportion of participants with a CCI score of 2 or more were found among those with elevated ePWV.
Table 1.
Baseline Characteristics of the Study Population
| |
Overall
(n=14,396) |
ePWV <10 m/s
(n=8,476) |
ePWV ≥10 m/s
(n=5,920) |
P value |
| Age, years |
52.8 [52.3, 53.2] |
46.1 [45.6, 46.6] |
66.2 [65.9, 66.6] |
<0.001* |
| Male, % |
52.5 [49.4, 55.6] |
54.5 [52.9, 56.2] |
48.4 [46.7, 50.2] |
<0.001* |
| Race/ethnicity |
|
|
|
<0.001* |
| White |
13.0 [11.7, 14.4] |
13.9 [12.2, 15.7] |
11.3 [9.6, 13.0] |
|
| Black |
6.2 [5.2, 7.1] |
6.9 [5.7, 8.0] |
4.7 [3.7, 5.8] |
|
| Mexican |
10.6 [9.4, 11.9] |
11.1 [9.7, 12.6] |
9.6 [8.1, 11.2] |
|
| Others |
70.2 [64.4, 75.9] |
68.1 [65.3, 70.8] |
74.4 [71.7, 77.1] |
|
| BMI, kg/m2 |
|
|
|
<0.001* |
| Normal weight (<25.0) |
17.8 [16.7, 19.0] |
16.1 [14.9, 17.2] |
22.1 [20.7, 23.5] |
|
| Over weight (25.0–29.9) |
48.0 [45.2, 50.8] |
51.9 [50.1, 53.6] |
42.1 [40.4, 43.8] |
|
| Obesity (≥30.0) |
32.8 [30.7, 35.0] |
32.1 [30.5, 33.7] |
35.8 [34.1, 37.5] |
|
| Drinking status |
|
|
|
<0.001* |
| Non-drinker |
17.4 [16.0, 18.8] |
21.5 [20.0, 23.0] |
9.1 [7.7, 10.5] |
|
| Low to moderate drinker |
48.9 [46.0, 51.7] |
48.0 [45.8, 50.2] |
50.7 [48.1, 53.3] |
|
| Heavy drinker |
28.8 [26.4, 31.2] |
25.0 [23.1, 26.9] |
36.4 [33.9, 38.9] |
|
| Not recorded |
5.0 [4.4, 5.6] |
5.5 [4.8, 6.3] |
3.9 [3.2, 4.5] |
|
| Smoking status |
|
|
|
<0.001* |
| Never smoker |
21.5 [19.8, 23.3] |
25.6 [24.0, 27.1] |
13.4 [12.4, 14.5] |
|
| Ever smoker |
30.3 [28.1, 32.4] |
25.4 [24.1, 26.8] |
39.9 [37.6, 42.3] |
|
| Current smoker |
47.5 [45.3, 50.0] |
48.0 [46.3, 49.8] |
46.5 [44.2, 48.8] |
|
| Not recorded |
0.7 [0.4, 1.0] |
1.0 [0.6, 1.4] |
0.1 [0.0, 0.3] |
|
| Education levels |
|
|
|
<0.001* |
| Less than high school |
0.0 [0.0, 0.1] |
0.1 [0.0, 0.1] |
0.0 [0.0, 0.0] |
|
| High school or equivalent |
54.2 [51.3, 57.1] |
56.0 [53.6, 58.4] |
50.6 [48.4, 52.7] |
|
| College or above |
0.0 [0.0, 0.0] |
0.0 [0.0, 0.0] |
0.0 [0.0, 0.0] |
|
| Not recorded |
39.1 [35.9, 42.3] |
39.0 [36.7, 41.4] |
39.3 [37.3, 41.3] |
|
| Family income |
|
|
|
0.004** |
| <2,000$ |
19.7 [18.0, 21.4] |
18.6 [17.1, 20.1] |
22.0 [20.1, 23.9] |
|
| ≥2,000$ |
77.0 [73.0, 81.1] |
78.5 [77.0, 80.1] |
74.0 [71.9, 76.0] |
|
| Not recorded |
3.3 [2.6, 3.9] |
2.9 [2.2, 3.6] |
4.0 [2.7, 5.3] |
|
| SBP, mmHg |
132.9 [132.3, 133.4] |
126.6 [126.1, 127.2] |
145.4 [144.6, 146.2] |
<0.001* |
| DBP, mmHg |
75.8 [75.4, 76.3] |
75.5 [75.0, 76.0] |
76.5 [75.9, 77.1] |
0.004** |
| DM, % |
20.9 [19.5, 22.2] |
18.9 [17.7, 20.1] |
24.7 [23.1, 26.4] |
<0.001* |
| CVD, % |
12.9 [11.9, 14.0] |
9.8 [8.9, 10.6] |
19.5 [18.0, 21.1] |
<0.001* |
| CCI |
|
|
|
<0.001* |
| ≥3 |
17.0 [15.8, 18.2] |
14.0 [13.0, 15.0] |
23.0 [21.3, 24.7] |
|
| 0 |
44.5 [41.9, 47.0] |
51.0 [49.3, 52.7] |
31.3 [29.3, 33.3] |
|
| 1 |
25.3 [23.5, 27.2] |
22.6 [21.0, 24.2] |
30.8 [29.0, 32.6] |
|
| 2 |
13.3 [12.1, 14.4] |
12.5 [11.2, 13.7] |
14.9 [13.6, 16.1] |
|
Continuous variables are presented as the mean and 95% CI; category variables are presented as the proportion and 95% CI. BMI, body mass index; CCI, Charlson comorbidity index; CI, confidence interval; CVD, cardiovascular disease; DBP, diastolic blood pressure; DM, diabetes mellitus; ePWV, estimated pulse wave velocity; SBP, systolic blood pressure. *P value <0.001, **P value <0.01.
Associations of ePWV With Mortality Outcomes in a Population With Hypertension
The median follow-up time was 10.8 years. Overall, 2,587 (18.0%) of 8,916 patients with hypertension died, including 657 (4.6%) cardiovascular deaths. We observed a positive linear correlation between ePWV and all-cause and cardiovascular mortality, as shown in Figure 2. The risks of all-cause and cardiovascular mortality were higher in patients with higher ePWV, as demonstrated by the weighted Kaplan-Meier (KM) plots in Figure 3A and Figure 3B, respectively (P<0.001). We also found that every 1 m/s increase in ePWV was associated with a 43% and 54% increased risk of all-cause (HR: 1.43, 95% CI: 1.37–1.48) and cardiovascular mortality (HR: 1.54, 95% CI: 1.43–1.66), respectively. Participants with an ePWV ≥10 m/s had higher risks of mortality from both all causes (HR: 2.79, 95% CI: 2.43–3.20) and CVDs (HR: 3.41, 95% CI: 2.50–4.64). Despite adjusting for covariates, individuals with higher ePWV tend to have a higher prevalence of pre-existing CVD, as the characteristics of ePWV that are strongly associated with age contribute to this association. Subgroup analysis showed a favorable prognostic outcome regardless of whether patients had pre-existing CVD, as shown in Figure 4. Besides, we conducted an unweighted Cox regression analysis in sensitive analysis to further validate our conclusion (Table 2, Supplementary Table 2).
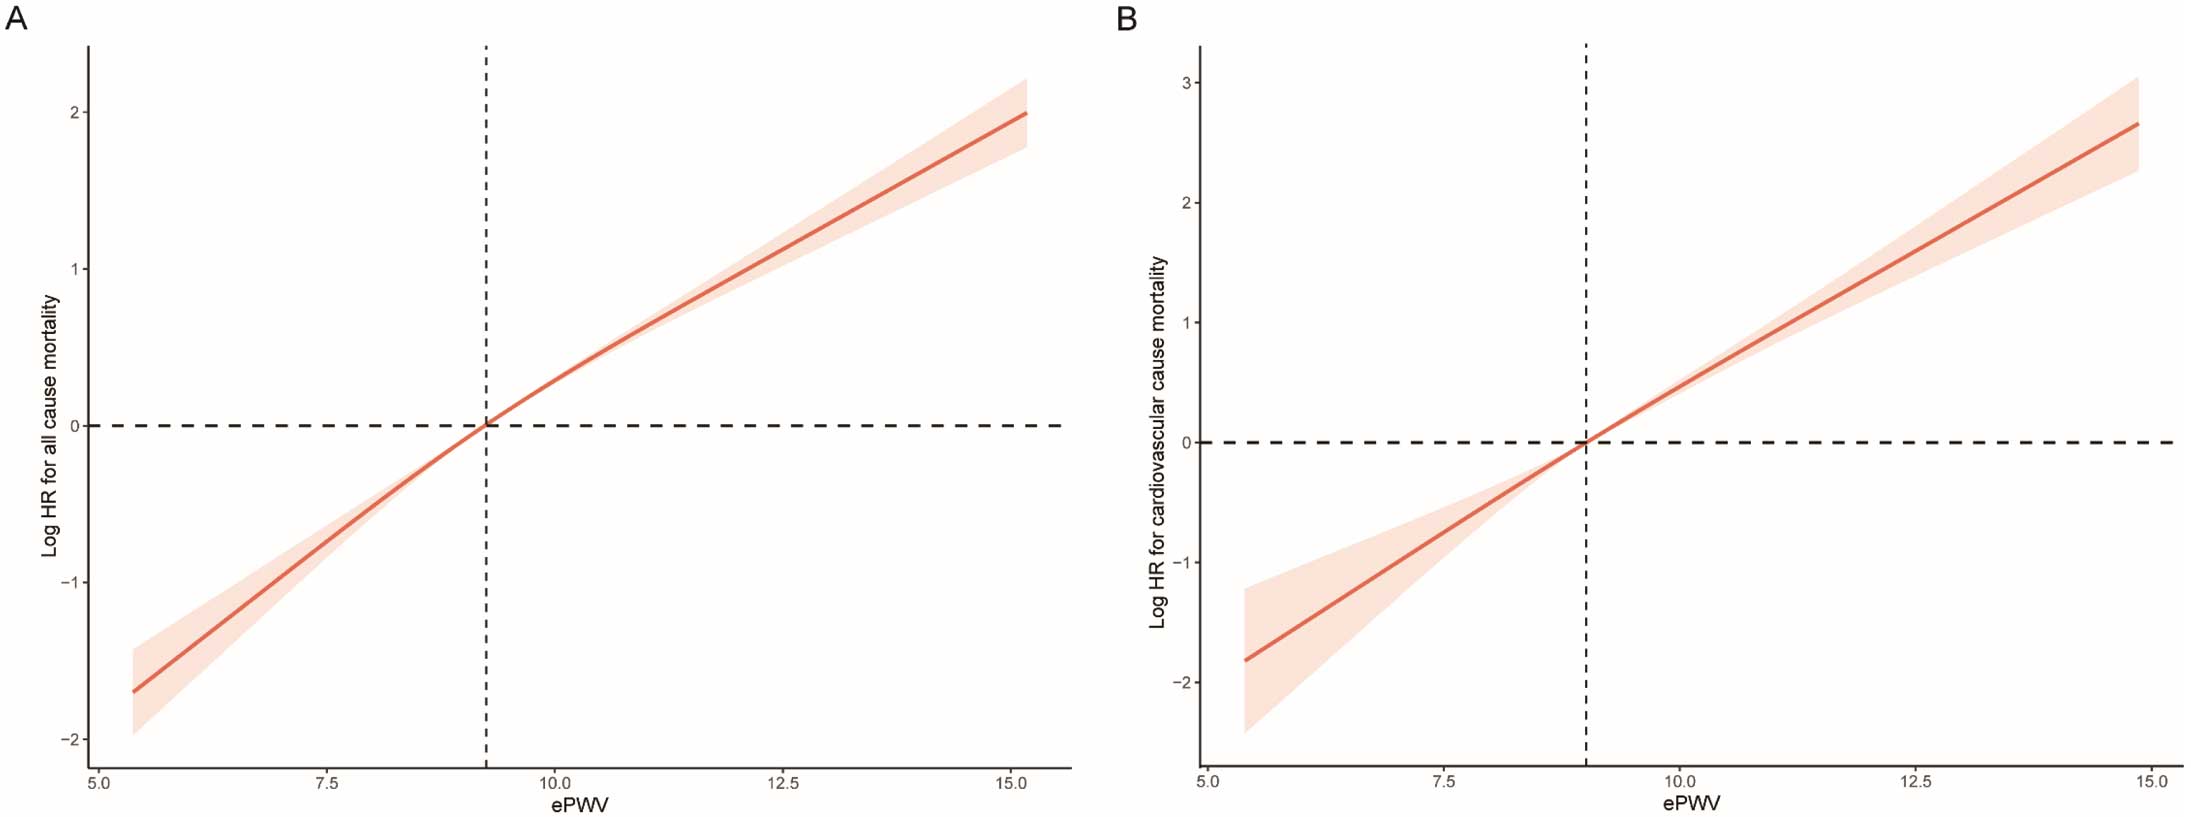
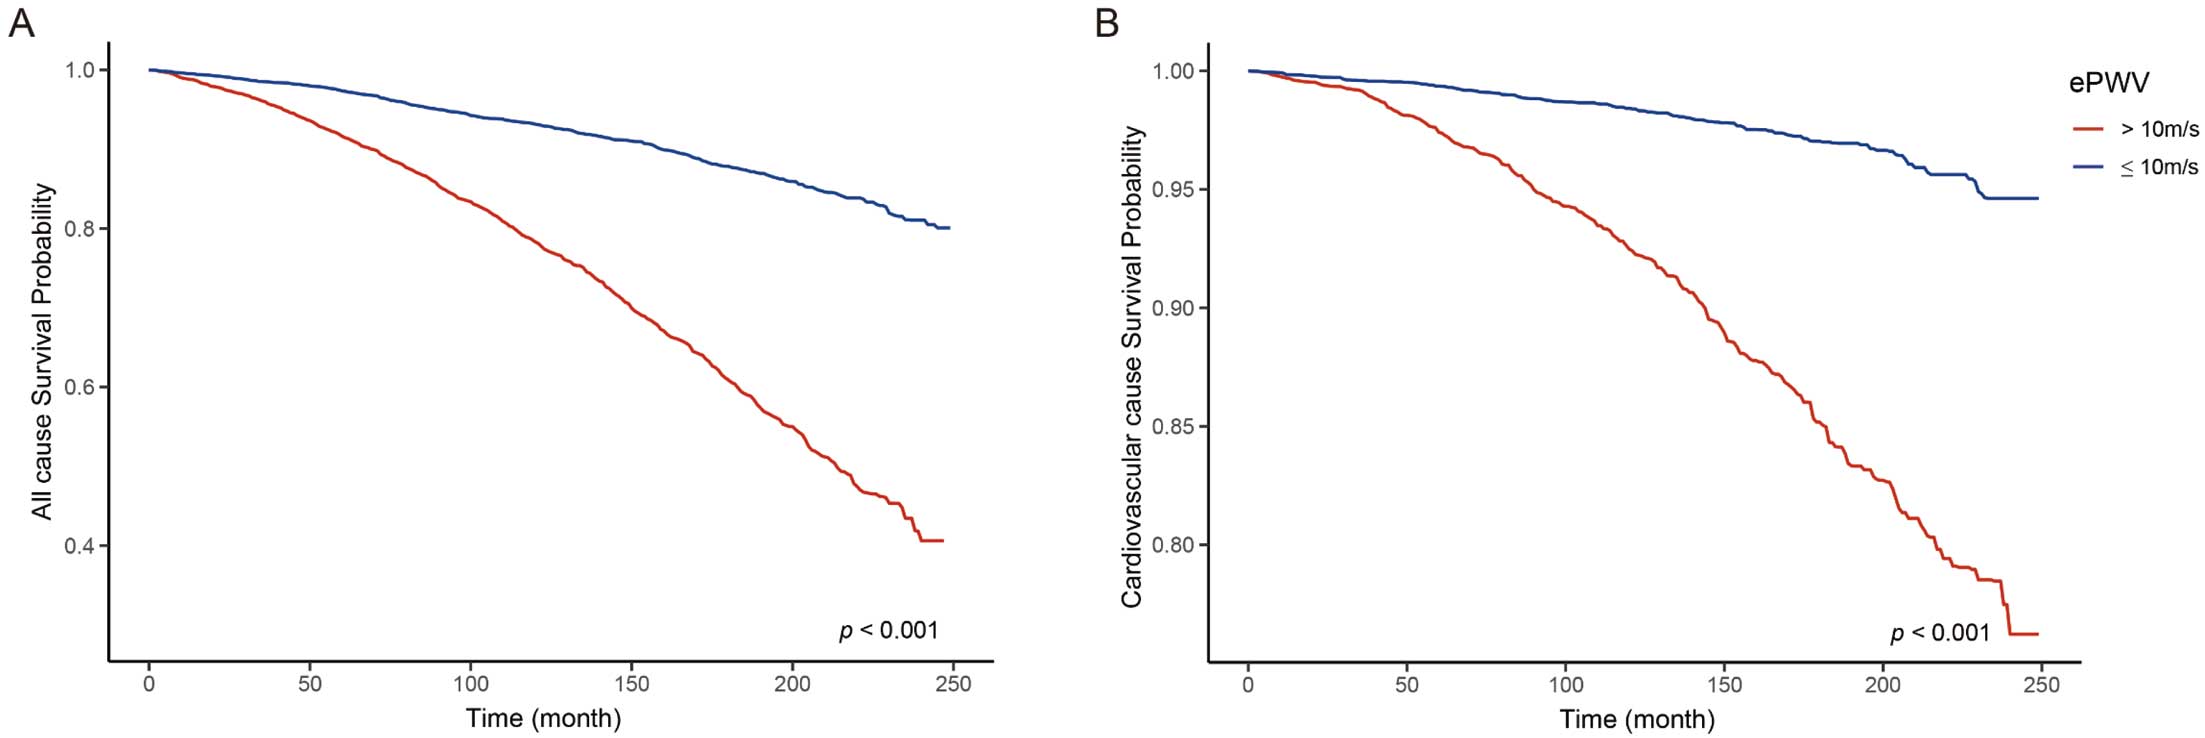

Table 2.
Cox Regression Analysis on the Association Between ePWV and All-Cause Mortality and Cardiovascular Mortality
| |
Non-adjusted model |
Model I |
Model II |
| HR [95% CI] |
P value |
HR [95% CI] |
P value |
HR [95% CI] |
P value |
| All-cause mortality |
| Continuous ePWV |
1.48 [1.44, 1.51] |
<0.001* |
1.49 [1.45, 1.53] |
<0.001* |
1.43 [1.37, 1.48] |
<0.001* |
| Normal ePWV |
Reference |
– |
Reference |
– |
Reference |
– |
| Elevated ePWV |
3.73 [3.35, 4.15] |
<0.001* |
3.79 [3.39, 4.23] |
<0.001* |
2.79 [2.43, 3.20] |
<0.001* |
| Cardiovascular mortality |
| Continuous ePWV |
1.61 [1.53, 1.71] |
<0.001* |
1.64 [1.55, 1.74] |
<0.001* |
1.54 [1.43, 1.66] |
<0.001* |
| Normal ePWV |
Reference |
– |
Reference |
– |
Reference |
– |
| Elevated ePWV |
4.91 [3.83, 6.29] |
<0.001* |
5.14 [3.99, 6.62] |
<0.001* |
3.41 [2.50, 4.64} |
<0.001* |
Continuous ePWV represents HR per 1 m/s increase in ePWV with 95% CIs. Normal ePWV represents ePWV <10 m/s, elevated ePWV represents ePWV ≥10 m/s. Model I adjusted for sex, race/ethnicity, and study circle. Model II adjusted for sex, race/ethnicity, study circle, education levels, BMI, smoking, drinking, diabetes, hyperlipemia, eGFR, CVDs, and CCI. eGFR, estimated glomerular filtration rate; ePWV, estimated pulse wave velocity; HR, hazard ratio. Other abbreviations as in Table 1. *P value <0.001.
Evaluation of Predicting the Value of ePWV for Mortality Outcomes in a Population With Hypertension
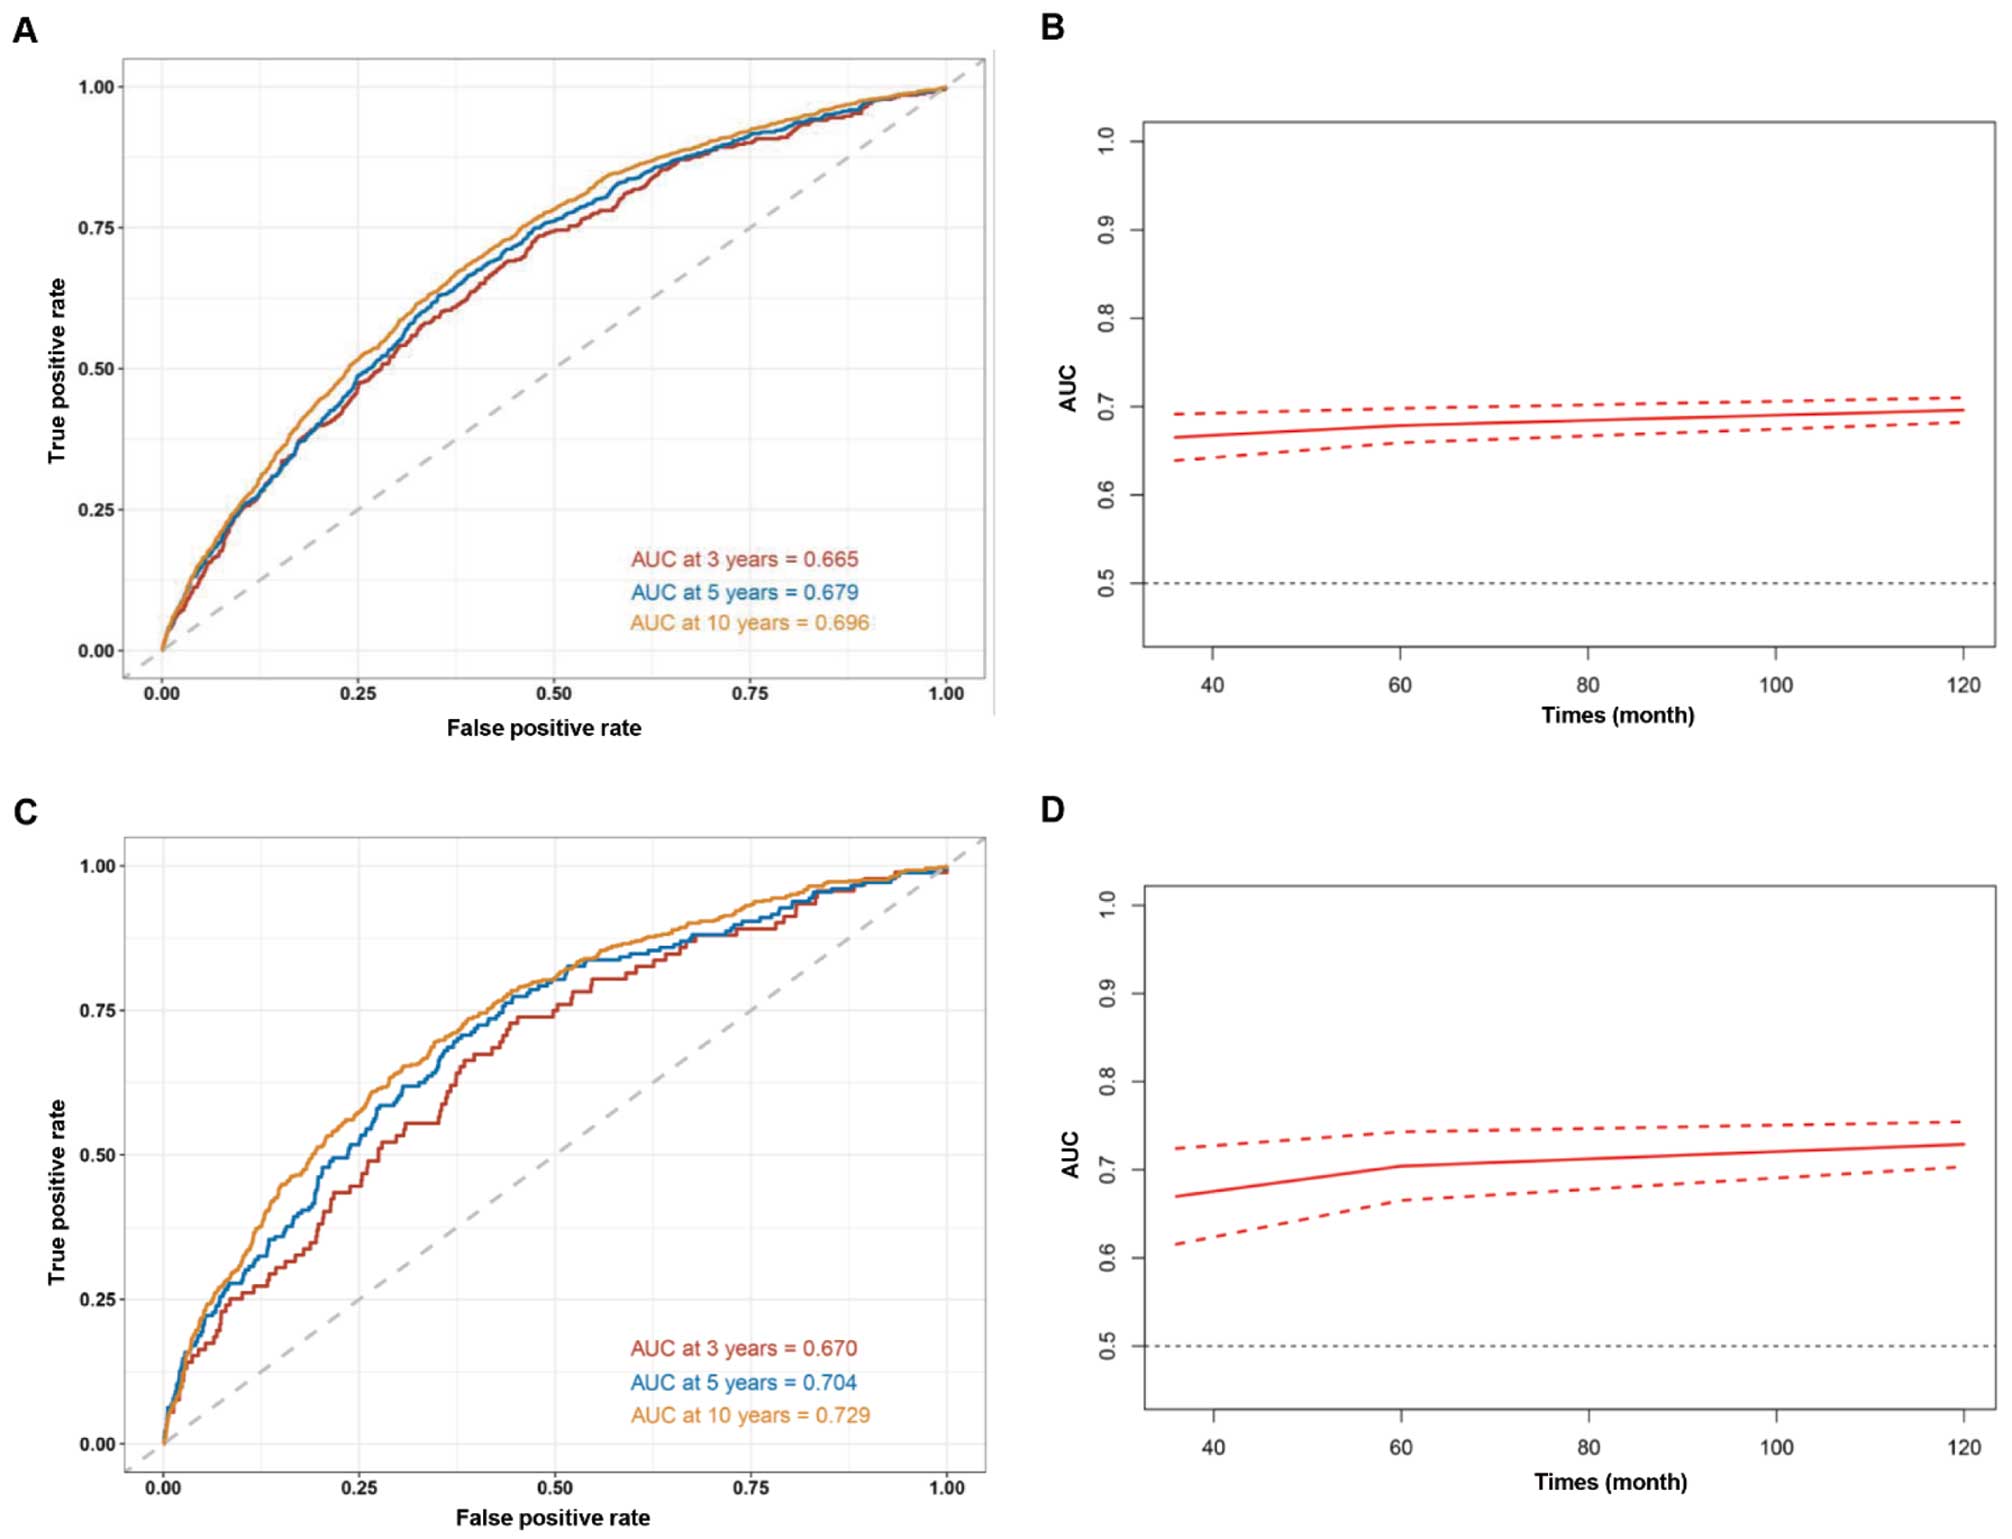
We conducted time-dependent ROC curve analysis to assess the predictive value of ePWV for all-cause mortality and cardiovascular mortality. The findings demonstrated that ePWV exhibited good predictive accuracy for all-cause mortality in the short-term (AUC: 66.5%), medium-term (AUC: 67.9%), and long-term (AUC: 69.6%) (Figure 5A,B). For cardiovascular-caused mortality, ePWV also had a favorable prognostic value, with an AUC of 67.0%, 70.4% and 72.9% in 3, 5, and 10 years, respectively (Figure 5C,D).
Discussion
Arterial stiffness refers to the decreased ability of arteries to expand and contract, whereas hypertension is a condition characterized by high blood pressure levels.30,31 Stiffness is determined by the composition of the arterial wall, which is composed of smooth muscle cells, elastin fibers, and collagen fibers.32–34 With aging, the elastin fibers in the arterial wall become less elastic, leading to an increase in arterial stiffness. In addition, arterial stiffness can also result from inflammation, oxidative stress, and genetic factors.35,36 Hypertension can contribute to arterial stiffness, and increased pressure within the arteries can lead to structural changes in the arterial walls, causing them to become stiffer over time. Arterial stiffness, in turn, exacerbates hypertension by impairing the ability of arteries to accommodate the flow of blood, resulting in higher blood pressure levels. In contrast, hypertension can lead to arterial stiffness by causing remodeling of the arterial wall, leading to an increase in collagen content and a decrease in elastin content.37,38 Also in contrast, arterial stiffness can contribute to the development of hypertension by increasing pulse pressure, leading to endothelial dysfunction, and promoting atherosclerosis.38,39
Arterial stiffness is a strong predictor of cardiovascular risk, independent of traditional cardiovascular risk factors; therefore, the measurement of arterial stiffness could be used as a tool for the identification of individuals at high risk of CVD.40,41 It is crucial to assess arterial stiffness, particularly in high-risk individuals.42 However, cf-PWV is not commonly used in clinical practice.43,44 Brachial-ankle pulse wave velocity (baPWV) is a non-invasive measure used to assess arterial stiffness, which is calculated by measuring the time it takes for the pulse wave to travel from the brachial artery in the arm to the ankle artery in the leg. This measurement is simple and widely used in clinical practice because it requires less specialized equipment and expertise. baPWV has been shown to be a useful tool for evaluating cardiovascular risk and is often utilized to assess arterial health and predict future cardiovascular events.45,46 In 2010, ePWV was first introduced as a novel index to determine the level of arterial stiffness based on age and MBP. The use of ePWV has improved awareness of the hazards of arterial stiffness and aided physicians in clinical practice. This non-invasive measurement technique has played a crucial role in raising awareness among healthcare professionals regarding the potential hazards associated with arterial stiffness.47 By assessing ePWV, physicians can obtain valuable insights into the elastic properties of arteries and their ability to respond to changes in blood pressure. This information enables a more comprehensive evaluation of cardiovascular health and helps identify individuals at higher risk for various cardiovascular conditions. ePWV provides objective measurements of arterial stiffness, allowing for early detection and monitoring of this important risk factor. With this information, physicians can make informed decisions regarding treatment strategies, lifestyle modifications, and interventions to manage arterial stiffness and mitigate associated risks. Therefore, by incorporating this technology into routine clinical assessments, physicians can tailor individualized treatment plans and interventions to improve patient outcomes and overall cardiovascular health. The 2018 guideline from the European Society of Hypertension/European Society of Cardiology (ESH/ESC) suggests using PWV as an indicator of target organ damage for better prediction of cardiovascular risk.48 In the present study, ePWV was both analyzed as a continuous variable and divided into 2 groups using a clinical cut-off point advised by expert consensus and adopted in previously published studies, where the elevated ePWV group had ePWV values of at least 10 m/s and the normal ePWV group had values <10 m/s.29
Actually, researchers have extensively studied the clinical usefulness of ePWV before. Vishram-Nielsen et al conducted a substantial prospective study involving a low-risk European cohort and discovered that ePWV has the ability to forecast cardiovascular outcomes in the overall population.49 Similarly, an analysis of NHANES data revealed that higher ePWV levels strongly correlated with increased risks of cardiovascular and all-cause mortality in the general population.6 Heffernan et al also used NHANES data and discovered that ePWV has a predictive value for specific mortality.7 However, further research is needed to determine the effectiveness of ePWV in high-risk populations. Hametner et al found a correlation between ePWV and mortality in patients with suspected coronary artery disease who undergo invasive angiography.50 Arterial stiffness plays a major role in hypertension and can worsen the condition, leading to a harmful cycle. Vlachopoulos et al studied individuals from the Systolic Blood Pressure Intervention Trial (SPRINT) trial and found that ePWV was linked to increased risk of all-cause mortality and cardiovascular events in hypertensive patients after a follow-up period of 3.26 years.20 Our study differs from the SPRINT cohort study in several aspects: (1) we had a significantly longer follow-up period (a median of 10 years), compared to their median of 3.26 years; (2) we included a larger participant pool of 14,396 individuals, whereas they had 9,361 participants; (3) additionally, we accounted for more comprehensive confounding factors, such as the CCI. However, it is worth noting that in the multivariable Cox regression model, we found that there was multicollinearity between ePWV and age and blood pressure, as ePWV is calculated based on age and MBP. Adjusting for age and blood pressure would affect the model fit;51,52 therefore, we did not include these two covariates in the adjustment.
There are several strengths of our study. First, the long follow-up duration and large-scale sample size allowed for reliable conclusions. Second, the inclusion of participants from the NHANES survey minimized selection bias that can arise from including only specific hospitals and health insurance systems. Finally, the NDI database provided high-quality nationwide registers and direct follow-up and mortality information until death.
There were also several limitations to our study. First, cf-PWV was not available in the NHANES database, and further investigation is necessary to compare its prognostic potential with ePWV. Second, self-reported covariates from the NHANES database might have caused subjective bias. Finally, the generalizability of our findings to other populations outside the US needs further exploration in future studies.
Conclusions
In total, 14,396 adult participants with hypertension were enrolled in the prospective study, over a long-term follow-up period, and it was found that ePWV is associated with the increased risks of all-cause and cardiovascular mortality. As such, ePWV can be used as a prognostic indicator for patients with hypertension. Additionally, our findings highlight the potential benefits of earlier prevention strategies aimed at reducing arterial stiffness and decreasing the burden of hypertension.
Acknowledgments
We acknowledge the NHANES database for their contributors and providing their platforms for uploading meaningful datasets.
Sources of Funding
This research is funded by the National Natural Science Foundation of China (Grant No. 81970309 and No. 82170350).
Disclosures
The authors declare no competing interests.
Author Contributions
S.-L.C., J.-X.Z. and Z.-Y.L. were involved in the experiment design. Y.S., L.-D.W. and X.-H.F. performed the data analysis. Y.S., L.-D.W. and J.-Y.K. wrote the manuscript. C.-H.K. reviewed the manuscript and provided critical suggestions.
IRB Information
The NCHS Ethics Review Board protects the rights and welfare of NHANES participants. The NHANES protocol complies with the U.S. Department of Health and Human Services Policy for the Protection of Human Research Subjects. NCHS IRB/ERC Protocol number: 2011–2017. Ethical review and approval were waived for this study as it solely used publicly available data for research and publication.
Data Availability
Publicly available datasets were analyzed in this study. These data can be found here: https://www.cdc.gov/nchs/nhanes/index.htm.
Supplementary Files
Please find supplementary file(s);
https://doi.org/10.1253/circj.CJ-23-0674
References
- 1.
Carey RM, Moran AE, Whelton PK. Treatment of hypertension: A review. JAMA 2022; 328: 1849–1861.
- 2.
Azizi M, Rossignol P, Hulot JS. Emerging drug classes and their potential use in hypertension. Hypertension 2019; 74: 1075–1083.
- 3.
Safar ME. Arterial stiffness as a risk factor for clinical hypertension. Nat Rev Cardiol 2018; 15: 97–105.
- 4.
Yannoutsos A, Bahous SA, Safar ME, Blacher J. Clinical relevance of aortic stiffness in end-stage renal disease and diabetes: Implication for hypertension management. J Hypertens 2018; 36: 1237–1246.
- 5.
Okamoto M, Shipley MJ, Wilkinson IB, McEniery CM, Valencia-Hernández CA, Singh-Manoux A, et al. Does poorer pulmonary function accelerate arterial stiffening?: A cohort study with repeated measurements of carotid-femoral pulse wave velocity. Hypertension 2019; 74: 929–935.
- 6.
Heffernan KS, Jae SY, Loprinzi PD. Association between estimated pulse wave velocity and mortality in U.S. adults. J Am Coll Cardiol 2020; 75: 1862–1864.
- 7.
Heffernan KS, Jae SY, Loprinzi PD. Estimated pulse wave velocity is associated with residual-specific mortality: Findings from the National Health and Nutrition Examination Survey. J Hypertens 2021; 39: 698–702.
- 8.
Li R, Jia H, Si M, Li X, Ma Z, Zhu Y, et al. Loureirin B protects against cerebral ischemia/reperfusion injury through modulating M1/M2 microglial polarization via STAT6/NF-kappaB signaling pathway. Eur J Pharmacol 2023; 953: 175860.
- 9.
Greve SV, Blicher MK, Kruger R, Sehestedt T, Gram-Kampmann E, Rasmussen S, et al. Estimated carotid-femoral pulse wave velocity has similar predictive value as measured carotid-femoral pulse wave velocity. J Hypertens 2016; 34: 1279–1289.
- 10.
Tembely D, Henry A, Vanalderwiert L, Toussaint K, Bennasroune A, Blaise S, et al. The elastin receptor complex: An emerging therapeutic target against age-related vascular diseases. Front Endocrinol (Lausanne) 2022; 13: 815356.
- 11.
Dieffenbach PB, Aravamudhan A, Fredenburgh LE, Tschumperlin DJ. The mechanobiology of vascular remodeling in the aging lung. Physiology (Bethesda) 2022; 37: 28–38.
- 12.
Zhang L, Li C, Wang S, Avtanski D, Hadzi-Petrushev N, Mitrokhin V, et al. Tetrahydrocurcumin-related vascular protection: An overview of the findings from animal disease models. Molecules 2022; 27: 5100.
- 13.
Ho L, Hossen N, Nguyen T, Vo A, Ahsan F. Epigenetic mechanisms as emerging therapeutic targets and microfluidic chips application in pulmonary arterial hypertension. Biomedicines 2022; 10: 170.
- 14.
Visentin S, Grumolato F, Nardelli GB, Di Camillo B, Grisan E, Cosmi E. Early origins of adult disease: Low birth weight and vascular remodeling. Atherosclerosis 2014; 237: 391–399.
- 15.
Reider CA, Chung RY, Devarshi PP, Grant RW, Hazels Mitmesser S. Inadequacy of immune health mutrients: Intakes in US adults, the 2005–2016 NHANES. Nutrients 2020; 12: 1735.
- 16.
Zhou J, Zhou N, Liu Q, Xie ZP, Xu Y, Dai SC, et al. Prevalence of neutropenia in US residents: A population based analysis of NHANES 2011–2018. BMC Public Health 2023; 23: 1254.
- 17.
Wu LD, Kong CH, Shi Y, Zhang JX, Chen SL. Associations between novel anthropometric measures and the prevalence of hypertension among 45,853 adults: A cross-sectional study. Front Cardiovasc Med 2022; 9: 1050654.
- 18.
Zhou N, Xie ZP, Liu Q, Xu Y, Dai SC, Lu J, et al. The dietary inflammatory index and its association with the prevalence of hypertension: A cross-sectional study. Front Immunol 2022; 13: 1097228.
- 19.
Huang Z. Association between blood lead level with high blood pressure in US (NHANES 1999–2018). Front Public Health 2022; 10: 836357.
- 20.
Vlachopoulos C, Terentes-Printzios D, Laurent S, Nilsson PM, Protogerou AD, Aznaouridis K, et al. Association of estimated pulse wave velocity with survival: A secondary analysis of SPRINT. JAMA Network Open 2019; 2: e1912831.
- 21.
Laugesen E, Olesen KKW, Peters CD, Buus NH, Maeng M, Botker HE, et al. Estimated pulse wave velocity is associated with all-cause mortality during 8.5 years follow-up in patients undergoing elective coronary angiography. J Am Heart Assoc 2022; 11: e025173.
- 22.
Wu LD, Chu P, Kong CH, Shi Y, Zhu MH, Xia YY, et al. Estimated pulse wave velocity is associated with all-cause mortality and cardiovascular mortality among adults with diabetes. Front Cardiovasc Med 2023; 10: 1157163.
- 23.
Fulgoni VL, Drewnowski A. No association between low-calorie sweetener (LCS) use and overall cancer risk in the nationally representative database in the US: Analyses of NHANES 1988–2018 data and 2019 public-use linked mortality files. Nutrients 2022; 14: 4957.
- 24.
Gillum RF. New considerations in analyzing stroke and heart disease mortality trends: The Year 2000 Age Standard and the International Statistical Classification of Diseases and Related Health Problems, 10th Revision. Stroke 2002; 33: 1717–1721.
- 25.
Charlson ME, Carrozzino D, Guidi J, Patierno C. Charlson comorbidity index: A critical review of clinimetric properties. Psychother Psychosom 2022; 91: 8–35.
- 26.
Zhao H, Pan Y, Wang C, Guo Y, Yao N, Wang H, et al. The effects of metal exposures on Charlson Comorbidity Index using zero-inflated negative binomial regression model: NHANES 2011–2016. Biol Trace Elem Res 2021; 199: 2104–2111.
- 27.
WHO Export Consultation. Appropriate body-mass index for Asian populations and its implications for policy and intervention strategies. Lancet 2004; 363: 157–163.
- 28.
Chen L, Zhang J, Zhou N, Weng JY, Bao ZY, Wu LD. Association of different obesity patterns with hypertension in US male adults: A cross-sectional study. Sci Rep 2023; 13: 10551.
- 29.
Van Bortel LM, Laurent S, Boutouyrie P, Chowienczyk P, Cruickshank JK, De Backer T, et al. Expert consensus document on the measurement of aortic stiffness in daily practice using carotid-femoral pulse wave velocity. J Hypertens 2012; 30: 445–448.
- 30.
Dumor K, Shoemaker-Moyle M, Nistala R, Whaley-Connell A. Arterial stiffness in hypertension: An update. Curr Hypertens Rep 2018; 20: 72.
- 31.
Cai Z, Gong Z, Li Z, Li L, Kong W. Vascular extracellular matrix remodeling and hypertension. Antioxid Redox Signal 2021; 34: 765–783.
- 32.
Durham AL, Speer MY, Scatena M, Giachelli CM, Shanahan CM. Role of smooth muscle cells in vascular calcification: Implications in atherosclerosis and arterial stiffness. Cardiovasc Res 2018; 114: 590–600.
- 33.
Cocciolone AJ, Hawes JZ, Staiculescu MC, Johnson EO, Murshed M, Wagenseil JE. Elastin, arterial mechanics, and cardiovascular disease. Am J Physiol Heart Circ Physiol 2018; 315: H189–H205.
- 34.
Weber KT, Pick R, Jalil JE, Janicki JS, Carroll EP. Patterns of myocardial fibrosis. J Mol Cell Cardiol 1989; 21(Suppl 5): 121–131.
- 35.
El Assar M, Álvarez-Bustos A, Sosa P, Angulo J, Rodríguez-Mañas L. Effect of physical activity/exercise on oxidative stress and inflammation in muscle and vascular aging. Int J Mol Sci 2022; 23: 8713.
- 36.
Park S, Lakatta EG. Role of inflammation in the pathogenesis of arterial stiffness. Yonsei Med J 2012; 53: 258–261.
- 37.
Yoon ES, Jae SY, Kim YJ. Exercise-induced hypertension, arterial stiffness, and cardiorespiratory fitness in runners. J Sports Med Phys Fitness 2022; 62: 1397–1403.
- 38.
Safar ME, Asmar R, Benetos A, Blacher J, Boutouyrie P, Lacolley P, et al. Interaction between hypertension and arterial stiffness. Hypertension 2018; 72: 796–805.
- 39.
Chen Y, Zhao X, Wu H. Arterial stiffness: A focus on vascular calcification and its link to bone mineralization. Arterioscler Thromb Vasc Biol 2020; 40: 1078–1093.
- 40.
Ahmadizar F, Voortman T. Arterial stiffness in childhood: A predictor for later cardiovascular disease? Eur J Prev Cardiol 2018; 25: 100–102.
- 41.
Cohen JB, Mitchell GF, Gill D, Burgess S, Rahman M, Hanff TC, et al. Arterial stiffness and diabetes risk in Framingham Heart Study and UK Biobank. Circ Res 2022; 131: 545–554.
- 42.
Ji H, Xiong J, Yu S, Chi C, Bai B, Teliewubai J, et al. Measuring the carotid to femoral pulse wave velocity (Cf-PWV) to evaluate arterial stiffness. J Vis Exp 2018; 2018: 57083.
- 43.
Li Y, Xu Y, Ma Z, Ye Y, Gao L, Sun Y. An XGBoost-based model for assessment of aortic stiffness from wrist photoplethysmogram. Comput Methods Programs Biomed 2022; 226: 107128.
- 44.
Milan A, Zocaro G, Leone D, Tosello F, Buraioli I, Schiavone D, et al. Current assessment of pulse wave velocity: Comprehensive review of validation studies. J Hypertens 2019; 37: 1547–1557.
- 45.
Ohkuma T, Ninomiya T, Tomiyama H, Kario K, Hoshide S, Kita Y, et al. Brachial-ankle pulse wave velocity and the risk prediction of cardiovascular disease: An individual participant data meta-analysis. Hypertension 2017; 69: 1045–1052.
- 46.
Vlachopoulos C, Aznaouridis K, Terentes-Printzios D, Ioakeimidis N, Stefanadis C. Prediction of cardiovascular events and all-cause mortality with brachial-ankle elasticity index: A systematic review and meta-analysis. Hypertension 2012; 60: 556–562.
- 47.
Vlachopoulos C, Aznaouridis K, Stefanadis C. Prediction of cardiovascular events and all-cause mortality with arterial stiffness: A systematic review and meta-analysis. J Am Coll Cardiol 2010; 55: 1318–1327.
- 48.
Williams B, Mancia G, Spiering W, Agabiti Rosei E, Azizi M, Burnier M, et al. 2018 ESC/ESH guidelines for the management of arterial hypertension. Eur Heart J 2018; 39: 3021–3104.
- 49.
Vishram-Nielsen JKK, Laurent S, Nilsson PM, Linneberg A, Sehested TSG, Greve SV, et al. Does estimated pulse wave velocity add prognostic information?: MORGAM Prospective Cohort Project. Hypertension 2020; 75: 1420–1428.
- 50.
Hametner B, Wassertheurer S, Mayer CC, Danninger K, Binder RK, Weber T. Aortic pulse wave velocity predicts cardiovascular events and mortality in patients undergoing coronary angiography: A comparison of invasive measurements and noninvasive estimates. Hypertension 2021; 77: 571–581.
- 51.
Prunier JG, Colyn M, Legendre X, Nimon KF, Flamand MC. Multicollinearity in spatial genetics: Separating the wheat from the chaff using commonality analyses. Mol Ecol 2015; 24: 263–283.
- 52.
Greenland S, Daniel R, Pearce N. Outcome modelling strategies in epidemiology: Traditional methods and basic alternatives. Int J Epidemiol 2016; 45: 565–575.