Abstract
Background: Renal congestion is a potential prognostic factor in patients with heart failure and recently, assessment has become possible with intrarenal Doppler ultrasonography (IRD). The association between renal congestion assessed by IRD and outcomes after mitral transcatheter edge-to-edge repair (TEER) is unknown, so we aimed to clarify renal congestion and its prognostic implications in patients with mitral regurgitation (MR) who underwent TEER using MitraClip system.
Methods and Results: Patients with secondary MR who underwent TEER and were assessed for intrarenal venous flow (IRVF) by IRD were classified according to their IRVF pattern as continuous or discontinuous. Of the 105 patients included, 78 patients (74%) formed the continuous group and 27 (26%) were the discontinuous group. Kaplan-Meier analysis revealed significant prognostic power of the IRVF pattern for predicting the composite outcome of all-cause death and heart failure rehospitalization (log-rank P=0.0257). On multivariate Cox regression analysis, the composite endpoint was independently associated with the discontinuous IRVF pattern (hazard ratio, 3.240; 95% confidence interval, 1.300–8.076; P=0.012) adjusted using inverse probability of treatment weighting.
Conclusions: IRVF patterns strongly correlated with clinical outcomes without changes in renal function. Thus, they may be useful for risk stratification after mitral TEER for patients with secondary MR.
The “cardiorenal syndrome” (CRS) has been described as concomitant impairment of cardiac and renal function in the clinical setting.1 It is caused by inability of the failing heart to generate forward flow, thus resulting in prerenal hypoperfusion,2 which in turn activates the renin-angiotensin-aldosterone system, sympathetic nervous system, and arginine vasopressin secretion, leading to fluid retention, increased preload, and worsening pump failure.3 Finally, the resulting oliguria and renal congestion worsen.4 Renal congestion is recognized as a potential mechanism of the CRS,5 and adequate control of congestion as well as improving and maintaining renal function is one of the central goals in the management of patients with heart failure.6 Transcatheter edge-to-edge repair (TEER) using the MitraClipTM
(Abbott Vascular, Santa Clara, CA, USA) system has become one of the non-medical treatment tools for heart failure in clinical practice.
Editorial p 517
Although the presence of chronic kidney disease would predict poor outcomes, including increased mortality and hospitalization rates among patients who undergo percutaneous mitral valve repair,7 the association of renal congestion with adverse outcomes among patients who have undergone MitraClip therapy is unclear. Recently, it has become possible to assess renal congestion using intrarenal Doppler ultrasonography (IRD) and a discontinuous intrarenal flow pattern on IRD is reportedly associated with worse outcome.8 In the present study, we investigated the association between renal congestion assessed by IRD and outcomes in patients who underwent MitraClip therapy.
Methods
Patient Population
We enrolled consecutive patients who underwent TEER using the MitraClipTM
system at a single center in Asia from April 2018 to July 2020. From this group, patients with secondary mitral regurgitation (MR) who underwent IRD to assess intrarenal venous flow (IRVF) before the procedure were selected and included in the study. Patients with poor image quality or that were difficult to interpret were excluded. Indications for TEER included symptomatic, moderate-to-severe (3+), or severe (4+) MR,9 not only at resting but also on exercise. An interdisciplinary heart team, which included an interventional cardiologist, cardiac surgeon, echocardiologist, and cardiac anesthetist, discussed each participant’s eligibility for TEER. This study was performed in accordance with the ethical principles set forth in the Declaration of Helsinki and was approved by the Ethics Committee of the St. Marianna University School of Medicine (approval no. 5460). The consent acquisition from patients was conducted using an opt-out approach.
Assessment of Renal Congestion
Renal congestion was assessed by IRVF pattern as has been previously reported.8 IRVF patterns were obtained from IRD using an Aplio α or Verifia system (Canon Medical Systems Corp., Tochigi, Japan) with a sector transducer. In the week prior to and following TEER, IRD of the kidneys was performed with the patient in the lateral decubitus position. The velocity range of the color Doppler was set to ≈16 cm/s. Pulsed Doppler waveforms of the interlobar veins were simultaneously acquired.
The study cohort was subdivided into those with a continuous pattern of IRVF (the continuous group) and those with a discontinuous pattern (the discontinuous group) (Figure 1). Discontinuous flow was defined as a pattern in which the minimum velocity range was zero. All measurements were averaged over 3–5 cardiac cycles. Particularly, the beat following 2 preceding cardiac cycles of equal duration was recorded in patients with atrial fibrillation.

Echocardiographic examinations were performed using Vivid E9 (General Electric Healthcare, Vingmed Milwaukee, WI, USA) or EPIQ system (Philips Healthcare, Andover, MA, USA) according to the guidelines for the clinical application of echocardiography.10 Echocardiographic data were stored on a dedicated workstation for offline analysis. Left ventricular end-diastolic and end-systolic volumes, left ventricular ejection fraction, and left atrial volume were measured using the biplane Simpson disk method. All measurements were averaged over 2 cardiac cycles. Furthermore, MR was quantified according to the proximal isovelocity surface area method, the effective regurgitant orifice area, and the regurgitant volume, which indicate the severity of secondary MR. The systolic pulmonary artery pressure (SPAP) was derived from the jet of tricuspid regurgitation using the systolic transtricuspid pressure gradient, which was calculated using the modified Bernoulli equation and the addition of the estimated right atrial pressure, based on the most recent American Society of Echocardiography recommendations.11
Clinical Follow-up
Both technical and device success were based on the Mitral Valve Academic Research Consortium (MVARC) criteria.12 Technical success was defined as: (1) absence of procedural death; (2) successful access, delivery, and retrieval of the device delivery system; (3) successful deployment and correct positioning of the first intended device; and (4) freedom from emergency surgery or reintervention related to the device or access procedure. Device success was defined as: (1) absence of procedural death or stroke; (2) proper placement and positioning of the device; (3) freedom from unplanned surgical or interventional procedures related to the device or access procedure; and (4) continued intended safety and performance of the device. The primary outcome of this study was a composite endpoint of all-cause death or heart failure rehospitalization after undergoing TEER. The follow-up period for the primary outcome was 1 year. The secondary outcomes were all-cause death, cardiovascular death and heart failure rehospitalization after TEER. The occurrence of clinical events was noted from patient medical records. Telephone interviews were also conducted with the patients’ general practitioner or families.
Statistical Analysis
Data are expressed as median and interquartile range for continuous variables and as number and percentage for categorical variables. To determine differences between the continuous and discontinuous groups, the Mann-Whitney U test was used for continuous variables, and the chi-square test for categorical variables. The freedom rate of outcomes was evaluated using Kaplan-Meier analysis and the log-rank test was used for overall significance. Outcomes were evaluated using Cox regression analysis with adjustment by age, sex and left ventricular ejection fraction as model 1 and using inverse probability of treatment weighting (IPTW) as model 2 to address issues of collinearity in the analysis. IPTW is a form of propensity score (PS) analysis in which probability weights are used to reduce imbalance in potential confounding factors of the IRVF pattern. We constructed a PS using logistic regression, and this model was refit in the study subset. Variables included into the model were selected based on their potential association with study outcomes: body mass index, age, estimated glomerular filtration rate (eGFR), hemoglobin, N-terminal pro-brain natriuretic peptide (BNP), albumin, left atrial volume index, SPAP, tricuspid regurgitation, diameter of inferior vena cava and Society of Thoracic Surgeons Predicted Risk of death. The weights were then used to analyze outcomes using cause-specific Cox hazards regression analysis.13 Statistical significance was defined as P<0.05. Analyses were performed using IBM SPSS Statistics for Windows (version 19.0; IBM Corp, Armonk, NY, USA), and EZR software (Saitama Medical Center, Jichi Medical University, Saitama, Japan), which is a graphical user interface for R (The R Foundation for Statistical Computing, Vienna, Austria).
Results
We retrospectively reviewed consecutive cases of secondary MR from 2018 to 2020 and finally 105 cases were included in this study. Of these, 78 patients (74%) were assigned to the continuous group and 27 (26%) to the discontinuous group. The patients with MR caused by leaflet degeneration or systolic anterior motion or who did not undergo IRD, with poor image quality of IRD or difficult interpretation of flow patterns were excluded. The baseline characteristics of the patients are shown in Table 1.
Table 1.
Patients’ Baseline Characteristics According to IVRF Pattern
| Variables |
Continuous flow
group (n=78) |
Discontinuous flow
group (n=27) |
P value |
| Age, years |
78 [55, 91] |
78 [57, 92] |
0.863 |
| Male, n (%) |
53 (67.9) |
16 (59.3) |
0.483 |
| BMI, kg/m2 |
22.5 [15.0, 32.3] |
20.9 [15.0, 28.4] |
0.020 |
| Prior CABG, n (%) |
8 (10.3) |
2 (7.4) |
1.000 |
| Prior PCI, n (%) |
23 (29.5) |
7 (25.9) |
0.809 |
| Atrial fibrillation, n (%) |
52 (70.3) |
18 (69.2) |
1.000 |
| Coronary artery disease, n (%) |
18 (23.1) |
6 (23.1) |
1.000 |
| Chronic kidney disease, n (%) |
58 (74.4) |
24 (92.3) |
0.057 |
| COPD, n (%) |
7 (9.0) |
2 (7.4) |
1.000 |
| Cerebrovascular disease, n (%) |
6 (7.7) |
3 (11.1) |
0.691 |
| Hypertension, n (%) |
64 (82.1) |
21 (77.8) |
0.777 |
| Dyslipidemia, n (%) |
44 (56.4) |
15 (55.6) |
1.000 |
| Diabetes mellitus, n (%) |
29 (37.2) |
12 (44.4) |
0.504 |
| Peripheral artery disease, n (%) |
7 (9.1) |
1 (3.7) |
0.677 |
| NYHA class |
|
|
0.648 |
| 1, n (%) |
0 (0.0) |
0 (0.0) |
|
| 2, n (%) |
11 (14.1) |
4 (14.8) |
|
| 3, n (%) |
60 (76.9) |
19 (70.4) |
|
| 4, n (%) |
7 (9.0) |
4 (14.8) |
|
| Albumin, g/dL |
3.8 [2.7, 4.7] |
3.4 [2.2, 4.4] |
0.001 |
| Hemoglobin, g/dL |
12.3 [9.0, 16.3] |
10.3 [8.5, 15.6] |
<0.001 |
| NT-pro BNP, pg/mL |
1,759.0 [179.0, 10,862.0] |
4,459.0 [473.0, 23,576.0] |
0.001 |
| eGFR, mL/min/1.73 m2 |
39.6 [28.0, 53.3] |
41.1 [26.5, 52.7] |
0.543 |
| STS risk score, % |
6.94 [2.03, 32.70] |
13.30 [2.68, 52.66] |
0.002 |
| Atrial secondary MR, n (%) |
13 (16.9) |
6 (22.2) |
0.568 |
| LV-EDV, mL |
143.0 [36.0, 519.0] |
136.0 [66.0, 279.0] |
0.778 |
| LV-ESV, mL |
85.5 [12.0, 472.0] |
72.0 [24.0, 219.0] |
0.789 |
| LVEF, % |
40.0 [17.00, 80.0] |
46.0 [22.0, 63.0] |
0.849 |
| LAVi, mL/m2 |
64.6 [25.6, 201.6] |
84.2 [23.2, 234.3] |
0.018 |
| SPAP, mmHg |
29.6 [15.8, 69.8] |
48.9 [20.1, 66.0] |
<0.001 |
| TAPSE, mm |
14.5 [3.8, 30.4] |
14.2 [4.9, 24.6] |
0.250 |
| IVC diameter, mm |
15.8 [13.0, 21.0] |
17.2 [11.8, 22.1] |
0.814 |
| Moderate or greater MR, n (%) |
40 (51.3) |
21 (77.8) |
0.008 |
| Moderate or greater TR, n (%) |
19 (24.4) |
18 (66.6) |
<0.001 |
Data are n (%) or median (interquartile range). BMI, body mass index; CABG, coronary artery bypass graft; COPD, chronic obstructive pulmonary disease; eGFR, estimated glomerular filtration rate; IVC, inferior vena cava; IVRF, intrarenal venous flow; LAVi, left atrial volume index; LVEDV, left ventricular end-diastolic volume; LVESV, left ventricular end-systolic volume; LVEF, left ventricle ejection fraction; MR, mitral regurgitation; NT-pro BNP, N-terminal pro-brain natriuretic peptide; NYHA, New York Heart Association; PCI, percutaneous coronary intervention; SPAP, systolic pulmonary artery pressure; STS, Society of Thoracic Surgeons; TAPSE, tricuspid annular plane systolic excursion; TR, tricuspid regurgitation.
Compared with the continuous group, the discontinuous group had lower body mass index (20.90 kg/m2
[15.00–28.40] vs. 22.50 kg/m2
[15.00–32.30], P=0.002), lower albumin levels (3.40 g/dL [2.20–4.40] vs. 3.80 g/dL [2.70–4.70], P=0.001), lower hemoglobin levels (10.30 g/dL [8.50–15.60] vs. 12.30 g/dL [9.00–16.30], P<0.001), higher NT-pro BNP levels (4,459 pg/mL [473–23,576] vs. 1,759 pg/mL [179–10,862], P=0.001), and higher Society of Thoracic Surgeons surgical risk scores (13.30% [2.68–52.66%] vs. 6.94% [2.03–32.70%], P=0.002). Patients in the discontinuous group had significantly higher SPAP values (48.90 mmHg [20.10–66.00] vs. 29.60 mmHg [15.80–69.80], P<0.001) and a greater left atrial volume index (84.20 mL/m2
[23.20–234.30] vs. 64.60 mL/m2
[25.60–201.60], P=0.018) than those in the continuous group. The discontinuous group had a higher prevalence of moderate or greater MR (77.8% vs. 51.3%, P=0.008) and tricuspid regurgitation (66.6% vs. 24.4%, P<0.001) at rest.
Procedural and Clinical Outcomes
Technical and device success rates were comparable between groups (Table 2). During the 1-year follow-up, 19% of the total population met the composite endpoint: the all-cause mortality rate was 12.4% and heart failure rehospitalization was 9.5%. Kaplan-Meier analysis showed that the discontinuous group had higher incidences of the composite endpoint (log-rank P=0.0257) and all-cause death (log-rank P=0.0103) than the continuous group (Figure 2). After applying IPTW (Table 3), the discontinuous pattern of IRVF was significantly associated with an increased risk of the composite endpoint (hazard ratio [HR], 3.240; 95% confidence interval [CI], 1.300–8.076; P=0.012), all-cause death (HR, 5.389; 95% CI, 1.775–16.370; P=0.003), and heart failure rehospitalization (HR, 3.901; 95% CI, 1.032–14.750; P=0.045).
Table 2.
Periprocedural Characteristics of the IRVF Pattern Groups
| Variables |
Continuous flow
group (n=78) |
Discontinuous flow
group (n=27) |
P value |
| Technical success rate (%) |
77 (98.7) |
26 (96.3) |
0.450 |
| Device success rate (%) |
51 (65.4) |
14 (51.9) |
0.253 |
| No. of clips (%) |
|
|
0.427 |
| 1, n (%) |
56 (71.8) |
16 (59.3) |
|
| 2, n (%) |
21 (26.9) |
11 (40.7) |
|
| Grade of residual MR |
|
|
0.139 |
| 0, n (%) |
19 (24.4) |
4 (14.8) |
|
| 1, n (%) |
43 (55.1) |
15 (55.6) |
|
| 2, n (%) |
16 (20.5) |
6 (22.2) |
|
| 3, n (%) |
0 (0.0) |
0 (0.0) |
|
| 4, n (%) |
0 (0.0) |
2 (7.4) |
|
| Postprocedural MV mean PG, mmHg |
2.80 [0.80, 7.70] |
3.00 [0.80, 7.00] |
0.402 |
Data are n (%) or median (interquartile range). IVRF, intrarenal venous flow; MR, mitral regurgitation; MV, mitral valve; PG, pressure gradient.
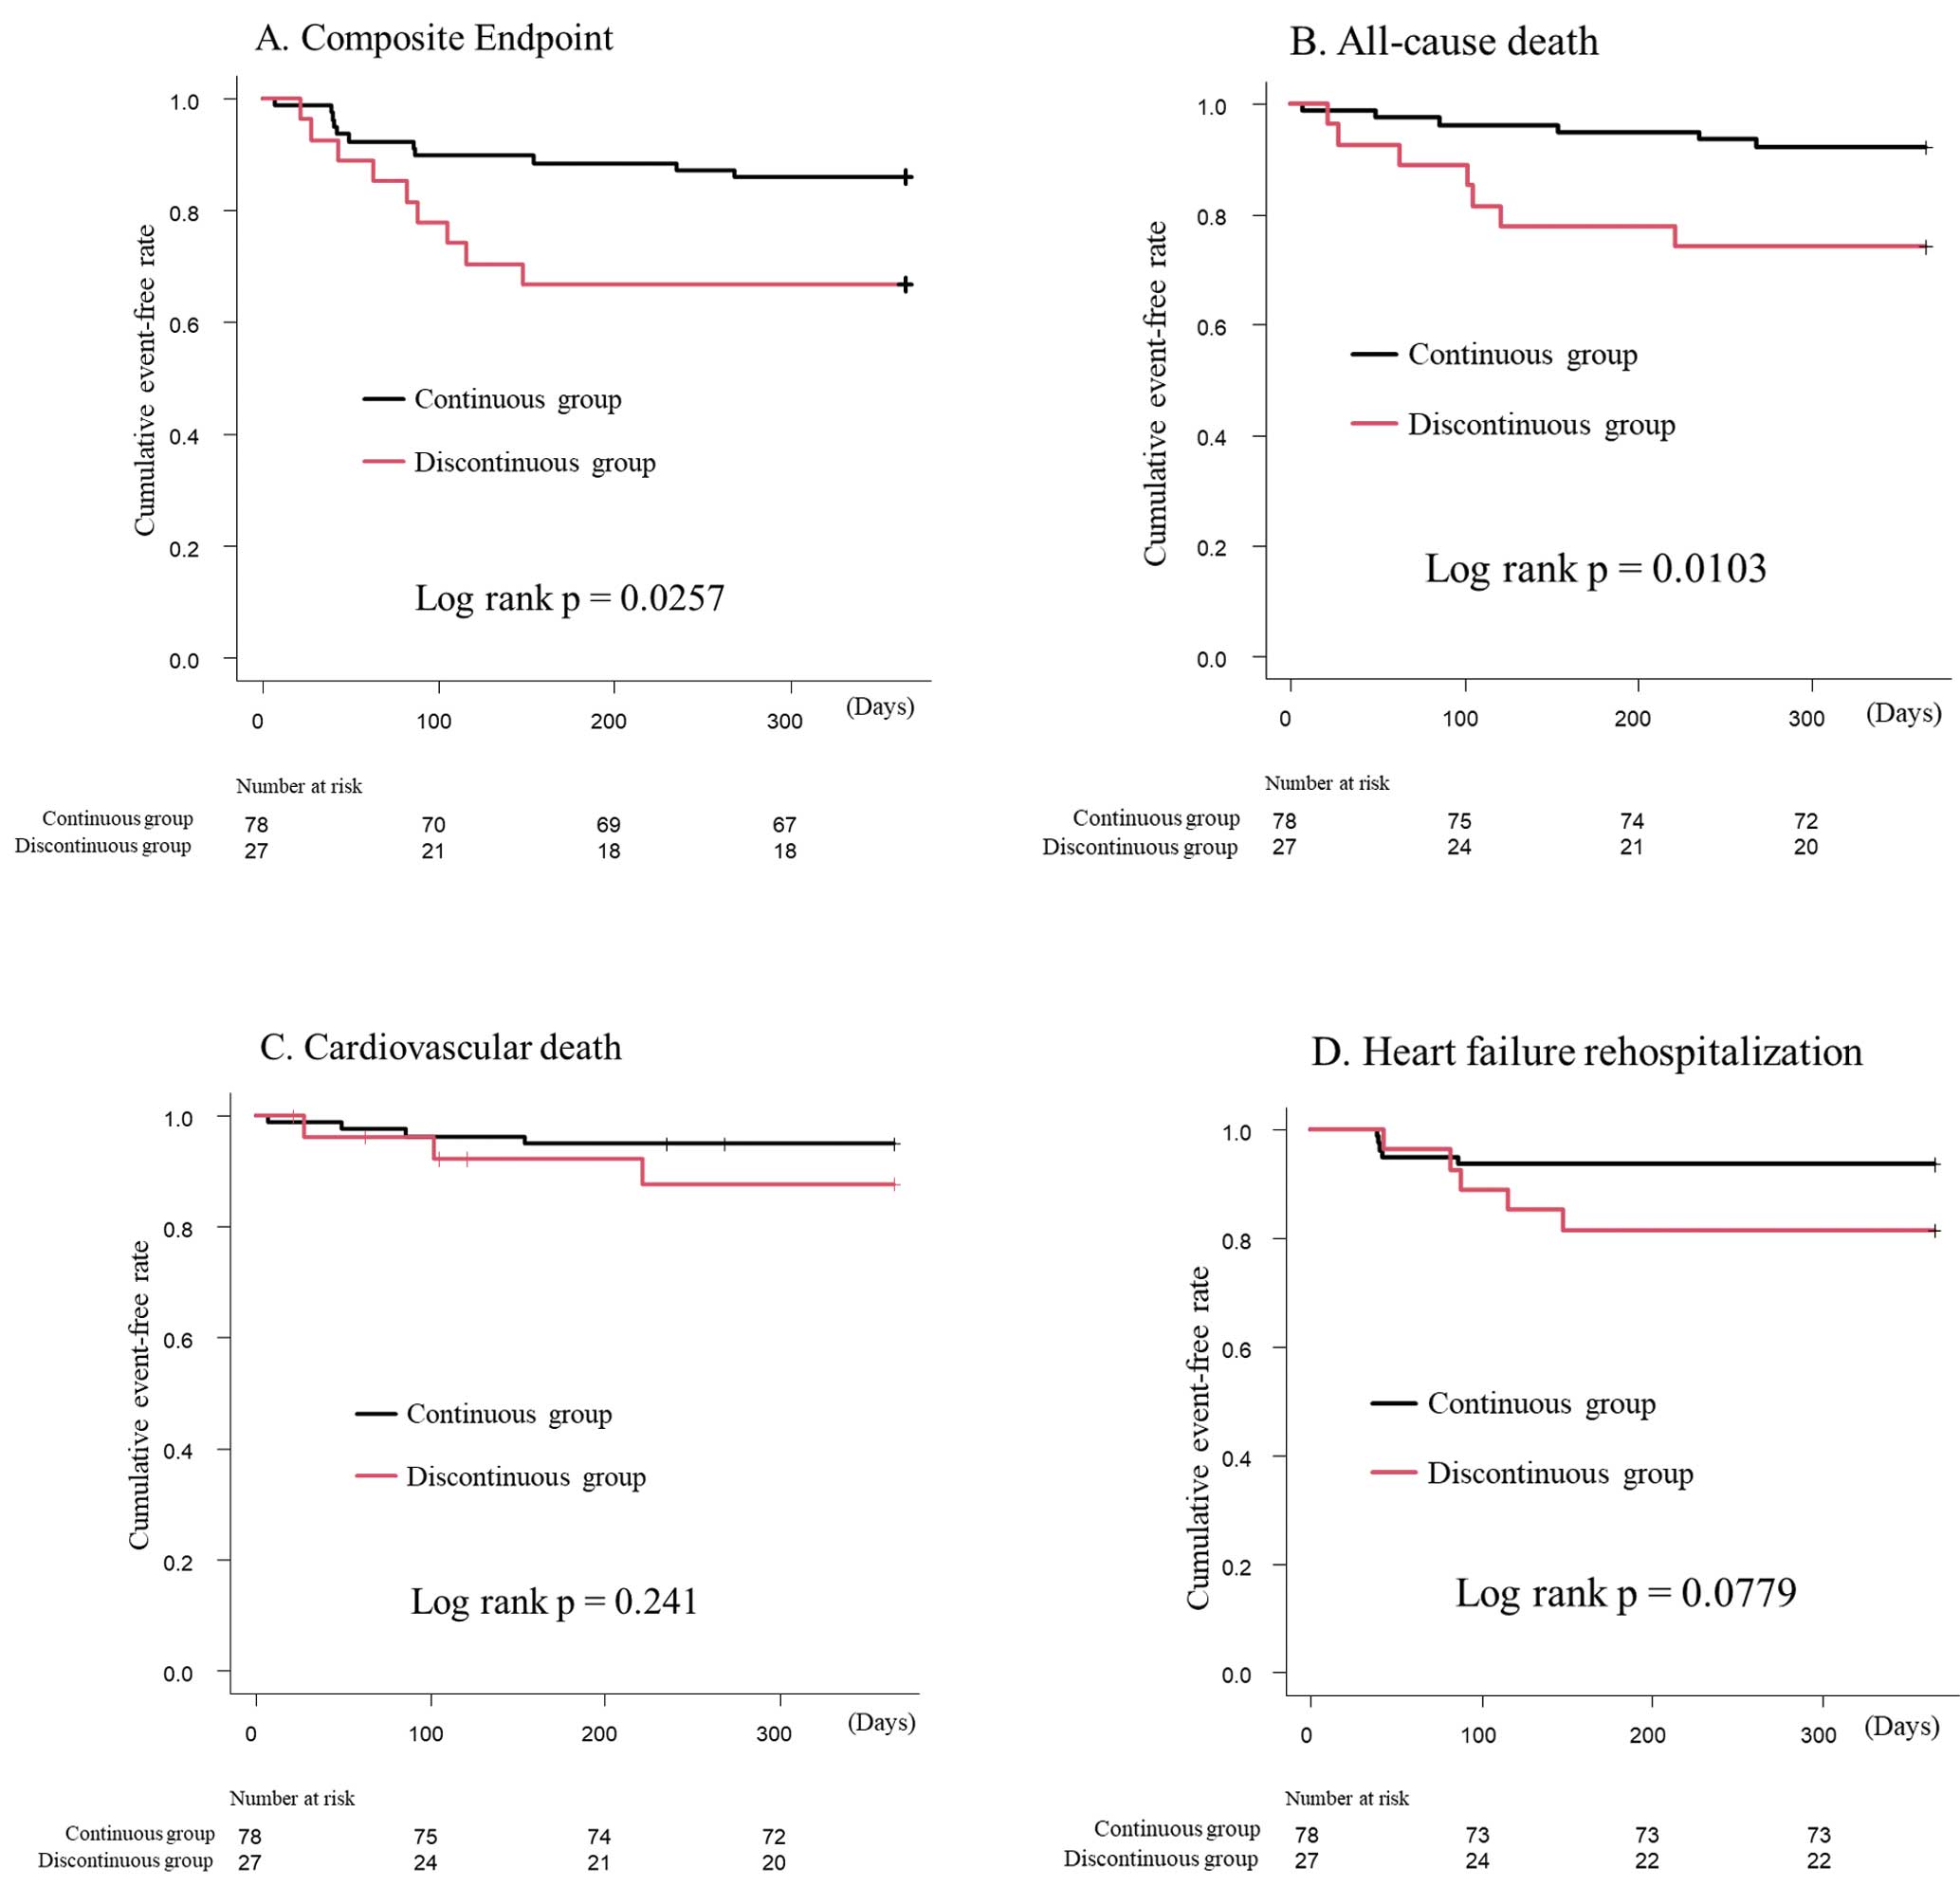
Table 3.
Incidence of Clinical Outcomes
| |
HR |
95% CI |
P value |
| Composite endpoint |
| Unadjusted |
2.628 |
1.088–0.347 |
0.032 |
| Model 1 |
2.530 |
1.045–6.123 |
0.040 |
| Model 2 |
3.240 |
1.300–8.076 |
0.012 |
| All-cause death |
| Unadjusted |
3.777 |
1.268–11.250 |
0.017 |
| Model 1 |
3.792 |
1.266–11.350 |
0.017 |
| Model 2 |
5.389 |
1.775–16.370 |
0.003 |
| Cardiovascular death |
| Unadjusted |
2.383 |
0.533–10.660 |
0.256 |
| Model 1 |
2.330 |
0.517–10.500 |
0.271 |
| Model 2 |
4.040 |
0.879–18.570 |
0.073 |
| HF rehospitalization |
| Unadjusted |
2.899 |
0.839–10.020 |
0.092 |
| Model 1 |
2.865 |
0.820–10.000 |
0.099 |
| Model 2 |
3.901 |
1.032–14.750 |
0.045 |
Model 1 adjusted for age, sex and left ventricular ejection fraction. Model 2 adjusted Cox Model utilizing IPTW method, which accounted for body mass index, age, estimated glomerular filtration rate, hemoglobin, N-terminal pro-brain natriuretic peptide, albumin, left atrial volume index, systolic pulmonary artery pressure, tricuspid regurgitation, maximal diameter of inferior vena cava and Society of Thoracic Surgeons surgical risk score. CI, confidence interval; HR, hazard ratio; IPTW, inverse probability of treatment weighting.
Discussion
We aimed to ascertain whether renal congestion assessed by IRVF pattern was associated with a composite endpoint in patients with secondary MR who underwent MitraClip therapy. The main findings were as follows. (1) Approximately 26% of patients with secondary MR who underwent TEER with MitraClip showed evidence of renal congestion, (2) the discontinuous IRVF pattern was an independently significant predictor for the composite endpoint in patients with significant MR who underwent MitraClip therapy; and (3) the majority of patients with renal congestion did not improve immediately following TEER.
As previously reported, the presence of congestion has a negative impact on clinical outcomes of patients with heart failure. Even if adjusted for cardiac index, elevated central venous pressure is associated with increased mortality rates and reduced eGFR.14 As a previous preclinical study showed, elevated central venous pressure causes renal venous hypertension, increased renal resistance, and finally, impaired intrarenal blood flow.15 Furthermore, renal congestion is caused by an increase in central venous pressure, resulting in a change in IRVF that can be assessed using Doppler echography. The IRVF has either a continuous or discontinuous pattern,16,17 and is emerging as a tool that can be used as a marker of renal venous congestion. The patterns also have clinical significance in the CRS. Iida et al examined the IRVF patterns that were associated with right atrial pressure and strongly with clinical outcomes.8 Recently, the IRVF profiles of patients with heart failure were studied.18 To our knowledge, this study is the first to assess the negative impact of the discontinuous IRVF pattern on IRD in patients who underwent TEER. Our analysis showed that renal congestion was independently associated with worse outcomes in patients who underwent TEER, similar to what was described for heart failure patients by Iida et al.8 Our study expands on those results by demonstrating the IRVF patterns observed in patients who underwent MitraClip therapy.
The treatment of renal congestion involves addressing the underlying condition that is causing the increase in central venous pressure. In most cases, that is heart failure, and treatment involves optimizing its management. In our study, patients with discontinuous IRVF had pulmonary hypertension with high SPAP, which is the same trend in baseline characteristics according to the IRVF pattern as those of previously published reports.18,19
Based on the COAPT trial,20 MitraClip therapy is considered a favorable option for the treatment of heart failure, and is also expected to be a good option for renal congestion. The forward stroke volume is increased after TEER,21 which should improve hemodynamics and result in improved renal congestion. Among the present patients who had a discontinuous IRVF pattern prior to MitraClip therapy, the majority demonstrated improvement in MR grade; however, only 30% showed an improvement to a continuous IRVF pattern following MitraClip therapy (Supplementary Figure). Chiba et a. reported intrarenal fibrosis associated with IRVF pulsation in a rat hypertension model, indicating that stiffness of the renal parenchyma is also reflected in the IRVF.22 Renal fibrosis likely occurs because of chronic renal hypoperfusion. In our cohort, patients with a discontinuous IRVF pattern would have had chronic CRS that caused a fibrotic renal condition. It is important to note that the treatment of heart failure should be individualized according to the underlying condition and other patient factors. Close monitoring of renal congestion by IRD is essential in patients with severe secondary MR to ensure timely and appropriate management. According to our results, IRVF patterns can help assess when MitraClip therapy should be implemented to improve procedural outcome, and we suggest that MitraClip therapy should be considered prior to the development of renal congestion.
Study Limitations
This was a single-center study with a small sample size, which limits its generalizability. Furthermore, this study focused on short-term results. Properly designed trials with longer follow-up periods and more patients are required to confirm our results.
Conclusions
The IRVF pattern can predict poor outcomes in patients who undergo MitraClip therapy. The pattern can be assessed using noninvasive imaging and may help determine the most appropriate timing of MitraClip therapy.
Acknowledgments
The authors thank the structural heart disease Heart Team at St. Marianna University School of Medicine Hospital for their assistance.
Disclosure of Potential Conflicts of Interest
S.K. and M.I. are consultants for Abbott Medical Japan. Y.J.A. is a member of Circulation Journal’s Editorial Team. The other authors declare no conflicts of interest.
IRB Information
The Ethics Committee of St. Marianna University School of Medicine approved the study protocol (approval no. 5460).
Supplementary Files
Please find supplementary file(s);
https://doi.org/10.1253/circj.CJ-23-0240
References
- 1.
Ronco C, Haapio M, House AA, Anavekar N, Bellomo R. Cardiorenal syndrome. J Am Coll Cardiol 2008; 52: 1527–1539, doi:10.1016/j.jacc.2008.07.051.
- 2.
Rangaswami J, Bhalla V, Blair JEA, Chang TI, Costa S, Lentine KL, et al. Cardiorenal syndrome: Classification, pathophysiology, diagnosis, and treatment strategies: A Scientific Statement from the American Heart Association. Circulation 2019; 139: e840–e878, doi:10.1161/CIR.0000000000000664.
- 3.
Schrier RW, Abraham WT. Hormones and hemodynamics in heart failure. N Engl J Med 1999; 341: 577–585, doi:10.1056/NEJM199908193410806.
- 4.
Ichikawa I, Pfeffer JM, Pfeffer MA, Hostetter TH, Brenner BM. Role of angiotensin II in the altered renal function of congestive heart failure. Circ Res 1984; 55: 669–675, doi:10.1161/01.res.55.5.669.
- 5.
Afsar B, Ortiz A, Covic A, Solak Y, Goldsmith D, Kanbay M. Focus on renal congestion in heart failure. Clin Kidney J 2016; 9: 39–47, doi:10.1093/ckj/sfv124.
- 6.
Aronson D. Cardiorenal syndrome in acute decompensated heart failure. Expert Rev Cardiovasc Ther 2012; 10: 177–189, doi:10.1586/erc.11.193.
- 7.
Lo KB, Dayanand S, Ram P, Dayanand P, Slipczuk LN, Figueredo VM, et al. Interrelationship between kidney function and percutaneous mitral valve interventions: A comprehensive review. Curr Cardiol Rev 2019; 15: 76–82, doi:10.2174/1573403X14666181024155247.
- 8.
Iida N, Seo Y, Sai S, Machino-Ohtsuka T, Yamamoto M, Ishizu T, et al. Clinical implications of intrarenal hemodynamic evaluation by Doppler ultrasonography in heart failure. JACC Heart Fail 2016; 4: 674–682, doi:10.1016/j.jchf.2016.03.016.
- 9.
Zoghbi WA, Enriquez-Sarano M, Foster E, Grayburn PA, Kraft CD, Levine RA, et al. Recommendations for evaluation of the severity of native valvular regurgitation with two-dimensional and Doppler echocardiography. J Am Soc Echocardiogr 2003; 16: 777–802, doi:10.1016/S0894-7317(03)00335-3.
- 10.
Ohte N, Ishizu T, Izumi C, Itoh H, Iwanaga S, Okura H, et al. JCS 2021 guideline on the clinical application of echocardiography. Circ J 2022; 86: 2045–2119, doi:10.1253/circj.CJ-22-0026.
- 11.
Rudski LG, Lai WW, Afilalo J, Hua L, Handschumacher MD, Chandrasekaran K, et al. Guidelines for the echocardiographic assessment of the right heart in adults: A report from the American Society of Echocardiography endorsed by the European Association of Echocardiography, a registered branch of the European Society of Cardiology, and the Canadian Society of Echocardiography. J Am Soc Echocardiogr 2010; 23: 685–713; quiz 786–788, doi:10.1016/j.echo.2010.05.010.
- 12.
Stone GW, Vahanian AS, Adams DH, Abraham WT, Borer JS, Bax JJ, et al. Clinical trial design principles and endpoint definitions for transcatheter mitral valve repair and replacement. Part 1: Clinical trial design principles: A consensus document from the Mitral Valve Academic Research Consortium. J Am Coll Cardiol 2015; 66: 278–307, doi:10.1016/j.jacc.2015.05.046.
- 13.
Federspiel JJ, Anstrom KJ, Xian Y, McCoy LA, Effron MB, Faries DE, et al. Comparing inverse probability of treatment weighting and instrumental variable methods for the evaluation of adenosine diphosphate receptor inhibitors after percutaneous coronary intervention. JAMA Cardiol 2016; 1: 655–665, doi:10.1001/jamacardio.2016.1783.
- 14.
Damman K, van Deursen VM, Navis G, Voors AA, van Veldhuisen DJ, Hillege HL. Increased central venous pressure is associated with impaired renal function and mortality in a broad spectrum of patients with cardiovascular disease. J Am Coll Cardiol 2009; 53: 582–588, doi:10.1016/j.jacc.2008.08.080.
- 15.
Winton FR. The influence of venous pressure on the isolated mammalian kidney. J Physiol 1931; 72: 49–61, doi:10.1113/jphysiol1931.sp002761.
- 16.
Jeong SH, Jung DC, Kim SH, Kim SH. Renal venous doppler ultrasonography in normal subjects and patients with diabetic nephropathy: Value of venous impedance index measurements. J Clin Ultrasound 2011; 39: 512–518, doi:10.1002/jcu.20835.
- 17.
Bateman GA, Giles W, England SL. Renal venous Doppler sonography in preeclampsia. J Ultrasound Med 2004; 23: 1607–1611, doi:10.7863/jum.2004.23.12.1607.
- 18.
Seo Y, Iida N, Yamamoto M, Ishizu T, Ieda M, Ohte N. Doppler-derived intrarenal venous flow mirrors right-sided heart hemodynamics in patients with cardiovascular disease. Circ J 2020; 84: 1552–1559, doi:10.1253/circj.CJ-20-0332.
- 19.
Yoshihisa A, Watanabe K, Sato Y, Ishibashi S, Matsuda M, Yamadera Y, et al. Intrarenal Doppler ultrasonography reflects hemodynamics and predicts prognosis in patients with heart failure. Sci Rep 2020; 10: 22257, doi:10.1038/s41598-020-79351-6.
- 20.
Stone GW, Lindenfeld J, Abraham WT, Kar S, Lim DS, Mishell JM, et al. Transcatheter mitral-valve repair in patients with heart failure. N Engl J Med 2018; 379: 2307–2318, doi:10.1056/NEJMoa1806640.
- 21.
Kubo S, Nakamura M, Shiota T, Itabashi Y, Mizutani Y, Nakajima Y, et al. Impact of forward stroke volume response on clinical and structural outcomes after percutaneous mitral valve repair with Mitraclip. Circ Cardiovasc Interv 2017; 10: e004909, doi:10.1161/CIRCINTERVENTIONS.116.004909.
- 22.
Chiba H, Seo Y, Sai S, Namekawa M, Ishizu T, Aonuma K. Renoprotective effects of tolvaptan in hypertensive heart failure rats depend on renal decongestion. Hypertens Res 2019; 42: 319–328, doi:10.1038/s41440-018-0169-3.

