Abstract
Background: Extracellular volume fraction (ECV) on magnetic resonance imaging can predict prognosis after aortic valve replacement in patients with aortic stenosis (AS). However, the usefulness of ECV on computed tomography (CT) for patients who have undergone transcatheter aortic valve replacement (TAVR) is unclear, so we investigated whether ECV analysis on CT is associated with clinical outcomes in TAVR candidates.
Methods and Results: We analyzed 127 patients with severe AS who underwent preoperative CT for TAVR. We evaluated the utility of ECV analysis on single-energy CT for predicting patient prognosis after TAVR. The primary outcome was a composite of all-cause death and hospitalization due to heart failure (HF) after TAVR. 15 patients (12%) had composite outcomes: 4 deaths and 11 hospitalizations due to HF. In multivariate survival analysis using the Cox proportional hazard model, atrial fibrillation (AF) (hazard ratio (HR), 7.86; 95% confidence interval (CI), 2.57–24.03; P<0.001), history of congestive HF (HR, 4.91; 95% CI, 1.49–16.2; P=0.009) and ECV ≥32.6% on CT (HR, 6.96; 95% CI, 1.92–25.12; P=0.003) were independent predictors of composite outcomes. On Kaplan-Meier analysis, the higher ECV group (≥32.6%) had a significantly greater number of composite outcomes than the lower ECV group (P<0.001).
Conclusions: ECV on CT is an independent predictor of prognosis after TAVR.
Aortic valve stenosis (AS) involves both the valve and left ventricular (LV) hypertrophic myocardium. Hypertrophy of the LV myocardium (LVM) is a compensatory mechanism to restore wall stress and maintain cardiac output under the continuously increasing pressure overload caused by AS, and can result in heart failure (HF).1 Surgical aortic valve replacement (SAVR) or transcatheter aortic valve replacement (TAVR) often induce reverse remodeling by reducing the wall stress and overload of the LV. However, advanced pathological changes can become uncontrolled, even with SAVR or TAVR, leading to cardiac dysfunction and poor prognosis.2
Myocyte death and myocardial fibrosis in AS are the leading causes of HF resulting from compensated hypertrophy.3 Cardiac magnetic resonance imaging (CMR) is the gold standard noninvasive method used for assessing myocardial damage.4 Although late gadolinium enhancement (LGE) can detect focal myocardial damage, extracellular volume fraction (ECV) analysis using T1 mapping is also helpful for quantitative analysis of diffuse myocardial damage.5,6 Several studies have observed regression of diffuse fibrosis after pressure overload relief with SAVR,7 and reported that ECV analysis on CMR predicts prognosis in patients with AS.3
Computed tomography (CT) can evaluate both coronary artery stenosis and the aortic valve, making it highly useful in TAVR candidates.8,9 ECV analysis on CT has been reported to be strongly correlated with ECV analysis on CMR.10 In addition, ECV analysis on CT is easy to perform in TAVR candidates because ECV can be assessed by simply adding a late-phase scan to CT, which is routinely performed before TAVR to assess the anatomy of the aortic valvar complex, vascular access, and coronary artery stenosis. However, few studies have examined the association of ECV analysis on CT with prognosis after TAVR in patients with severe AS.
Methods
Study Population
This retrospective observational cohort study was conducted on 154 consecutive patients with severe AS who underwent preoperative CT for TAVR between June 2020 and March 2022. All patients underwent transthoracic echocardiography (TTE) prior to TAVR. We excluded patients who underwent SAVR (n=5), conservative treatment (n=7), had severe mitral regurgitation (n=2), previous SAVR (n=1), and poor image quality due to mitral annulus calcification artifacts (n=12) (Figure 1). Finally, 127 patients were included. Patient medical history, clinical treatments, and laboratory tests were obtained from electronic medical records. TAVR was performed via a transfemoral or trans-subclavian approach, using either balloon-expandable (Edwards Sapien: n=97) or self-expanding (Medtronic Evolut or Corevalve: n=30) devices. The study protocol complied with the guidelines of the Declaration of Helsinki, and the study was approved by the institutional ethics committee.
CT Protocol
All subjects lay supine on the scanner table and imaging was performed using a 320-row multidetector CT (Aquilion One/ViSION Edition, Canon Medical Systems, Otawara, Japan) or 256-row multidetector CT (Revolution CT Apex, GE Healthcare, Milwaukee, WI, USA). A scout scan and non-contrast ECG-gated cardiac scan were performed using a prospective ECG-gated technique before the contrast scan. CT was performed with a slice thickness of 0.5 mm and tube voltage of 80–120 kV for 320-row CT or a slice thickness of 0.625 mm and tube voltage of 70 kV for 256-row CT.
Retrospective ECG-gating with the dose modulation technique was used to decrease the radiation dose during systolic phases where possible and to maintain high diagnostic performance to detect significant coronary artery stenosis.9 Conventional enhanced CT was performed with a slice thickness of 0.5 mm and tube voltage of 120 or 135 kV for 320-slice CT or a slice thickness of 0.625 mm and tube voltage of 120 kV for 256-slice CT.9 All patients with a heart rate >65 beats/min received 12.5 mg landiolol prior to scanning, except those for whom β-blockers were contraindicated. Just prior to the scanning procedure, subjects were administered 2 doses of isosorbide dinitrate sublingually to assess significant coronary artery disease (CAD). Right or left antecubital intravenous access was attained using a 20- or 22-gauge needle, and the system was connected to a dual-syringe injector with a dual-flow option (Dual Shot, Nemoto GX7, Tokyo, Japan). During the first phase, we injected 40–100 mL of undiluted iodinate contrast agent (350–370 mgI/mL) at 3–5 mL/s, followed by 0–50 mL of a 50%/50% saline-to-contrast material mixture at 3–4 mL/s and 20–30 mL of pure saline at 2–4 mL/s.
For assessment of the access route, a non-ECG-gated high-pitch scan of the thorax, abdomen, and pelvis was also performed immediately after the early-phase cardiac scan.
A late-phase scan was added 6 min after the injection of iodine contrast media using a prospective ECG-gating technique.11 CT was performed with a slice thickness of 0.5 mm and tube voltage of 80–120 kV (same voltage as the non-contrast scan) for 320-row multidetector CT or 0.625 mm and 70 kV for 256-slice CT. The tube current at scanning was decided based on an automatic volume exposure control system.
Analysis of CT
Coronary arteries on the CT scans were divided into 15 segments based on the recommendations of the American Heart Association.12 All coronary artery segments with a diameter ≥1.5 mm were analyzed. The significance and position of the stenotic lesion in each coronary artery was evaluated by 2 experienced board-certified cardiologists (M.T. [Observer 1], with 4 years’ experience in cardiac CT, and H.T. [Observer 2], with 14 years’ experience in cardiac CT) using a commercially available workstation (Ziostation 2, Ziosoft Inc., Tokyo, Japan). Disagreement between observers was settled by a consensus reading. Following the latest guideline, obstructive CAD was defined as stenosis ≥70% in ≥1 major epicardial coronary arteries except for the left main coronary arteries, or ≥50% in the left main coronary arteries.13 The Agatston calcium score of the coronary arteries and aortic valve in each case was measured by Observer 1 using the same software.
The ECV of the LVM was measured with the same software using the following equation: ECV = (∆HUm / ∆HUb) / (1 − Hct), where ∆HUm is the change in myocardial CT attenuation in Hounsfield units (HU), ∆HUb is the change in CT attenuation of the blood, and Hct is the hematocrit level11 (Figure 2). Using this software, we performed automatic 3D non-rigid registration of the myocardium between the non-contrast and late-phase CT images to generate a subtraction image. The change in CT attenuation (∆HU) was obtained from the subtraction image. The software produces a polar map showing both the 16 American Heart Association myocardial segments with the mean ECV value for each segment and the mean ECV value for the entire LVM (Figure 2A). ECV was measured by Observer 1, and the ECV values obtained were used for the subsequent analysis. Additionally, ECV was also measured by Observer 2, and interobserver consistency was evaluated. The effective dose for late-phase cardiac scanning was calculated from the dose-length product in a dose report (conversion factor 0.014).14

Echocardiographic Measurements
All patients underwent comprehensive echocardiography before TAVR. TTE was performed using a standard ultrasound machine (Vivid E9, GE Healthcare, or EPIQ7, Philips, Amsterdam, The Netherlands). Standard measurements of cardiac size, function, and severity of aortic valve stenosis were performed in accordance with the American Society of Echocardiography and European Association of Echocardiography guidelines.15 Aortic valve area (AVA) was calculated using the continuity equation and indexed for body surface area.16 LV end-diastolic and end-systolic volumes and systolic ejection fraction (EF) were measured using the modified Simpson method. Left atrial volume was assessed using the biplane area-length method from the apical approach according to a standardized process and indexed for body surface area.17
Outcomes
The primary outcome was a composite of all-cause death and hospitalization for HF after TAVR. Follow-up information was obtained from patient medical records at the institution.
Statistical Analysis
Continuous variables are expressed as mean±SD and categorical variables as counts and percentages. Continuous variables were compared using Student’s t-test or the Wilcoxon signed-rank test, and categorical variables were compared using Fisher’s exact test. Receiver operating characteristic (ROC) curve analysis was performed to assess the diagnostic performance of ECV for predicting prognosis. The best cutoff value chosen using ROC curve analysis was based on the Youden index.
For the time-to-event analyses, the Kaplan-Meier method was used and the log-rank test was applied for between-group comparisons. Hazard ratios (HRs) are expressed as mean±95% confidence intervals (CIs). A Cox proportional hazards model was also performed to investigate the association between the time to event and predictor variables.
P values <0.05 were considered statistically significant. All statistical analyses were performed using JMP software, version 15.0.0 (SAS Institute Inc., Cary, NC, USA).
Results
Characteristics of the Participants
During the follow-up period (373, 181–499 days), 15 patients (12%) had composite outcomes: 11 patients were admitted for congestive HF; 2 cardiovascular deaths: acute HF at 427 days after TAVR and acute aortic dissection at 46 days after TAVR; 2 non-cardiovascular deaths: gastric cancer at 316 days after TAVR and unknown cause at 33 days after TAVR. There were no early deaths within 30 days after TAVR. Table 1 shows the baseline characteristics overall and compares those with and without composite outcomes. AF and a history of congestive HF were more common in patients with composite outcomes. Moreover, the LA volume index and ECV were significantly higher in patients with composite outcomes than in patients without composite outcomes.
Table 1.
Comparison of the Baseline Characteristics of Patients With and Without Composite Outcomes
| Characteristics |
All
(n=127) |
Events+
(n=15) |
Events−
(n=112) |
P value |
| Age, years |
84±5 |
84±6 |
84±5 |
0.67 |
| Male, n (%) |
50 (39%) |
6 (40%) |
44 (39%) |
1.00 |
| Body mass index, kg/m2 |
23.1±4.1 |
22.0±4.3 |
23.2±4.1 |
0.44 |
| Creatinine, mg/dL |
1.14±1.00 |
1.14±0.40 |
1.15±1.05 |
0.18 |
| Hematocrit, % |
36.7±4.9 |
35.6±6.5 |
36.9±4.7 |
0.60 |
| Follow-up period, days |
353±202 |
147±161 |
380±192 |
<0.001 |
| Medical history |
| Hypertension, n (%) |
90 (71%) |
11 (73%) |
79 (71%) |
1.00 |
| Diabetes mellitus, n (%) |
27 (22%) |
4 (27%) |
23 (21%) |
0.74 |
| Dyslipidemia, n (%) |
67 (53%) |
8 (53%) |
59 (53%) |
1.00 |
| Atrial fibrillation, n (%) |
30 (24%) |
10 (67%) |
20 (18%) |
<0.001 |
| Dialysis, n (%) |
3 (2%) |
0 (0%) |
3 (3%) |
1.00 |
| Chronic kidney disease, n (%) |
89 (70%) |
12 (80%) |
77 (69%) |
0.55 |
| Previous myocardial infarction, n (%) |
8 (6%) |
0 (0%) |
8 (7%) |
0.59 |
| Previous PCI, n (%) |
10 (8%) |
0 (0%) |
10 (9%) |
0.61 |
| Previous CABG, n (%) |
1 (1%) |
0 (0%) |
1 (1%) |
1.00 |
| Past history of congestive heart failure |
48 (43%) |
11 (73%) |
37 (33%) |
0.004 |
| Echocardiographic measurements |
| LVEF, % |
59.2±10.8 |
57.2±12.5 |
59.4±10.7 |
0.51 |
| Mean aortic valve gradient, mmHg |
49.0±16.3 |
45.5±15.6 |
49.5±16.4 |
0.47 |
| Indexed aortic valve area, cm2/m2 |
0.44±0.11 |
0.44±0.12 |
0.45±0.11 |
0.91 |
| LV end-diastolic volume, mL |
92.8±37.2 |
88.7±41.1 |
93.3±37.0 |
0.42 |
| LV end-systolic volume, mL |
39.9±26.7 |
39.5±25.1 |
39.9±27.1 |
0.79 |
| LV end-diastolic diameter, mm |
43.0±7.3 |
44.6±6.3 |
42.8±7.4 |
0.22 |
| LV end-systolic diameter, mm |
29.6±6.9 |
31.0±6.0 |
29.4±7.0 |
0.14 |
| LA volume index, mL/m2 |
53.4±32.7 |
62.1±24.0 |
52.3±33.7 |
0.04 |
| Mitral E, cm/s |
84.4±30.6 |
94.1±36.2 |
83.1±29.8 |
0.29 |
| E/A ratio |
0.76±0.42 |
0.87±0.75 |
0.75±0.41 |
0.29 |
| E/e′ ratio |
18.9±9.7 |
19.9±6.3 |
18.7±10.2 |
0.20 |
| Pulmonary artery systolic pressure, mmHg |
31.2±14.2 |
33.7±19.2 |
30.9±13.5 |
0.93 |
| Low-flow, low gradient subtype, n (%) |
6 (5%) |
1 (7%) |
5 (4%) |
0.54 |
| Bicuspid aortic valve, n (%) |
2 (2%) |
1 (7%) |
1 (1%) |
0.22 |
| CT measurements |
| LV-ECV, % |
31.3±4.2 |
34.3±5.2 |
30.9±4.0 |
0.008 |
| CAD |
61 (48%) |
7 (47%) |
54 (48%) |
1.00 |
| CACS |
1,468±1,587 |
1,720±2,000 |
1,434±1,538 |
0.68 |
| AVCS |
3,071±2,655 |
2,683±1,308 |
3,122±2,798 |
0.73 |
A, late atrial diastolic transmitral flow velocity; AVCS, aortic valve calcium score; CABG, coronary artery bypass grafting; CACS, coronary artery calcium score; CAD, coronary artery disease; CT, computed tomography; E, early diastolic transmitral flow velocity; e′, early diastolic mitral annular velocity; ECV, extracellular volume fraction; EF, ejection fraction; LA, left atrium; LV, left ventricle; PCI, percutaneous coronary intervention.
Predictors of Composite Outcomes
ROC analysis showed that the best cutoff value for ECV on CT for predicting composite outcomes was 32.6% (Figure 3). Use of this cutoff resulted in a sensitivity of 80% and a specificity of 72%, and the area under the curve was 0.71 (P=0.005). The cutoff was used to divide the subjects into 2 groups, and Kaplan-Meier analysis with the log-rank test was performed to compare the prognosis between patients with higher and lower ECV (Figure 4). The higher ECV group had a significantly greater number of composite outcomes than the lower ECV group (P<0.001). LVEF was significantly lower in the higher ECV group than in the lower ECV group. LA volume index, LV end-systolic volume, and LV end-systolic diameter were significantly higher in the higher ECV group than in the lower ECV group (Table 2).
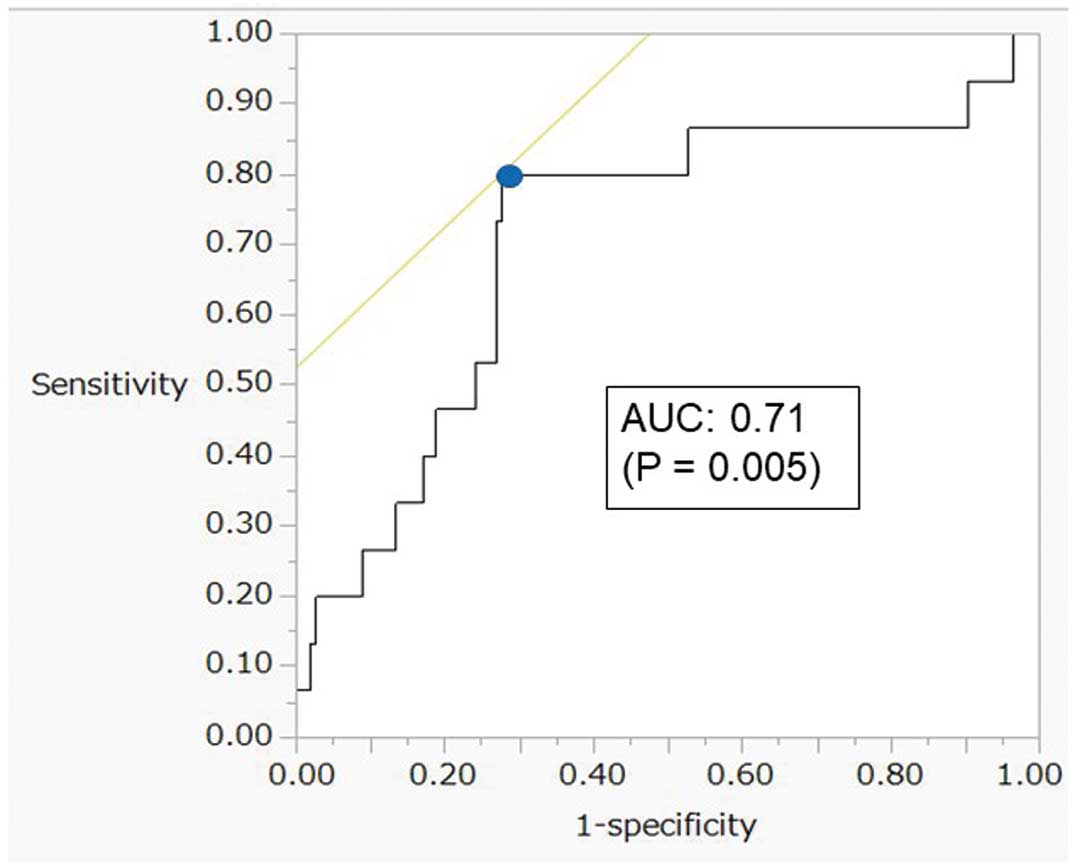
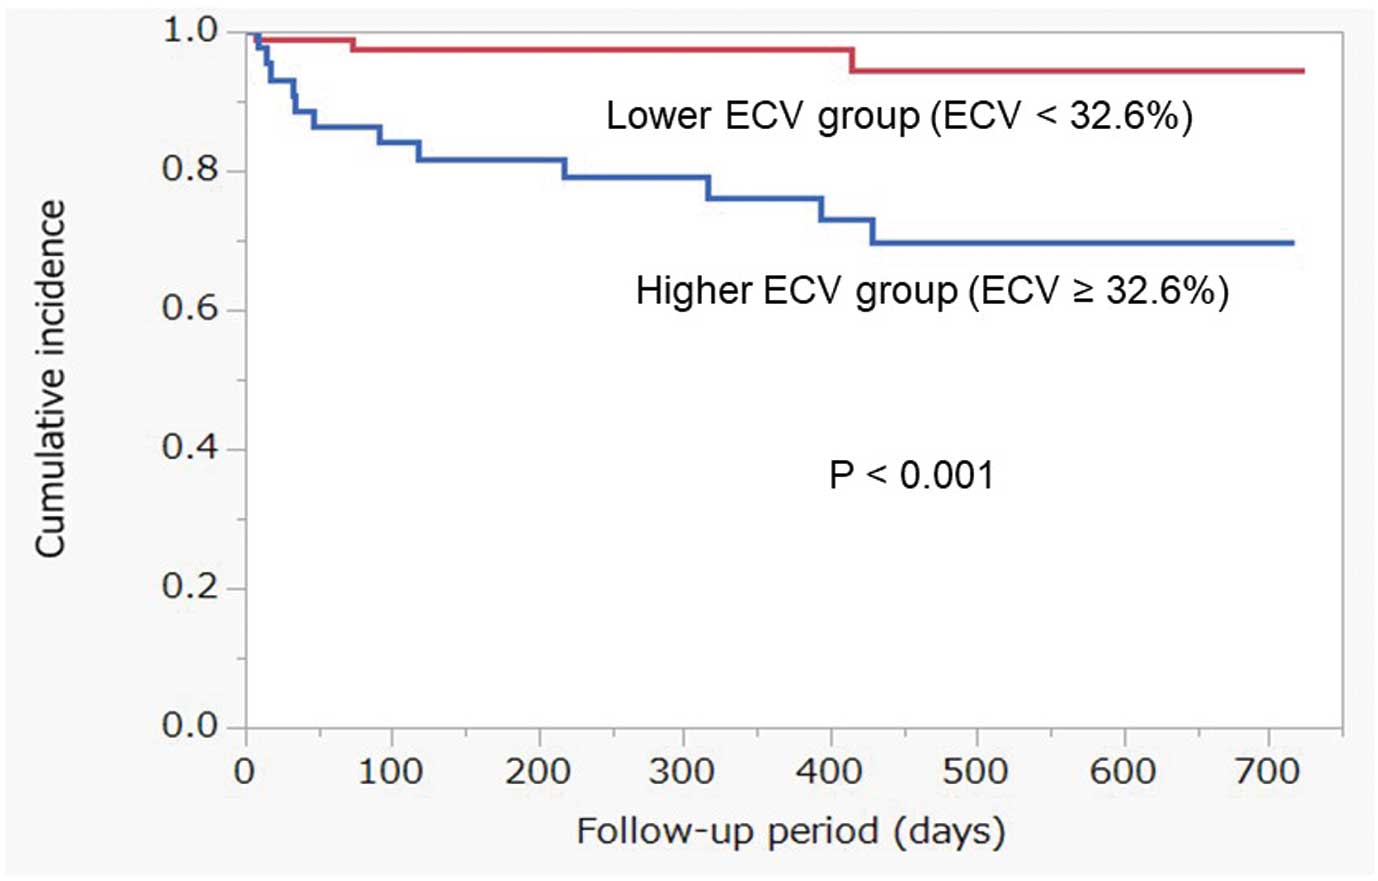
Table 2.
Comparison of the Baseline Characteristics of Patients With and Without ECV ≥32.6%
| Characteristics |
ECV <32.6%
(n=83) |
ECV ≥32.6%
(n=44) |
P value |
| Age, years |
84±4 |
85±7 |
0.17 |
| Male, n (%) |
30 (36%) |
20 (45%) |
0.34 |
| Body mass index, kg/m2 |
23.4±3.8 |
22.4±4.5 |
0.07 |
| Creatinine, mg/dL |
1.16±1.11 |
1.12±0.74 |
0.62 |
| Follow-up period, days |
335±183 |
386±233 |
0.19 |
| Medical history |
| Hypertension, n (%) |
61 (74%) |
29 (66%) |
0.41 |
| Diabetes Mellitus, n (%) |
14 (17%) |
13 (30%) |
0.12 |
| Dyslipidemia, n (%) |
47 (57%) |
20 (45%) |
0.26 |
| Atrial fibrillation, n (%) |
16 (19%) |
14 (32%) |
0.13 |
| Dialysis, n (%) |
2 (2%) |
1 (2%) |
1.00 |
| Chronic kidney disease, n (%) |
16 (19%) |
14 (32%) |
0.13 |
| Previous myocardial infarction, n (%) |
3 (4%) |
5 (11%) |
0.12 |
| Previous PCI, n (%) |
5 (6%) |
5 (11%) |
0.31 |
| Previous CABG, n (%) |
1 (1%) |
0 (0%) |
1.00 |
| Past history of congestive heart failure |
24 (29%) |
24 (55%) |
0.007 |
| Echocardiographic measurements |
| LVEF, % |
61.2±9.1 |
55.3±12.8 |
0.01 |
| Mean aortic valve gradient, mmHg |
47.9±15.4 |
51.3±18.0 |
0.36 |
| Indexed aortic valve area, cm2/m2 |
0.46±0.11 |
0.42±0.12 |
0.07 |
| LV end-diastolic volume, mL |
87.9±30.6 |
102±46.6 |
0.13 |
| LV end-systolic volume, mL |
35.0±18.2 |
49.0±36.6 |
0.024 |
| LV end-diastolic diameter, mm |
42.0±6.8 |
44.9±7.9 |
0.09 |
| LV end-systolic diameter, mm |
28.4±5.3 |
31.9±8.9 |
0.01 |
| LA volume index, mL/m2 |
48.6±16.7 |
62.5±49.9 |
0.031 |
| Mitral E, cm/s |
81.0±27.2 |
91.2±36.0 |
0.14 |
| E/A ratio |
0.72±0.36 |
0.84±0.52 |
0.29 |
| E/e′ ratio |
17.8±8.6 |
20.9±11.5 |
0.15 |
| Pulmonary artery systolic pressure, mmHg |
29.4±13.0 |
34.7±16.0 |
0.06 |
| Low-flow, low gradient subtype, n (%) |
2 (2%) |
4 (9%) |
0.18 |
| Bicuspid aortic valve, n (%) |
2 (2%) |
0 (0%) |
0.54 |
| CT measurements |
| LV-ECV (%) |
28.9±2.2 |
35.9±3.2 |
<0.001 |
| CAD |
40 (48%) |
21 (48%) |
1.00 |
| CACS |
1,262±1,276 |
1,865±2,033 |
0.23 |
| AVCS |
2,992±2,951 |
3,219±2,046 |
0.24 |
Abbreviations as in Table 1.
Univariable and multivariable analyses using a Cox proportional hazards model were performed to identify significant predictors of composite outcomes (Table 3). In the univariate analysis, AF (HR, 7.47; 95% CI, 2.55–21.9; P<0.001), past history of congestive HF (HR, 4.76; 95% CI, 1.51–14.94; P=0.004) and ECV ≥32.6% (HR, 7.25; 95% CI, 2.04–25.76; P<0.001) were significant predictors of composite outcomes after TAVR. In the multivariate analysis, AF (HR, 7.86; 95% CI, 2.57–24.03; P<0.001), past history of congestive HF (HR, 4.91; 95% CI, 1.49–16.20; P=0.009) and ECV ≥32.6% (HR, 6.96; 95% CI, 1.92–25.12; P=0.003) were independent predictors of composite outcomes after TAVR. The correlation coefficient between the 2 observers’ ECV values was 0.84. The effective radiation dose of the late-phase cardiac scan was 2.3±0.6 mSv.
Table 3.
Univariate and Multivariate Analyses Using Cox Proportional Hazard Model of Factors Predictive of Composite Outcomes
| |
Univariate |
Multivariate |
| HR (95% CI) |
P value |
HR (95% CI) |
P value |
| Age |
0.99 (0.91–1.10) |
0.85 |
|
|
| Male |
1.05 (0.37–3.00) |
0.92 |
|
|
| Body mass index |
0.93 (0.81–1.06) |
0.29 |
|
|
| Creatinine |
1.07 (0.48–1.54) |
0.30 |
|
|
| Hematocrit |
0.96 (0.87–1.07) |
0.44 |
|
|
| Hypertension |
1.13 (0.36–3.56) |
0.83 |
|
|
| Diabetes mellitus |
1.37 (0.44–4.30) |
0.60 |
|
|
| Dyslipidemia |
1.03 (0.37–2.85) |
0.95 |
|
|
| Atrial fibrillation |
7.47 (2.55–21.9) |
<0.001 |
7.86 (2.57–24.03) |
<0.001 |
| Chronic kidney disease |
1.69 (0.48–6.00) |
0.42 |
|
|
| Previous myocardial infarction |
1.84 (0.60–4.89) |
0.15 |
|
|
| Previous congestive heart failure |
4.76 (1.51–14.94) |
0.004 |
4.91 (1.49–16.20) |
0.009 |
| LVEF |
0.98 (0.94–1.03) |
0.39 |
|
|
| Mean aortic valve gradient |
0.96 (0.94–1.02) |
0.30 |
|
|
| Indexed aortic valve area |
0.46 (0.008–46.28) |
0.73 |
|
|
| LV end-diastolic volume |
1.00 (0.98–1.01) |
0.64 |
|
|
| LV end-systolic volume |
1.00 (0.98–1.01) |
0.97 |
|
|
| LV end-diastolic diameter |
1.03 (0.96–1.09) |
0.40 |
|
|
| LV end-systolic diameter |
1.02 (0.96–1.07) |
0.47 |
|
|
| LA volume index |
1.00 (0.99–1.01) |
0.47 |
|
|
| Mitral E |
1.00 (0.99–1.03) |
0.26 |
|
|
| E/A ratio |
1.63 (0.31–5.03) |
0.51 |
|
|
| E/e′ ratio |
1.00 (0.95–1.05) |
0.80 |
|
|
| Pulmonary artery systolic pressure |
1.01 (0.97–1.04) |
0.70 |
|
|
| Low-flow, low gradient subtype |
1.32 (0.17–10.06) |
0.8 |
|
|
| Bicuspid aortic valve |
3.42 (0.45–26.21) |
0.32 |
|
|
| LV-ECV ≥32.6% |
7.25 (2.04–25.76) |
<0.001 |
6.96 (1.92–25.21) |
0.003 |
| CAD |
1.04 (0.38–2.87) |
0.94 |
|
|
CI, confidence interval; HR, hazard ratio. Other abbreviations as in Table 1.
Discussion
In this study we examined the utility of ECV analysis on preoperative CT for predicting prognosis in TAVR candidates with severe AS. We found that higher ECV on CT was associated with the composite outcomes after TAVR and was an independent predictor of patient prognosis.
These results are consistent with previous studies that showed that ECV analysis on CMR and CT are associated with clinical outcomes, including HF and death, in patients with AS who underwent TAVR or SAVR.18–20 Other similar reports revealed the utility of ECV analysis on CT for predicting patient prognosis after TAVR.18,19 However, few studies have focused exclusively on TAVR candidates without including SAVR cases. Moreover, the other reports measured ECV in the interventricular septum only, whereas we calculated the average ECV of the entire LV using new image analysis software, which more accurately reflects LV myocardial impairment in TAVR candidates only, providing a unique aspect distinct from that of the previous literature. Furthermore, another notable feature is that we used the newly introduced 320-row or 256-row multidetector CT scanner capable of full coverage of the heart, which has significant advantages such as not only reducing radiation exposure in late-phase scans but also enabling whole-body imaging in addition to the heart for TAVR candidates with minimal contrast agent and radiation dose.
TAVR is as an effective treatment for elderly patients with both severe AS and at high risk for SAVR. Nevertheless, a substantial proportion of patients who undergo TAVR are readmitted for HF.21,22 Our findings suggest that ECV analysis on CT may be useful for assessing the risk of composite outcomes and determining the degree to which drug dosages should be increased to reduce the risk of HF after TAVR.
Assessment of Myocardial Fibrosis in AS
LV hypertrophy regresses by 20–30% in the year following SAVR due to reverse myocardial remodeling caused by the decreased afterload.7 Nearly two-thirds of patients with reduced LVEF experience reverse remodeling after either SAVR or TAVR, and early LVEF recovery is associated with improved prognosis.23,24 However, myocardial normalization is not always achieved even after surgical treatment for severe AS. Given that myocardial fibrosis contributes to LV dysfunction, leading to the development of HF, histological and imaging studies have examined the association between cardiac decompensation and myocardial structural remodeling. Our study revealed that the patients with high ECV had reduced LVEF and dilatation of both the LV and LA, and that these cardiac morphological changes might be due to advanced myocardial fibrosis (Table 2).
Myocardial fibrosis typically presents as 1 of 2 patterns: diffuse fibrosis or myocardial replacement fibrosis. Diffuse fibrosis follows an increase in expanded collagen fibers and hypertrophy of cardiomyocytes, and has been demonstrated to regress following TAVR or SAVR because of reversibility.25 In contrast, myocardial replacement fibrosis, which represents collagen deposition that occurs following myocyte apoptosis or necrosis, is considered an advanced-stage form of diffuse fibrosis and is irreversible. Severe histological myocardial replacement fibrosis at the time of SAVR is associated with increased risk of cardiovascular death,26 and both myocardial replacement fibrosis and diffuse fibrosis are univariate predictors of ventricular decompensation.3 In contrast to LGE, which only detects myocardial replacement fibrosis, ECV analysis on CMR is useful for quantifying both patterns. Higher ECV has been observed in patients with myocardial replacement fibrosis compared with those with diffuse fibrosis alone. Moreover, ECV analysis on CMR of patients with severe AS has been shown to be an indicator of LV decompensation and is associated with LV functional improvement and prognosis.7,27
Clinical Implications of ECV Analysis on CT
ECV analysis on CT has been reported to be strongly correlated with ECV analysis on CMR.10 Previous studies that performed ECV analysis on CT in TAVR candidates18,28 have reported mean ECV values from 28% to 32%, which are consistent with our results. ECV on preoperative CT for TAVR is quick to perform because ECV can be assessed by simply adding a late-phase scan to the preoperative CT protocol of TAVR. CMR has several limitations, including contraindication in patients with severe renal dysfunction or implanted cardiac devices.29 In addition, image quality often deteriorates due to arrhythmia or difficulty with breath holding, especially in older patients with cardiovascular disease. In contrast, cardiac CT, including a late-phase scan, is easy to perform in TAVR candidates, with preoperative CT being a necessity for such candidates, and the scan time is relatively short compared with that for CMR. Further, although ECV analysis on CT requires an additional radiation dose, new iterative reconstruction techniques and the wide coverage of multidetector CTs have made it possible to obtain high-quality late-phase images with low doses.30 In fact, the additional effective radiation dose for the late-phase cardiac scan was almost 2 mSv, less than that for a normal chest CT scan.31 Moreover, because TAVR candidates are typically older, adverse effects related to additional radiation doses are relatively infrequent compared with those observed in younger patients. Such improvements in the performance of additional late enhancement images of the LVM have enabled the assessment of cardiomyopathy, particularly cardiac amyloidosis. Therefore, use of CT for evaluating late enhancement of the LVM and ECV is recommended as a substitute for CMR in the latest guidelines for cardiac amyloidosis by the Japanese Cardiovascular Society.32
In addition to ECV, we showed that AF and the mean aortic valve gradient were associated with composite outcomes after TAVR. These results are consistent with several previous studies. Pre-existing AF has been shown to increase the risk of death and hospitalization due to HF after TAVR.33,34
Prognostic Implications of Myocardial Fibrosis in AS
Current guidelines recommend SAVR or TAVR mainly for patients with symptoms or LV systolic dysfunction in severe AS.35–37 However, in daily clinical practice we often experience difficulty in identifying symptoms caused by severe AS in elderly patients with comorbidities, and myocardial histological degeneration can be overlooked by evaluation of LV systolic dysfunction only. Several studies have suggested that myocardial fibrosis detected using CMR assessments, ECV and LGE develops before symptoms appear in patients with AS.38,39 Such findings suggest that the intervention is performed too late for some patients with preserved LV systolic function, and that preoperative myocardial damage contributes to HF after TAVR. Additionally, a history of congestive HF was a risk factor for composite outcomes after TAVR in our study; early intervention for severe AS is expected. Our study also provides evidence that ECV analysis on CT yields important information, including that for pre- and postoperative care of AS patients undergoing TAVR. However, additional evidence is needed to clarify the usefulness of imaging fibrosis in asymptomatic patients with severe AS. The ongoing Early Valve Replacement Guided by Biomarkers of LV Decompensation in Asymptomatic Patients with Severe AS (EVOLVED-AS) trial (NCT03094143) aims to compare the performance of early TAVR or SVAR to the standard care in asymptomatic patients with severe AS and mid-wall LGE on cardiac CMR,40 and the results are expected soon.
Study Limitations
Several limitations warrant mention. First, the study was conducted under a retrospective design at a single center, and the number of patients was small. Therefore, a large-scale prospective study is necessary to confirm the utility of preoperative ECV analysis on CT for predicting composite outcomes after TAVR. Second, because ECV analysis was performed on single-energy images, subtraction of the late-phase and non-contrast image data sets were necessary to evaluate ECV on CT. Thus, gaps between the images taken at the 2 phases might have led to an under- or overestimation of ECV on single-energy images compared with analysis of dual-energy images using the latest CT scanners (without gaps).
Conclusions
Increasing ECV on CT was associated with composite outcomes in TAVR candidates. Our analysis suggested that preoperative ECV analysis on CT can help predict prognosis after TAVR in patients with severe AS.
Acknowledgment
This work was partially supported by the JSPS KAKENHI Grant Number JP23K11891.
Disclosure
Y.K. is a member of Circulation Journal’s Editorial Team.
IRB Information
This study was approved by the Ethics Committee of Chiba University Graduate School of Medicine (no. 3822).
References
- 1.
Carabello BA, Paulus WJ. Aortic stenosis. Lancet 2009; 373: 956–966.
- 2.
Baumgartner H, Falk V, Bax JJ, De Bonis M, Hamm C, Holm PJ, et al; ESC Scientific Document Group. 2017 ESC/EACTS guidelines for the management of valvular heart disease. Eur Heart J 2017; 38: 2739–2791.
- 3.
Chin CWL, Everett RJ, Kwiecinski J, Vesey AT, Yeung E, Esson G, et al. Myocardial fibrosis and cardiac decompensation in aortic stenosis. JACC Cardiovasc Imaging 2017; 10: 1320–1333.
- 4.
Cummings KW, Bhalla S, Javidan-Nejad C, Bierhals AJ, Gutierrez FR, Woodard PK. A pattern-based approach to assessment of delayed enhancement in nonischemic cardiomyopathy at MR imaging. RadioGraphics 2009; 29: 89–103.
- 5.
Messroghli DR, Moon JC, Ferreira VM, Grosse-Wortmann L, He T, Kellman P, et al. Clinical recommendations for cardiovascular magnetic resonance mapping of T1, T2, T2 and extracellular volume: A consensus statement by the Society for Cardiovascular Magnetic Resonance (SCMR) endorsed by the European Association for Cardiovascular Imaging. J Cardiovasc Magn Reson 2017; 19: 1–24.
- 6.
Nakamori S, Dohi K. Myocardial tissue imaging with cardiovascular magnetic resonance. J Cardiol 2022; 80: 377–385.
- 7.
Treibel TA, Kozor R, Schofield R, Benedetti G, Fontatna M, Bhuva AN, et al. Reverse myocardial remodeling following valve replacement in patients with aortic stenosis. J Am Coll Cardiol 2018; 71: 860–871.
- 8.
Sakai H, Yokoi K, Kaneta K, Yoshioka G, Sakamoto Y, Node K. Efficacy of cardiac computed tomography for diagnostic and therapeutic evaluation of bioprosthetic valve thrombosis. Circ J 2022; 86: 1023.
- 9.
Takaoka H, Funabashi N, Uehara M, Fujimoto Y, Kobayashi Y. Diagnostic accuracy of coronary 320 slice CT angiography using retrospective electrocardiogram gated acquisition compared with virtual prospective electrocardiogram gated acquisition with and without padding. Int J Cardiol 2013; 168: 2811–2815.
- 10.
Nacif MS, Kawel N, Lee JJ, Chen X, Yao J, Zavodni A, et al. Interstitial myocardial fibrosis assessed as extracellular volume fraction with low-radiation-dose cardiac CT. Radiology 2012; 264: 876–883.
- 11.
Hamdy A, Kitagawa K, Goto Y, Yamada A, Nakamura S, Takafuji M, et al. Comparison of the different imaging time points in delayed phase cardiac CT for myocardial scar assessment and extracellular volume fraction estimation in patients with old myocardial infarction. Int J Cardiovasc Imaging 2019; 35: 917–926.
- 12.
Austen WG, Edwards JE, Frye RL, Gensini GG, Gott VL, Griffith LS, et al. A reporting system on patients evaluated for coronary artery disease: Report of the Ad Hoc Committee for Grading of Coronary Artery Disease, Council on Cardiovascular Surgery, American Heart Association. Circulation 1975; 51(Suppl): 5–40.
- 13.
Cury RC, Leipsic J, Abbara S, Achenbach S, Berman D, Bittencourt M, et al. CAD-RADSTM 2.0 – 2022 Coronary Artery Disease – Reporting and Data System: An expert consensus document of the Society of Cardiovascular Computed Tomography (SCCT), the American College of Cardiology (ACC), the American College of Radiology (ACR) and the North America Society of Cardiovascular Imaging (NASCI). J Am Coll Radiol 2022; 19: 1185–1212.
- 14.
Halliburton SS, Abbara S, Chen MY, Gentry R, Mahesh M, Raff GL, et al. SCCT guidelines on radiation dose and dose-optimization strategies in cardiovascular CT. J Cardiovasc Comput Tomogr 2011; 5: 198–224.
- 15.
Lang RM, Badano LP, Mor-Avi V, Afilalo J, Armstrong A, Ernande L, et al. Recommendations for cardiac chamber quantification by echocardiography in adults: An update from the American Society of Echocardiography and the European Association of Cardiovascular Imaging. J Am Soc Echocardiogr 2015; 28: 1–39.
- 16.
Baumgartner H, Falk V, Bax JJ, De Bonis M, Hamm C, Holm PJ, et al; ESC Scientific Document Group. ESC/EACTS Guidelines for the management of valvular heart disease. Eur Heart J 2017; 38: 2739–2791.
- 17.
Nistri S, Galderisi M, Ballo P, Olivotto I, D’Andrea A, Pagliani L, et al; Working Group of Echocardiography of the Italian Society of Cardiology. Determinants of echocardiographic left atrial volume: Implications for normalcy. Eur J Echocardiogr 2011; 12: 826–833.
- 18.
Suzuki M, Toba T, Izawa Y, Fujita H, Miwa K, Takahashi Y, et al. Prognostic impact of myocardial extracellular volume fraction assessment using dual-energy computed tomography in patients treated with aortic valve replacement for severe aortic stenosis. J Am Heart Assoc 2021; 10: e20655.
- 19.
Vignale D, Palmisano A, Gnasso C, Margonato D, Romagnolo D, Barbieri S, et al. Extracellular volume fraction (ECV) derived from pre-operative computed tomography predicts prognosis in patients undergoing transcatheter aortic valve implantation (TAVI). Eur Heart J Cardiovasc Imaging 2023; 24: 887–896.
- 20.
Hwang IC, Kim HK, Park JB, Park EA, Lee W, Lee SP, et al. Aortic valve replacement-induced changes in native T1 are related to prognosis in severe aortic stenosis: T1 mapping cardiac magnetic resonance imaging study. Eur Heart J Cardiovasc Imaging 2020; 21: 653–663.
- 21.
Durand E, Doutriaux M, Bettinger N, Tron C, Fauvel C, Bauer F, et al. Incidence, prognostic impact, and predictive factors of readmission for heart failure after transcatheter aortic valve replacement. JACC Cardiovasc Interv 2017; 10: 2426–2436.
- 22.
Auffret V, Bakhti A, Leurent G, Bedossa M, Tomasi J, Belhaj Soulami R, et al. Determinants and impact of heart failure readmission following transcatheter aortic valve replacement. Circ Cardiovasc Interv 2020; 13: e008959.
- 23.
Morris JJ, Schaff HV, Mullany CJ, Rastogi A, McGregor CG, Daly RC, et al. Determinants of survival and recovery of left ventricular function after aortic valve replacement. Ann Thorac Surg 1993; 56: 22–29, discussion 29.
- 24.
Dauerman HL, Reardon MJ, Popma JJ, Little SH, Cavalcante JL, Adams DH, et al. Early recovery of left ventricular systolic function after CoreValve transcatheter aortic valve replacement. Circ Cardiovasc Interv 2016; 9: e003425.
- 25.
Bing R, Cavalcante JL, Everett RJ, Clavel MA, Newby DE, Dweck MR. Imaging and impact of myocardial fibrosis in aortic stenosis. JACC Cardiovasc Imaging 2019; 12: 283–296.
- 26.
Herrmann S, Fries B, Salinger T, Liu D, Hu K, Gensler D, et al. Myocardial fibrosis predicts 10-year survival in patients undergoing aortic valve replacement. Circ Cardiovasc Imaging 2018; 11: e007131.
- 27.
Everett RJ, Treibel TA, Fukui M, Lee H, Rigolli M, Singh A, et al. Extracellular myocardial volume in patients with aortic stenosis. J Am Coll Cardiol 2020; 75: 304–316.
- 28.
Han D, Tamarappoo B, Klein E, Tyler J, Chakravarty T, Otaki Y, et al. Computed tomography angiography-derived extracellular volume fraction predicts early recovery of left ventricular systolic function after transcatheter aortic valve replacement. Eur Heart J Cardiovasc Imaging 2021; 22: 179–185.
- 29.
Grobner T, Prischl FC. Gadolinium and nephrogenic systemic fibrosis. Kidney Int 2007; 72: 260–264.
- 30.
Takaoka H, Uehara M, Saito Y, Ota J, Iida Y, Takahashi M, et al. Improved diagnostic performance of new-generation 320-slice computed tomography with forward-projected model-based iterative reconstruction solution for the assessment of late enhancement in left ventricular myocardium. Intern Med 2020; 59: 2095–2103.
- 31.
Larke FJ, Kruger RL, Cagnon CH, Flynn MJ, McNitt-Gray MM, Wu X, et al. Estimated radiation dose associated with low-dose chest CT of average-size participants in the National Lung Screening Trial. AJR 2011; 197: 1165–1169.
- 32.
Kitaoka H, Izumi C, Izumiya Y, Inomata T, Ueda M, Kubo T, et al. JCS 2020 Guideline on diagnosis and treatment of cardiac amyloidosis. Circ J 2020; 84: 1610–1671.
- 33.
Mentias A, Saad M, Girotra S, Desai M, Elbadawi A, Briasoulis A, et al. Impact of pre-existing and new-onset atrial fibrillation on outcomes after transcatheter aortic valve replacement. JACC Cardiovasc Interv 2019; 12: 2119–2129.
- 34.
Hioki H, Watanabe Y, Kozuma K, Nara Y, Kawashima H, Nagura F, et al. Timing of susceptibility to mortality and heart failure in patients with preexisting atrial fibrillation after transcatheter aortic valve implantation. Am J Cardiol 2017; 120: 1618–1625.
- 35.
Nishimura RA, Otto CM, Bonow RO, Carabello BA, Erwin JP, Guyton RA, et al. 2014 AHA/ACC guideline for the management of patients with valvular heart disease: A report of the American College of Cardiology/American Heart Association Task Force on Practice Guidelines. J Am Coll Cardiol 2014; 63: e57–e185.
- 36.
Baumgartner H, Falk V, Bax JJ, Bonis MD, Hamm C, Holm PJ, et al. 2017 ESC/EACTS guidelines for the management of valvular heart disease. Eur Heart J 2017; 38: 2739–2791.
- 37.
Izumi C, Eishi K, Ashihara K, Arita T, Otsuji Y, Kunihara T, et al. JCS/JSCS/JATS/JSVS 2020 guidelines on the management of valvular heart disease. Circ J 2020; 84: 2037–2119.
- 38.
Everett RJ, Tastet L, Clavel MA, Chin CWL, Capoulade R, Vassiliou VS, et al. Progression of hypertrophy and myocardial fibrosis in aortic stenosis: A multicenter cardiac magnetic resonance study. Circ Cardiovasc Imaging 2018; 11: e007451.
- 39.
Kwak S, Everett RJ, Treibel TA, Yang S, Hwang D, Ko T, et al. Markers of myocardial damage predict mortality in patients with aortic stenosis. J Am Coll Cardiol 2021; 78: 545–558.
- 40.
Bing R, Everett RJ, Tuck C, Semple S, Lewis S, Harkess R, et al. Rationale and design of the randomized, controlled Early Valve Replacement Guided by Biomarkers of LV Decompensation in Asymptomatic Patients with Severe Aortic Stenosis (EVOLVED) trial. Am Heart J 2019; 212: 91–100.

