Abstract
Background: Fractional flow reserve-computed tomography (FFRCT) has not been validated in patients with severe aortic stenosis (AS) undergoing transcatheter aortic valve replacement (TAVR) for coronary artery disease due to theoretical difficulties in using nitroglycerin for such patients.
Methods and Results: In this single-center study, we prospectively enrolled 21 patients (34 vessels) and performed pre-TAVR FFRCT
without nitroglycerin, pre-TAVR invasive instantaneous wave-free ratio (iFR) measurements, and post-TAVR FFR measurements using a pressure wire. The diagnostic accuracy, sensitivity, specificity, positive predictive value, and negative predictive value of pre-TAVR FFRCT
≤0.80 to predict post-TAVR invasive FFR ≤0.80 were 82%, 83%, 82%, 71%, and 90%, respectively. A receiver operating characteristic analysis demonstrated an optimal cutoff of 0.78 for pre-TAVR FFRCT
to indicate post-TAVR FFR ≤0.80, with an area under the curve (AUC) of 0.84, and the counterpart cutoff of pre-TAVR iFR was 0.89 with an AUC of 0.86.
Conclusions: FFRCT
without nitroglycerin could be a useful non-invasive imaging modality for assessing the severity of coronary artery lesions in patients with severe AS.
Transcatheter aortic valve replacement (TAVR) is a promising alternative to surgical treatment in patients with severe symptomatic aortic stenosis (AS).1 Patients with severe AS who are candidates for TAVR reportedly have a high probability (30–70%) of coronary artery disease (CAD) with stenotic lesions as confirmed by computed tomography (CT) or coronary angiography (CAG).2–5 Concomitant CAD has been reported to exacerbate the mid-term prognosis and is considered a prognostic factor for acute coronary syndrome after TAVR.6,7 Given the expansion of indication of TAVR to low-risk younger patients, development and validation of a reliable diagnostic method for ischemia in patients with severe AS is an important issue that might affect the long-term postoperative prognosis.
Fractional flow reserve (FFR) is the gold standard for physiological evaluation of coronary artery stenosis. However, quantitative evaluation using FFR in patients with severe AS is considered an arduous task due to the theoretical difficulty of using vasodilators such as nitroglycerin. FFRCT
(HeartFlow Inc., Mountainview, CA, USA) is a non-invasive diagnostic technique used to calculate FFR from coronary CT angiography (cCTA) data for each participant at rest and at virtual maximum hyperemia using numerical fluid analysis to evaluate functional hemodynamics in CAD.8 Prospective studies suggest that FFRCT
predicts the degree of functional hemodynamic compromise of coronary lesions, and FFR can be measured by an invasive method using a pressure-sensing guidewire.8–10 However, data regarding the diagnostic accuracy of FFRCT
without nitroglycerin in patients with severe AS undergoing TAVR are currently insufficient.
Therefore, the objective of this study was to assess the predictive capabilities of pre-TAVR FFRCT
without nitroglycerin in severe AS patients, specifically in predicting post-TAVR invasive FFR ≤0.80, using post-TAVR FFR as a reference standard for ischemia.
Methods
Ethical Considerations
All the procedures performed in this study were in accordance with the tenets of the 1975 Declaration of Helsinki. The study was approved by the Institutional Ethics Committee at Kobe University Graduate School of Medicine. Written informed consent was given by all patients prior to commencement of the study.
Study Population and Design
This single-center prospective study was designed to evaluate the diagnostic accuracy of pre-TAVR FFRCT, using post-TAVR FFR as the reference standard for ischemia.
Adult patients with severe AS with moderate or greater (30–90%) stenotic lesions on cCTA and CAG prior to TAVR and those who underwent successful TAVR were included in the study. Patients with hemodynamic instability, major procedural complications, prior left main trunk stenting, prior stenting in ≥1 coronary artery, or prior coronary artery bypass grafting were excluded. Details of the inclusion and exclusion criteria are provided in Supplementary File.
The timeline of the present study is shown in Supplementary Figure 1. At Kobe University Hospital, pre-TAVR CAG and cCTA are routinely performed before TAVR without administration of nitroglycerin. The pre-TAVR instantaneous wave-free ratio (iFR) is also routinely measured for moderate or greater (30–90%) stenotic lesions, unless judged to be difficult for passage of the wire. Patients who met the inclusion criteria and underwent successful TAVR were enrolled in the study. After TAVR, we conducted post-TAVR CAG with iFR and FFR measurements, and post-TAVR cCTA with nitroglycerin administration (Supplementary Figure 1). Anonymized cCTA images provided by HeartFlow Inc. were used to calculate FFRCT.
Endpoints
The primary endpoint was the diagnostic performance of pre-TAVR FFRCT
without nitroglycerin, using post-TAVR invasive FFR as the reference standard. The secondary endpoints were the diagnostic performance of % diameter stenosis (%DS) on pre-TAVR CAG, pre-TAVR iFR, post-TAVR iFR, and post-TAVR FFRCT.
Image Acquisition and Analysis of cCTA
cCTA imaging was performed before and after TAVR (Supplementary Figure 1; details described in a previous study11). Briefly, all images were acquired using a 3rd-generation dual-source CT scanner (SOMATOM Force; Siemens Healthcare, Forchheim, Germany). Sublingual nitrates and intravenous β-blockers were not administered before pre-TAVR cCTA, but were administered before post-TAVR cCTA at a target heart rate of <60 beats/min, as required. An initial 120-kV non-contrast CT scan was performed for calcium scoring. Standard ECG-triggered CT angiography was then performed using 12 mL of media contrast, and delayed enhancement images were acquired after 5 min. FFRCT
was independently calculated by HeartFlow Inc. in a blinded manner based on patient characteristics, CAG findings, and physiological measurements such as FFR and iFR.
Invasive CAG and Measurement of Physiological Indices Using a Pressure Wire
CAG was performed before and after TAVR in accordance with standard clinical practice. Quantitative CAG (QCA) was conducted to measure %DS using the QAngio XA software (Medis Medical Imaging Systems, Leiden, The Netherlands).
Physiological indices such as FFR and iFR were obtained using a coronary pressure guidewire (Philips Volcano; San Diego, CA, USA). The pre- and post- TAVR iFR were measured without nitroglycerin infusion. However, post-TAVR FFR was measured with nitroglycerin administration into a coronary artery and adenosine infusion into a peripheral vein to achieve hyperemia.12 Pre-TAVR FFR was not measured because of the potential concern for use of nitroglycerine in patients with severe AS. However, pre-TAVR iFR was routinely conducted for moderate or greater (30–90%) stenotic lesions unless they were judged to be difficult for wire passage. In all cases, vessel-specific FFR/iFR values were measured at the most distal point using the pressure wire, and the FFRCT
values were also measured at the same anatomic location. The vessel-specific FFR values were referenced to assess the diagnostic ability of other hemodynamic indices. Only when the FFRCT
measurable region was more proximally located were the corresponding FFR values determined from the pullback curve on a per-vessel basis. On a per-patient basis, ischemia was determined using the vessel-specific FFR.
Statistical Analysis
All statistical analyses were performed using R software (R Foundation for Statistical Computing, Vienna, Austria). Continuous variables are presented as mean±standard deviation or median (interquartile range), as appropriate. Categorical variables are expressed as frequencies. Differences between continuous baseline variables were compared using Student’s t-test, and differences between categorical variables were analyzed using Fisher’s exact test. Receiver operating curve (ROC) analysis was performed to assess the best cutoff values of each parameter to determine post-TAVR FFR ≤0.80 with maximal accuracy. The optimal cutoff was calculated according to the Youden index. A two-tailed P value <0.05 was defined as statistically significant.
Results
A total of 170 patients underwent TAVR during the study period and of the 66 patients who met the inclusion criteria, 41 were excluded for the following reasons: medical history of coronary artery bypass surgery (n=7), revascularization for eligible coronary stenosis (n=4), and major perioperative complications (n=2). The exclusion criteria are shown in Figure 1. Of the 25 patients (38 vessels) remaining, 4 with 4 vessels unavailable for FFRCT
analysis were excluded, leaving 21 patients with 34 vessels to be finally registered for analysis (Figure 1). The pre-TAVR iFR measurements were not available for 2 of the 34 vessels due to concerns about hemodynamic deterioration while passing a wire through the tortuous vessels prior to TAVR.
Study Population
The baseline patient and lesion characteristics are presented in Table 1. The average age of the study population was 86±4 years, and there were 8 (38%) men. A total of 8 (38%) study participants had diabetes mellitus.
Table 1.
Patient and Lesion Characteristics at Baseline
| |
|
n |
| Patient characteristics |
| Age, years |
86±4 |
21 |
| Sex |
Male 8 (38%), Female 13 (62%) |
21 |
| Height, cm |
151±8.8 |
21 |
| Body weight, kg |
49.3±8.3 |
21 |
| BMI, kg/m2 |
21.6±3.1 |
21 |
| Comorbidity |
| Hypertension |
20 (95.2%) |
21 |
| Dyslipidemia |
12 (57.1%) |
21 |
| Diabetes mellitus |
8 (38.1%) |
21 |
| Chronic kidney disease |
11 (52.4%) |
21 |
| Hemodialysis |
0 (0%) |
21 |
| Peripheral artery disease |
3 (14.3%) |
21 |
| Smoking |
3 (14.3%) |
21 |
| Prior percutaneous intervention |
3 (14.3%) |
21 |
| Ultrasound cardiography |
| LVEF, % |
63±5 |
21 |
| AVA, cm2 |
0.65±0.19 |
21 |
| AVA index, cm2/1.73 m2 |
0.45±0.14 |
21 |
| Peak velocity, m/s |
4.8±0.5 |
21 |
| Mean pressure gradient, mmHg |
65±12 |
21 |
| Lesion characteristics |
| LAD/LCx/RCA |
20 (59%)/9 (26%)/5 (15%) |
34 |
| QCA before TAVR |
| MLD, mm |
1.8±0.6 |
34 |
| %DS, % |
37±14 |
34 |
| Lesion Length, mm |
12±7 |
34 |
| QCA after TAVR |
| MLD, mm |
1.9±0.7 |
29 |
| %DS, % |
33±12 |
29 |
| cCTA before TAVR |
| Agatston score |
1,095±846 |
16 |
%DS, % diameter stenosis; AS, aortic stenosis; AVA, atrioventricular area; BMI, body mass index; BNP, B-type natriuretic hormone; cCTA, coronary computed tomography angiography; LAD, left anterior descending branch; LCx, left circumflex; LVEF, left ventricular ejection fraction; MLD, minimum lumen diameter; QCA, quantitative coronary angiography; RCA, right coronary artery; TAVR, transcatheter aortic valve replacement.
Pre-TAVR transthoracic echocardiography showed a mean peak aortic valve velocity of 4.8±0.5 m/s, a mean pressure gradient of 65±12 mmHg and an estimated aortic valve area of 0.65±0.19 cm2. All patients underwent successful TAVR with SAPIEN 3 (90.5%) and CoreValve Evolut PRO/Evolut R (9.5%). There was a total of 20 (59%) stenoses in the left anterior descending branch (LAD), 9 (26%) in the left circumflex, and 5 (15%) in the right coronary artery. QCA before TAVR showed that the average %DS was 37±14%.
The median time intervals from pre-TAVR cCTA to TAVR and TAVR to post-TAVR CAG were 24 and 11 days, respectively (Supplementary Figure 1). Pre-TAVR cCTA was performed with a mean heart rate of 64±12 beats/min and post-TAVR cCTA with 64±7 beats/min. An representative case is shown in Figure 2.
Primary Endpoint
Figure 3A shows the distribution of the pre-TAVR FFRCT
and post-TAVR FFR values of the analyzed lesions. In the context of the primary endpoint, the diagnostic accuracy, sensitivity, specificity, positive predictive value (PPV), and negative predictive value (NPV) of pre-TAVR FFRCT
≤0.80 to predict post-TAVR FFR ≤0.80 were 82%, 83%, 82%, 71%, and 90%, respectively, on a per-vessel basis, and 91%, 91%, 90%, 91%, and 90%, respectively, on a per-patient basis (Table 2). The Pearson correlation coefficient between pre-TAVR FFRCT
and post-TAVR FFR was 0.45 (95% confidence interval (CI): 0.13, 0.68; P<0.01). In the Bland-Altman analysis, the mean difference value of pre-TAVR FFRCT
was 0.02 (limits of agreement: −0.14, 0.19; 95% CI; Figure 3B). According to the ROC analysis, the best cutoff value of pre-TAVR FFRCT
to indicate post-TAVR FFR ≤0.80 was 0.78 with an area under the curve (AUC) of 0.84 (95% CI: 0.68, 0.99; Figure 4).
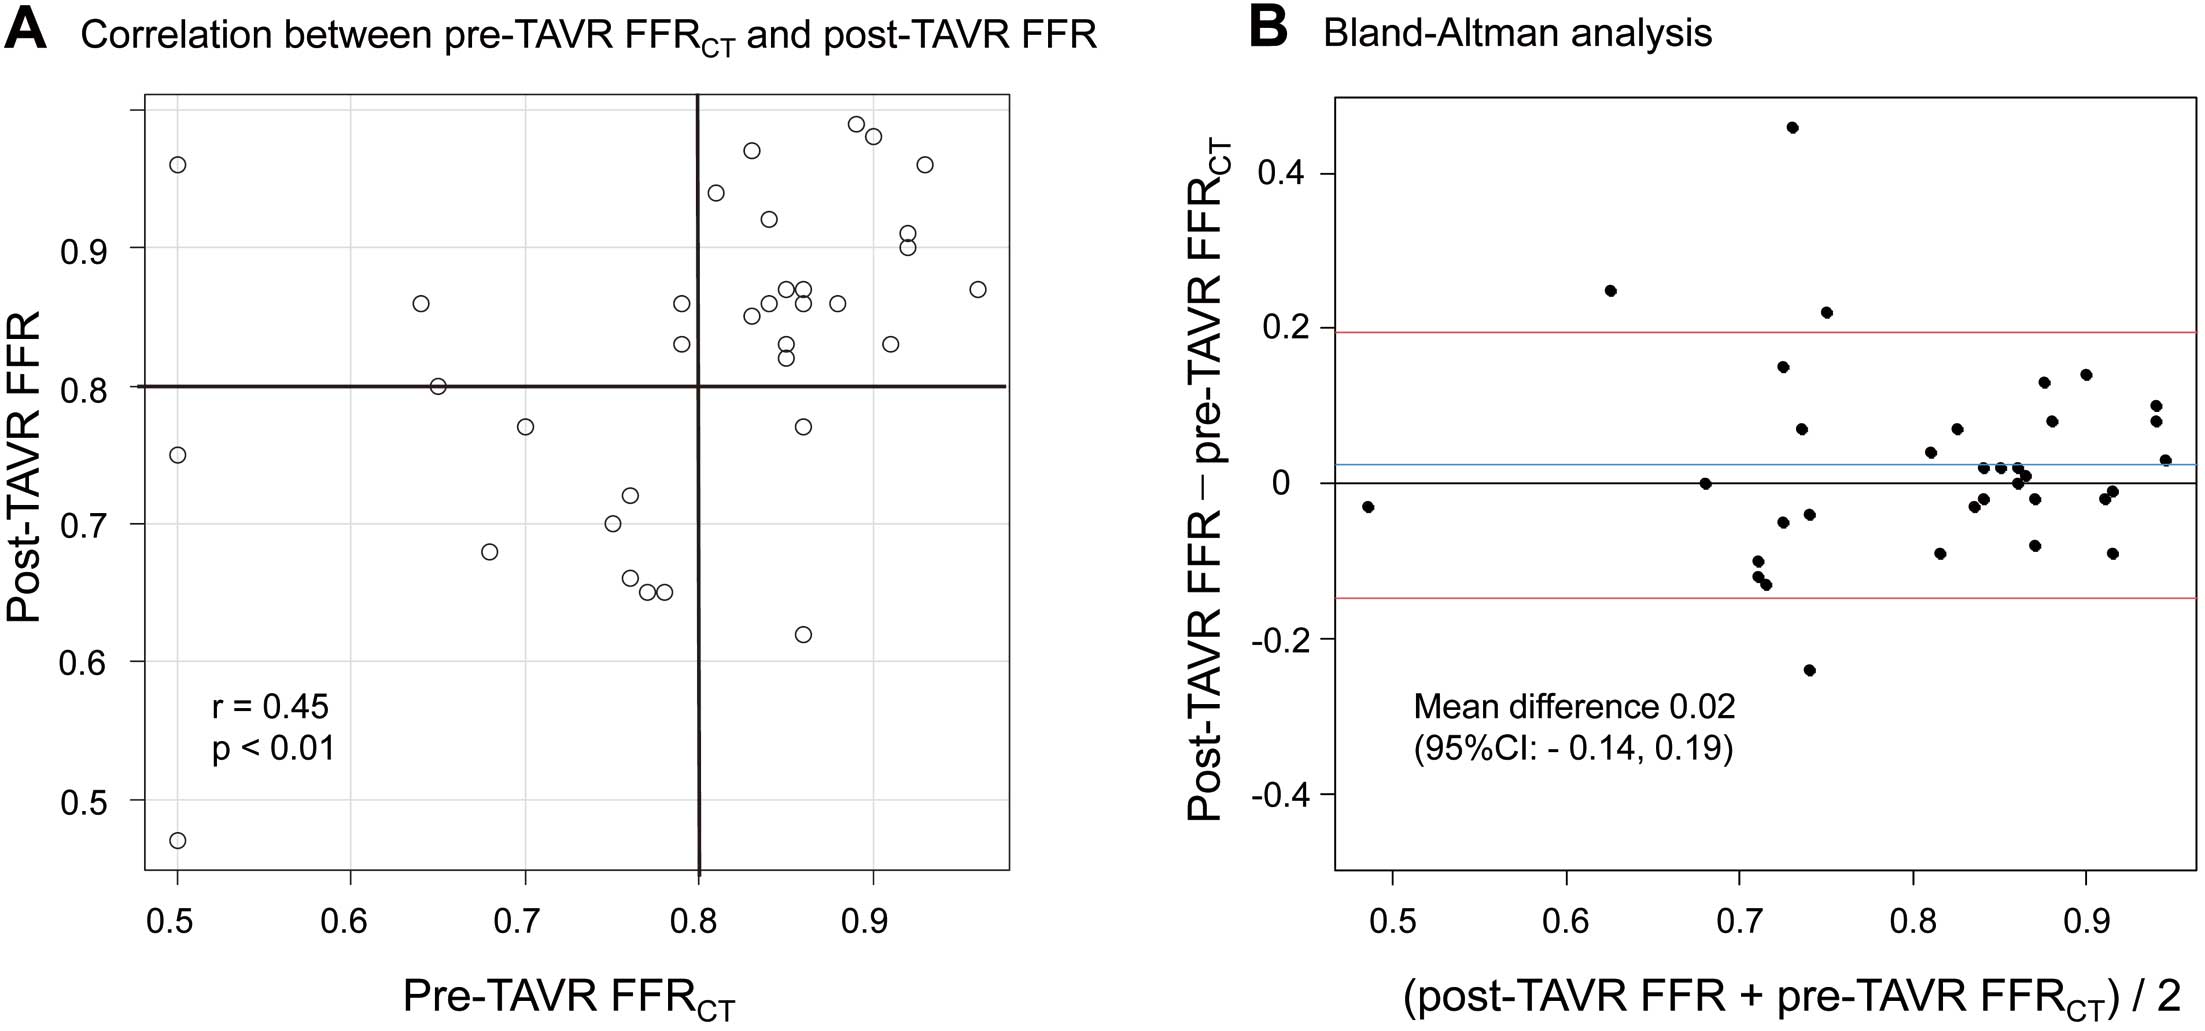
Table 2.
Diagnostic Performance of Pre-TAVR FFRCT, Pre-TAVR iFR, Pre-TAVR CAG, and Pre-TAVR cCTA to Distinguish Post-TAVR FFR ≤0.80 on a per-Vessel (A) / per-Patient (B) Basis
| (A) |
Pre-TAVR
FFRCT ≤0.80 |
Pre-TAVR
iFR ≤0.89 |
Pre-TAVR CAG
%DS ≥50% |
Pre-TAVR cCTA
%DS ≥50% |
| Accuracy |
82 (66–93) |
77 (58–90) |
68 (50–83) |
50 (32–68) |
| Sensitivity |
83 (52–98) |
90 (56–100) |
25 (6–57) |
58 (28–85) |
| Specificity |
82 (60–95) |
70 (46–88) |
91 (71–99) |
46 (24–68) |
| PPV |
71 (42–92) |
60 (32–84) |
60 (15–95) |
37 (16–62) |
| NPV |
90 (68–99) |
93 (68–100) |
69 (49–85) |
67 (38–88) |
| (B) |
|
|
|
|
| Accuracy |
91 (70–99) |
78 (52–94) |
71 (48–89) |
43 (22–66) |
| Sensitivity |
91 (59–100) |
100 (56–100) |
46 (17–77) |
46 (17–77) |
| Specificity |
90 (56–100) |
56 (21–86) |
100 (59–100) |
40 (12–74) |
| PPV |
91 (59–100) |
69 (39–91) |
100 (36–100) |
46 (17–77) |
| NPV |
90 (56–100) |
100 (36–100) |
55 (32–94) |
40 (12–74) |
Values are presented as percentage (95% confidence interval). CAG, coronary angiography; FFR, fractional flow reserve; iFR, instantaneous wave-free ratio; NPV, negative predictive value; PPV, positive predictive value. Other abbreviations as in Table 1.

We additionally assessed the diagnostic accuracy of pre-TAVR FFRCT
≤0.80 for LAD and non-LAD lesions and found comparable accuracy rates of 85% for LAD lesions and 79% for non-LAD lesions (Supplementary Table 2). ROC curves further demonstrated the discriminative ability, with AUC values of 0.87 for LAD lesions and 0.82 for non-LAD lesions (Supplementary Figure 2).
In addition, we categorized all lesions into 2 groups based on the Agatston score, using a median score of 897 as the threshold. The high Agatston score group had a mean pre-TAVR FFRCT
of 0.73 and post-TAVR FFR of 0.79, and the low Agatston score group had a mean pre-TAVR FFRCT
of 0.85 and post-TAVR FFR of 0.86 (Supplementary Table 2). In terms of diagnostic accuracy, the high Agatston score group achieved 75%, whereas the low Agatston score group demonstrated 93% accuracy (Supplementary Table 2). Moreover, the AUC of the ROC curve was 0.76 for the high Agatston score group and 1.0 for the low Agatston score group (Supplementary Figure 3).
Secondary Endpoints
According to the ROC curve analysis on a per-vessel pre-TAVR iFR, the optimal cutoff value indicating post-TAVR FFR ≤0.80 was 0.89 with an AUC of 0.86 (95% CI 0.71–1.0; Figure 4). The diagnostic performances of pre-TAVR iFR, pre-TAVR CAG %DS, and pre-TAVR cCTA %DS on vessel and per-patient basis are summarized in Table 2.
When comparing ROC curves between pre-TAVR FFRCT
and other indices, it was observed that pre-TAVR FFRCT
had a significantly larger AUC than pre-TAVR CAG %DS (P=0.03) and pre-TAVR cCTA ≥50% (P=0.04) (Table 3).
Table 3.
Comparison of Physiologic/Anatomic Indices Using ROC Curves
| |
Pre-TAVR FFRCT |
Pre-TAVR iFR |
Pre-TAVR CAG %DS |
Pre-TAVR cCTA %DS |
AUC by ROC
P for vs. pre-TAVR FFRCT |
0.84 (0.68–0.99)
NA |
0.86 (0.71–1.0)
P=0.93 |
0.53 (0.28–0.77)
P=0.03 |
0.60 (0.40–0.80)
P=0.04 |
Optimal cutoff to predict post-TAVR
FFR ≤0.80 |
0.78 |
0.89 |
45 |
54 |
| |
Post-TAVR FFRCT |
Post-TAVR iFR |
Post-TAVR CAG %DS |
Post-TAVR cCTA %DS |
AUC by ROC analysis
P for vs. post-TAVR FFRCT |
0.91 (0.79–1.0)
NA |
0.83 (0.69–0.97)
P=0.58 |
0.72 (0.55–0.90)
P=0.03 |
0.64 (0.43–0.84)
P=0.01 |
Optimal cutoff to predict post-TAVR
FFR ≤0.80 |
0.78 |
0.88 |
32 |
43 |
Comparison of ROC for each index
between pre- and post- TAVR |
P=0.33 |
P=0.48 |
P=0.08 |
P=0.68 |
AUC, area under the curve; ROC, receiver operating characteristic. Other abbreviations as in Tables 1,2.
The diagnostic performance of post-TAVR FFRCT, post-TAVR iFR, post-TAVR CAG %DS, and post-TAVR cCTA %DS is summarized in Supplementary Table 1. The diagnostic accuracy, sensitivity, specificity, PPV, and NPV of post-TAVR FFRCT
≤0.80 to predict post-TAVR FFR ≤0.80 were 91%, 100%, 85%, 80%, and 100%, respectively, on a per-vessel basis; and those of post-TAVR iFR ≤0.89 were 79%, 82%, 77%, 64%, and 90%, respectively.
There was no statistically significant difference in diagnostic performance between pre- and post-TAVR FFRCT
(AUC: 0.84 vs. 0.91, P=0.33). A similar trend was noted for pre- and post-TAVR iFR (AUC: 0.86 vs. 0.83, P=0.48), pre-and post-TAVR CAG %DS (AUC: 0.53 vs. 0.72, P=0.08), and cCTA %DS (AUC: 0.60 vs. 0.64, P=0.68) (Table 3). The ROC curves showed that the diagnostic performance of post-TAVR FFRCT
was not significantly better than that of the post-TAVR iFR. However, it was better than that of post-TAVR CAG %DS and cCTA %DS (Table 3).
Figure 5 shows the variations in the FFRCT
and iFR before and after TAVR. There was no statistically significant change in FFRCT
(from 0.79±0.12 to 0.76±0.15) before and after TAVR (P=0.09). Furthermore, the change in iFR (from 0.87±0.10 to 0.89±0.11) was not statistically significant (P=0.08).
Discussion
The present study is among the limited number that have reported on the diagnostic accuracy of physiological assessments using nitroglycerin-free FFRCT
in patients undergoing TAVR for severe AS.13 Our study has unique aspects, including the assessment of iFR and FFRCT
before and after TAVR, as well as the use of post-TAVR invasive FFR as the reference standard for evaluating ischemia.
The main findings of the current study can be summarized as follows. (1) Pre-TAVR FFRCT
without nitroglycerin demonstrated good diagnostic yield in determining the physiological relevance of coronary stenoses in patients with severe AS scheduled for TAVR, comparable to pre-TAVR iFR and superior to pre-TAVR CAG %DS ≥50% or cCTA %DS ≥50%. (2) Post-TAVR FFRCT
with nitroglycerin exhibited high diagnostic performance, comparable to post-TAVR iFR and superior to post-TAVR CAG %DS ≥50% or cCTA %DS ≥50%.
Assessing coronary artery lesions in patients with severe AS remains a challenge, with invasive CAG commonly used but providing insufficient information on functional impact.14 FFR measurement is considered the gold standard, but concerns about vasoactive drugs in the presence of severe AS and its potential underestimation have limited its use.15,16 With TAVR now being performed on low-risk younger patients, there is a need for reliable pre-TAVR functional tests to ensure long-term outcomes for patients with severe AS and concomitant CAD.
FFRCT
is a non-invasive imaging modality that calculates the FFR from cCTA, allowing for both anatomic and functional assessment of coronary lesions.17 To achieve accurate FFRCT
analysis, vessel caliber needs to resemble the condition during cardiac catheterization using sublingual nitrates. This study evaluated the diagnostic accuracy of nitroglycerin-free FFRCT
in patients with severe AS undergoing TAVR. The results showed that pre-TAVR FFRCT
without nitroglycerin was feasible, with an AUC of 0.84 for diagnostic performance. The diagnostic accuracy, sensitivity, specificity, PPV, and NPV of pre-TAVR FFRCT
≤0.80 to predict post-TAVR FFR ≤0.80 were 82%, 83%, 82%, 71%, and 90%, respectively, on a per-vessel basis. Pre-TAVR FFRCT
without nitroglycerin outperformed pre-TAVR CAG %DS ≥50% or cCTA %DS ≥50%, indicating the incremental diagnostic value of FFRCT
for simple morphological evaluation based on stenosis severity.
In a recent study comparing FFRCT
with nitroglycerin to invasively derived FFR in patients with severe AS, a strong positive correlation between FFR and FFRCT
was found.18 The present study, however, differs in terms of evaluating nitroglycerin-free FFRCT, using post-TAVR FFR as the reference standard, and including older patients with more severe AS. Given these differences, it is difficult to determine the superior approach (with or without nitroglycerin) for patients with severe AS. Nevertheless, both studies suggest the potential utility of FFRCT
for functional evaluation of concomitant CAD in patients with severe AS.
Leipsic et al reported that sublingual nitroglycerin improved the specificity but not the overall diagnostic accuracy of FFRCT.19 In the present study, although the AUC of pre-TAVR FFRCT
was numerically lower than that of the post-TAVR FFRCT
there was no statistical difference between them (0.84 vs. 0.91, P=0.33). The feasibility of nitroglycerin-free FFRCT
may be attributed to the involvement of multiple factors in the FFRCT
analysis, which minimized the impact of patient-specific anatomic differences with and without nitroglycerin
One of the unique advantages of the present study was the use of post-TAVR invasive FFR as the reference standard for assessing ischemia. Previous studies evaluating functional test in patients with severe AS often use FFR measured under severe AS as the reference, despite the significant effect of AS on coronary hemodynamics. Some reports demonstrated that FFR-based physiological evaluation of concomitant CAD in severe AS might underestimate ischemia.15,16 Therefore, using post-TAVR FFR as the reference standard is crucial for accurately evaluating the effect of the target stenosis after treatment of severe AS. FFRCT, in this context, is an ideal imaging modality for assessing the true effect of the target stenosis, as it enables evaluation of stenosis severity as if no stenosis were present in the aortic valve.
The diagnostic performance of pre-TAVR FFRCT
without nitroglycerin was statistically comparable to that of iFR before TAVR, based on previous studies demonstrating the safety and feasibility of iFR in severe AS patients with intermediate coronary stenosis.20 The present study further supports the use of nitroglycerin-free FFRCT
as a feasible option for evaluating ischemia in severe AS patients undergoing TAVR.
The advantage of FFRCT
is that it does not require additional contrast agents beyond routine contrast CT prior to TAVR. By providing functional information about coronary artery stenosis, FFRCT
can help avoid unnecessary CAG in patients with intermediate lesions. This is especially beneficial for patients with impaired renal function because it reduces the need for additional contrast agents required for CAG.
Study Limitations
Despite our study’s strengths, we acknowledge certain limitations. Firstly, being a single-center trial with a relatively small sample size, population biases might exist. Larger, multicenter studies are warranted to validate our findings and provide more comprehensive insights into the use of FFRCT
in severe AS. Secondly, although FFRCT
is able to assess the physiological significance of left main trunk (LMT) stenosis, our study did not include patients with LMT disease. Therefore, we were unable to evaluate the diagnostic performance of FFRCT
in this specific patient population. Future research could shed more light on this aspect. Despite these limitations, our study contributes to the evidence supporting the diagnostic accuracy and utility of nitroglycerin-free FFRCT
in evaluating CAD in severe AS patients. Further exploration of FFRCT
’s potential, including its assessment of severe LMT stenosis, is needed to optimize patient selection and guide clinical decision-making in the context of TAVR.
Conclusions
For patients with severe AS undergoing TAVR, FFRCT
without nitroglycerin is a promising option for evaluating comorbid CAD.
Funding
This work was collaborative research with HeartFlow Inc. (Mountainview, CA, USA). As a joint research corporation, they provided the FFRCT
analysis in this study. However, the company was not involved in the design, data collection, analysis other than FFRCT, and interpretation or the decision to submit the article for publication.
Disclosures
K.H. is a member of Circulation Journal’s Editorial Board. The other authors have no conflicts of interest to declare.
IRB Information
Ethics Committee at Kobe University Hospital, reference no. 300028
Data Availability Statement
The deidentified participant data will not be shared.
Supplementary Files
Please find supplementary file(s);
https://doi.org/10.1253/circj.CJ-23-0312
References
- 1.
Mack MJ, Leon MB, Smith CR, Miller DC, Moses JW, Tuzcu EM, et al. 5-year outcomes of transcatheter aortic valve replacement or surgical aortic valve replacement for high surgical risk patients with aortic stenosis (PARTNER 1): A randomized controlled trial. Lancet 2015; 385: 2477–2484, doi:10.1016/S0140-6736(15)60308-7.
- 2.
Adams DH, Popma JJ, Reardon MJ, Yakubov SJ, Coselli JS, Deeb GM, et al. Transcatheter aortic-valve replacement with a self-expanding prosthesis. N Engl J Med 2014; 370: 1790–1798, doi:10.1056/NEJMoa1400590.
- 3.
Leon MB. Transcatheter aortic-valve implantation for aortic stenosis in patients who cannot undergo surgery. N Engl J Med 2010; 363: 1597–1607, doi:10.1056/NEJMoa1008232.
- 4.
Popma JJ, Deeb GM, Yakubov SJ, Mumtaz M, Gada H, O’Hair D, et al. Transcatheter aortic-valve replacement with a self-expanding valve in low-risk patients. N Engl J Med 2019; 380: 1706–1715, doi:10.1056/NEJMoa1816885.
- 5.
Mack MJ, Leon MB, Thourani VH, Makkar R, Kodali SK, Russo M, et al. Transcatheter aortic-valve replacement with a balloon-expandable valve in low-risk patients. N Engl J Med 2019; 380: 1695–1705, doi:10.1056/NEJMoa1814052.
- 6.
Sankaramangalam K, Banerjee K, Kandregula K, Mohananey D, Parashar A, Jones BM, et al. Impact of coronary artery disease on 30-day and 1-year mortality in patients undergoing transcatheter aortic valve replacement: A meta-analysis. J Am Heart Assoc 2017; 6: e006092, doi:10.1161/JAHA.117.006092.
- 7.
Vilalta V, Asmarats L, Ferreira-Neto AN, Maes F, de Freitas Campos Guimaraes L, Couture T, et al. Incidence, clinical characteristics, and impact of acute coronary syndrome following transcatheter aortic valve replacement. JACC Cardiovasc Interv 2018; 11: 2523–2533, doi:10.1016/j.jcin.2018.09.001.
- 8.
Koo BK, Erglis A, Doh JH, Daniels DV, Jegere S, Kim HS, et al. Diagnosis of ischemia-causing coronary stenoses by noninvasive fractional flow reserve computed from coronary computed tomographic angiograms: Results from the prospective multicenter DISCOVER-FLOW (Diagnosis of Ischemia-Causing Stenoses Obtained Via Noninvasive Fractional Flow Reserve) study. J Am Coll Cardiol 2011; 58: 1989–1997, doi:10.1016/j.jacc.2011.06.066.
- 9.
Min JK, Leipsic J, Pencina MJ, Berman DS, Koo BK, van Mieghem C, et al. Diagnostic accuracy of fractional flow reserve from anatomic CT angiography. JAMA 2012; 308: 1237–1245, doi:10.1001/2012.jama.11274.
- 10.
Norgaard BL, Leipsic J, Gaur S, Seneviratne S, Ko BS, Ito H, et al. Diagnostic performance of noninvasive fractional flow reserve derived from coronary computed tomography angiography in suspected coronary artery disease: The NXT trial (Analysis of Coronary Blood Flow Using CT Angiography: Next Steps). J Am Coll Cardiol 2014; 63: 1145–1155, doi:10.1016/j.jacc.2013.11.043.
- 11.
Suzuki M, Toba T, Izawa Y, Fujita H, Miwa K, Takahashi Y, et al. Prognostic impact of myocardial extracellular volume fraction assessment using dual-energy computed tomography in patients treated with aortic valve replacement for severe aortic stenosis. J Am Heart Assoc 2021; 10: e020655, doi:10.1161/JAHA.120.020655.
- 12.
Gotberg M, Christiansen EH, Gudmundsdottir IJ, Sandhall L, Danielewicz M, Jakobsen L, et al. Instantaneous wave-free ratio versus fractional flow reserve to guide PCI. N Engl J Med 2017; 376: 1813–1823, doi:10.1056/NEJMoa1616540.
- 13.
Yamanaka F, Shishido K, Moriyama N, Ochiai T, Sato D, Koyama E, et al. Diagnostic performance of noninvasive computed tomography-derived fractional flow reserve in patients with severe aortic stenosis. JACC Cardiovasc Imaging 2023; 16: 1116–1117, doi:10.1016/j.jcmg.2023.02.003.
- 14.
Lotfi A, Davies JE, Fearon WF, Grines CL, Kern MJ, Klein LW. Focused update of expert consensus statement: Use of invasive assessments of coronary physiology and structure: A Position Statement of the Society of Cardiac Angiography and Interventions. Catheter Cardiovasc Interv 2018; 92: 336–347, doi:10.1002/ccd.27672.
- 15.
Ahmad Y, Gotberg M, Cook C, Howard JP, Malik I, Mikhail G, et al. Coronary hemodynamics in patients with severe aortic stenosis and coronary artery disease undergoing transcatheter aortic valve replacement: Implications for clinical indices of coronary stenosis severity. JACC Cardiovasc Interv 2018; 11: 2019–2031, doi:10.1016/j.jcin.2018.07.019.
- 16.
Vendrik J, Ahmad Y, Eftekhari A, Howard JP, Wijntjens GWM, Stegehuis VE, et al. Long-term effects of transcatheter aortic valve implantation on coronary hemodynamics in patients with concomitant coronary artery disease and severe aortic stenosis. J Am Heart Assoc 2020; 9: e015133, doi:10.1161/JAHA.119.015133.
- 17.
Taylor CA, Fonte TA, Min JK. Computational fluid dynamics applied to cardiac computed tomography for noninvasive quantification of fractional flow reserve: Scientific basis. J Am Coll Cardiol 2013; 61: 2233–2241, doi:10.1016/j.jacc.2012.11.083.
- 18.
Michail M, Ihdayhid AR, Comella A, Thakur U, Cameron JD, McCormick LM, et al. Feasibility and validity of computed tomography-derived fractional flow reserve in patients with severe aortic stenosis: The CAST-FFR study. Circ Cardiovasc Interv 2021; 14: e009586, doi:10.1161/CIRCINTERVENTIONS.120.009586.
- 19.
Leipsic J, Yang TH, Thompson A, Koo BK, Mancini GB, Taylor C, et al. CT angiography (CTA) and diagnostic performance of noninvasive fractional flow reserve: Results from the Determination of Fractional Flow Reserve by Anatomic CTA (DeFACTO) study. AJR Am J Roentgenol 2014; 202: 989–994, doi:10.2214/AJR.13.11441.
- 20.
Yamanaka F, Shishido K, Ochiai T, Moriyama N, Yamazaki K, Sugitani A, et al. Instantaneous wave-free ratio for the assessment of intermediate coronary artery stenosis in patients with severe aortic valve stenosis: Comparison with myocardial perfusion scintigraphy. JACC Cardiovasc Interv 2018; 11: 2032–2040, doi:10.1016/j.jcin.2018.07.027.


