Abstract
Background: Changes in left ventricular (LV) remodeling, especially in relation to the duration of therapy, are poorly understood in patients with hypertrophic non-obstructive cardiomyopathy (HNCM).
Methods and Results: This study included 254 consecutive patients with HNCM. Patients were divided into 3 groups according to the length of chronic cibenzoline therapy (CCT): Group I (n=104), CCT ≥10 years; Group II (n=85), 5 years≤CCT<10 years; and Group III (n=65), 1 year ≤CCT<5 years. SV1+RV5 and the maximum depth of precordial negative T waves were measured on electrocardiograms (ECG). In addition to routine echocardiographic indices, we measured the distance between the mitral valve and the apex (i.e., the “LV long distance” [LVLD]). After CCT, ECG indices and LV wall thicknesses were decreased in all 3 groups. LV dimensions and LV fractional shortening were preserved, and did not differ significantly among the groups. Left atrial dimension and the E/A ratio also did not differ among the groups, whereas the E/early diastolic annular velocity (Ea) ratio was decreased in Groups I and II. After CCT, LVLD was increased in all groups (all P<0.0001). These improvements were greater in Group I than in Groups II and III.
Conclusions: CCT preserved LV systolic function and reduced LV hypertrophy in patients with HNCM. The E/Ea ratio was improved in Groups I and II. Thus, CCT aids in treating patients with HNCM.
Hypertrophic cardiomyopathy (HCM) is clinically subdivided into 2 types: hypertrophic obstructive cardiomyopathy (HOCM) and hypertrophic non-obstructive cardiomyopathy (HNCM). Owing to systolic murmurs associated with left ventricular pressure gradient (LVPG) and prognostic deterioration,1 general interest is primarily focused on HOCM. Therefore, only a limited number of studies have addressed changes in LV remodeling in patients with HNCM.2
In a previous study we reported on the acute effects of the oral administration of the antiarrhythmic drug cibenzoline, which reduced LVPG and improved LV diastolic dysfunction in patients with HOCM.3 Similarly, chronic cibenzoline therapy (CCT) was reported to reduce the LVPG and improve prognosis in patients with HOCM.4 Very recently, treatment with the cardiac myosin inhibitor mavacamten was reported to be associated with an improvement in LVPG in Japanese patients with HOCM.5 The acute effects of cibenzoline include suppression of LV systolic function, as well as improvements in LV diastolic function in both HOCM and HNCM patients.3,6 Similarly, intravenous administration of cibenzoline decreases LV diastolic pressures in both HOCM and HNCM patients.7 However, the effects of chronic medical therapy with cibenzoline on LV remodeling in patients with HNCM have not been evaluated. Thus, the aim of the present study was to examine the chronic effects of CCT on LV remodeling in patients with HNCM, in particular evaluating whether differences in the length of CCT affect the extent of LV remodeling.
Methods
Study Participants
This study was approved by the Human Investigations Committees of Ehime University Hospital (No. 14–25 in 2002) and Uwajima City Hospital (No. 24 in 2003). The study conformed to the principles outlined in the Declaration of Helsinki (Br Med J 1964; ii: 177).
This study included 254 consecutive patients diagnosed with HNCM since 1998 who provided informed consent to take part in the study. Patients who met the criteria of the World Health Organization/International Society and Federation of Cardiology for cardiomyopathies were included in the study.8 HNCM was diagnosed when LVPG did not exceed 30 mmHg without provocation. Of the 254 patients with HNCM, 223 (87.8%) had negative T waves on precordial leads. Patients with coronary artery stenosis, atrial fibrillation (AF), a history of LV heart failure (LVHF), or plasma creatinine levels >1.2 mg/dL at the start of the study were excluded.
All patients were treated with cibenzoline. To compare the extent of LV remodeling according to the length of CCT, patients were divided into 3 groups depending on the duration of CCT as follows: Group I (n=104), CCT ≥10 years; Group II (n=85), 5 years≤CCT<10 years; and Group III (n=65), 1 year≤CCT<5 years (Table 1).
Table 1.
Changes in Hemodynamic Parameters Before and After Cibenzoline Therapy in Groups I, II, and III
| |
Group I (n=104) |
Group II (n=85) |
Group III (n=65) |
| CBZ (−) |
CBZ (+) |
P value |
CBZ (−) |
CBZ (+) |
P value |
CBZ (−) |
CBZ (+) |
P value |
| Age (years) |
58.7±11.3 |
|
|
64.2±11.4 |
|
|
64.5±10.8 |
|
|
Heart rate
(beats/min) |
72.0±9.7 |
72.5±9.1 |
NS |
71.4±9.2 |
70.9±9.1 |
NS |
74.5±10.8 |
71.1±10.3 |
<0.01 |
| SBP (mmHg) |
139.5±22.4 |
140.8±14.2 |
NS |
140.6±15.8 |
138.3±16.8 |
NS |
147.3±16.0 |
139.8±17.1 |
<0.005 |
| DBP (mmHg) |
79.9±13.1 |
74.3±10.9 |
<0.0001 |
75.5±12.9 |
72.8±10.1 |
<0.02 |
78.1±12.6 |
72.9±12.4 |
<0.005 |
| SV1+RV5 (mm) |
48.9±16.1 |
33.6±13.7 |
<0.0001 |
45.5±19.2 |
35.2±13.7 |
<0.0001 |
37.4±14.9 |
32.4±13.2 |
<0.0001 |
Depth of negative
T wave (mV) |
7.7±6.4 |
3.0±3.4 |
<0.0001 |
6.0±6.1 |
2.3±3.2 |
<0.0001 |
3.9±3.9 |
2.1±2.9 |
<0.0001 |
LV end-diastolic
dimension (mm) |
49.6±2.4 |
50.8±3.4 |
<0.05 |
50.0±5.9 |
50.1±5.6 |
NS |
47.7±5.6 |
48.4±5.6 |
NS |
LV end-systolic
dimension (mm) |
28.0±4.1 |
30.5±3.6 |
<0.0001 |
29.3±4.5 |
30.1±4.9 |
NS |
28.0±4.1 |
28.7±2.4 |
NS |
LV fractional
shortening (%) |
43.6±5.4 |
40.3±5.2 |
<0.0001 |
41.3±4.9 |
40.3±3.3 |
NS |
41.4±4.5 |
40.7±4.9 |
NS |
IVS wall thickness
(mm) |
10.8±2.9 |
9.7±1.8 |
<0.0001 |
10.1±2.5 |
9.6±1.9 |
<0.005 |
10.2±2.2 |
9.5±1.7 |
<0.0001 |
LV posterior wall
thickness (mm) |
10.8±0.71 |
10.2±1.5 |
<0.0001 |
10.0±1.7 |
9.7±1.5 |
<0.02 |
9.9±1.8 |
9.5±1.7 |
<0.005 |
| LA dimension (mm) |
40.8±1.6 |
40.1±6.4 |
NS |
38.8±3.1 |
38.3±5.4 |
NS |
40.0±2.0 |
39.4±6.6 |
NS |
| E/A ratio |
0.87±0.32 |
0.91±0.41 |
NS |
0.79±0.32 |
0.89±0.53 |
NS |
0.81±0.25 |
0.89±0.37 |
NS |
| E/Ea ratio |
13.2±6.3 |
12.1±6.6 |
<0.05 |
14.0±5.4 |
12.5±6.1 |
<0.02 |
12.4±5.0 |
11.9±5.3 |
NS |
| LVLD (mm) |
63.9±5.3 |
76.0±5.5 |
<0.0001 |
65.6±3.8 |
74.8±8.3 |
<0.0001 |
62.3±7.6 |
71.2±8.9 |
<0.0001 |
Unless indicated otherwise, data are given as the mean±SD. CBZ, cibenzoline; DBP, diastolic blood pressure; Group I, chronic cibenzoline therapy (CCT) ≥10 years; Group II, 5 years≤CCT<10 years; Group III, 1 year ≤CCT<5 years; IVS, interventricular septum; LA, left atrial; LV, left ventricular; LVLD, left ventricular long distance; SBP, systolic blood pressure.
In this study, when patients had high blood pressure, only long-acting calcium channel antagonists were used to decrease hypertension.9 In addition, patients were not permitted to change their lifestyle and were requested to avoid hard work, such as competing with others.
The clinical endpoint of this study was death. The average lifespan in Japan at the beginning of the study was 87.1 years for women and 81.3 years for men. Therefore, we excluded hemodynamic examinations in women aged ≥85 years and in men aged ≥80 years.
Cibenzoline Dosage
Because cibenzoline is short acting, 100 mg was administered three times daily: after breakfast, at approximately 14:00 hours, and at 21:00 hours. However, because cibenzoline decreases plasma sugar concentrations,10 it was administered twice daily to 25 patients with fasting plasma sugar levels <70 mg/dL. To confirm the effect of long-term cibenzoline administration, we measured plasma concentrations of cibenzoline 2 h after oral administration, when the maximum plasma concentration was expected.11
ECG and Echocardiographic Studies
ECG and echocardiographic studies were usually performed every 4 months. In ECG studies, the Sokolow-Lyon index (SV1+RV5)12 and maximum depth of negative T waves were measured on a 12-lead ECG.
The end-diastolic and end-systolic LV dimensions, as well as interventricular septal wall and LV posterior wall thicknesses were measured.13 LV fractional shortening was calculated, and left atrial dimension was measured. Peak E wave and peak A wave velocities were measured, and the E/A ratio was calculated.14 The early diastolic annular velocity (Ea) was measured using tissue Doppler, and the E/Ea ratio was calculated.15 These echocardiographic indices were measured by 3 experts to avoid errors.
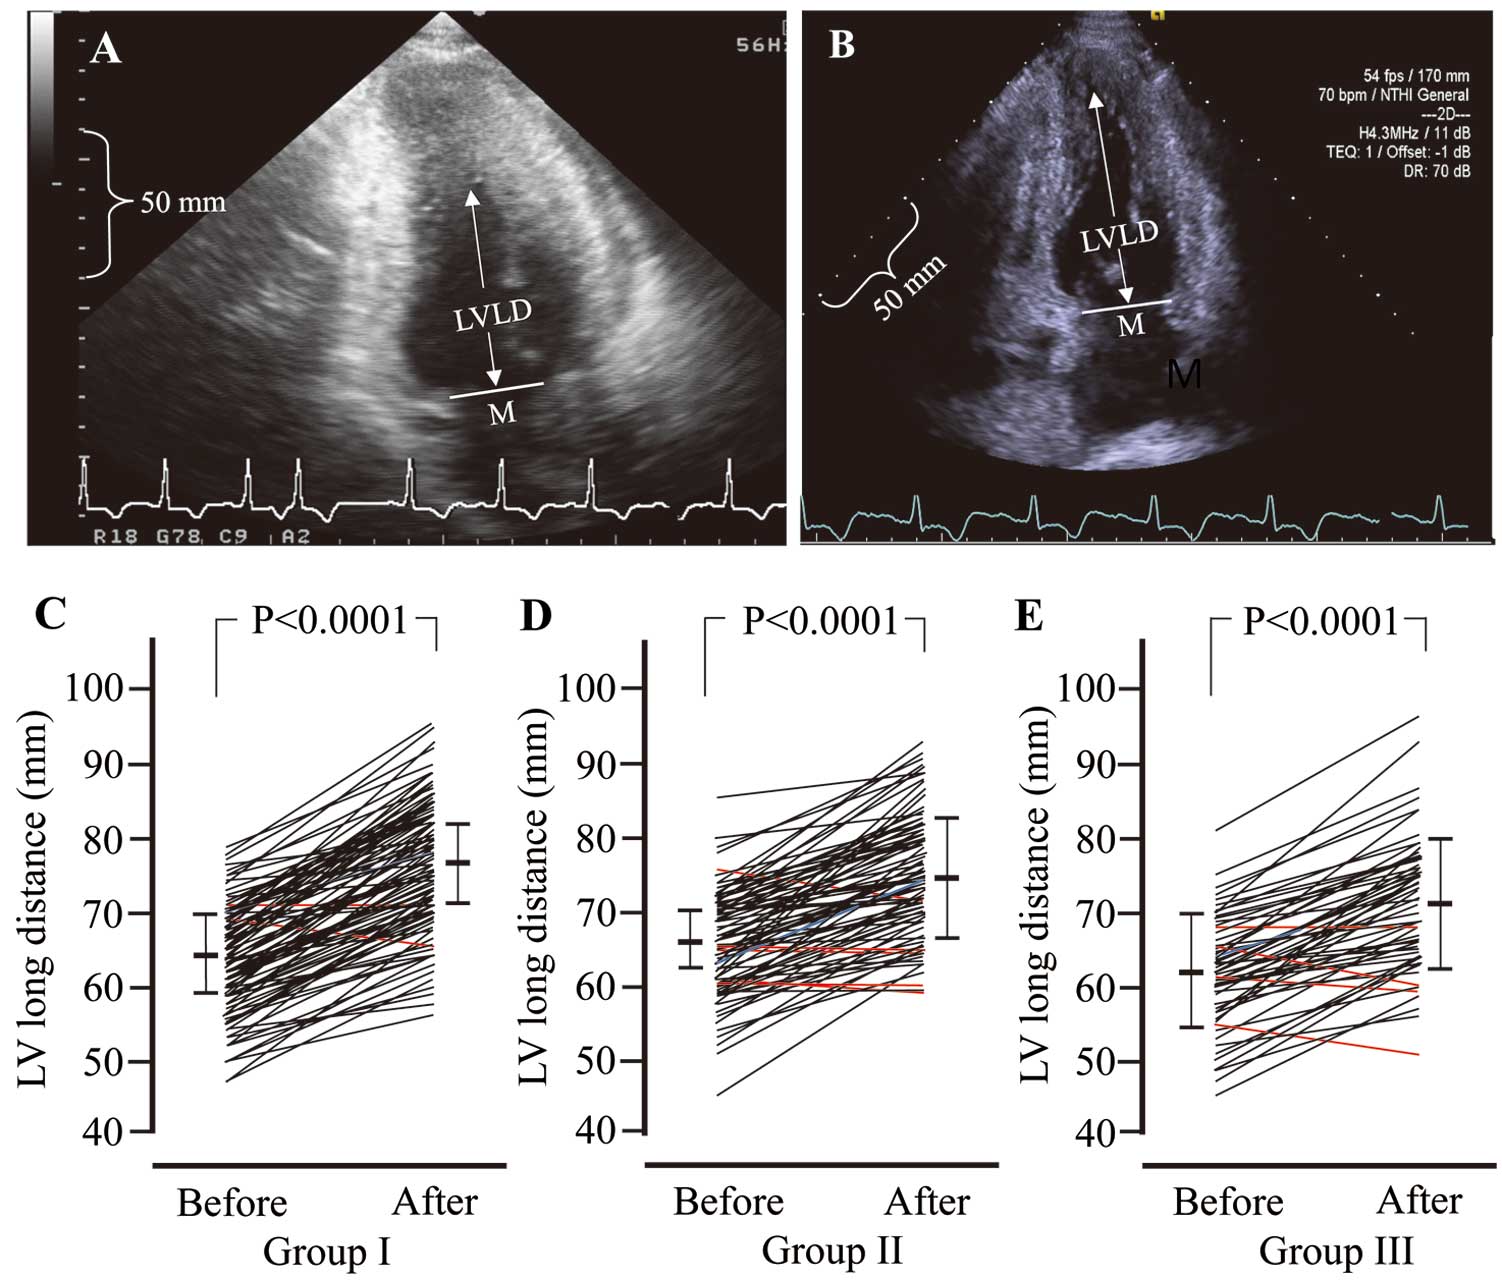
In this study, we devised a new index, namely the “LV long distance” (LVLD), which was measured at the peak of the QRS for determining end-diastole. Many patients who participated in this study had prominent LV hypertrophy (LVH) at the LV apex. Therefore, the distance between the mid-point of the mitral valve and the apex at end-diastole (LVLD) was measured to evaluate changes in LVH at the LV apex using the apical 2-chamber view. The reliability of the LVLD was evaluated, with an intraclass correlation coefficient (ICC) (1.1) of 0.998 (95% confidence interval [CI] 0.997–0.998) and an ICC (2,1) of 0.992 (95% CI 0.990–0.994).
To compare the extent of the hemodynamic indices among the 3 groups, 2 methods were used. First, we calculated the percentage change using the following formula:
Percentage change = (last data − first data) / last data × 100
Second, we calculated the difference in data by subtracting first data from last data.
Statistical Analysis
All values are expressed as mean±SD. Data obtained before and after administration of cibenzoline were compared using Student’s t-test for paired samples and the χ2
test for unpaired samples. The Mann-Whitney U test was used to analyze non-normally distributed variables for 2-group comparisons. Statistical comparisons between Groups I and II or III were made using one-way analysis of variance with subsequent Schiff’s multiple range tests. Statistical analyses of the ICC were conducted using EZR (ver. 152), a software for head and neck studies with extended R and R Commander functions (available for free from the Saitama Medical Center, Jichi Medical University website: https://www.jichi.ac.jp/saitama-sct/SaitamaHP.files/statmed.html). Significance was set at P<0.05.
Results
Patients Characteristics
The mean follow-up period in Groups I, II, and III was 15.4±3.5, 7.6±1.4, and 3.6±1.1 years, respectively. The mean plasma cibenzoline concentration in Groups I, II, and III was 465.2±192.2, 499.3±177.5, and 439.9±163.4 ng/mL, respectively.
As indicated in Table 1, there were no differences in heart rates before and after CCT among the 3 groups. A significant decrease in systolic blood pressure after CCT was seen in Group III, although there was no significant difference in systolic blood pressure after CCT among the 3 groups. A significant decrease in diastolic blood pressure after CCT was observed in all groups.
ECG Changes
The black and red lines in Figure 1 indicate the decrease and increase, after CCT. As indicated in Figure 1 and Table 1, all ECG indices were significantly reduced by CCT in all groups.
Echocardiographic Changes
As indicated in Table 1, LV end-diastolic and end-systolic dimensions increased significantly in Group I after CCT; however, there were no significant changes in these parameters after CCT in Groups II and III. LV fractional shortening was significantly reduced in Group I after CCT, but did not change significantly after CCT in Groups II and III.
As shown in Figure 2, interventricular septal wall and LV posterior wall thicknesses were significantly reduced in all groups after CCT.
As indicated in Table 1, there were no significant differences in the left atrial dimension and E/A ratio before and after CCT in all 3 groups. However, the E/Ea ratio after CCT was significantly decreased in Groups I and II.
Figure 3A,B shows representative changes in the LVLD in a patient in Group I from before CCT (Figure 3A; LVLD=68.5 mm) to after CCT (Figure 3B; LVLD=85.5 mm). At the same time, marked regression of LV apex was observed after CCT (Figure 3B). As shown in Figure 3C–E, LVLD values were significantly increased in all groups after CCT.
Changes in Indices According to Different in Follow-up Periods
Table 2 presents percentage changes and differences in data for the 3 groups, as well as the results of comparisons (P values) between Group I and Groups II or III. Among the indices, SV1+RV5, LV end-systolic dimension, LV fractional shortening, and LVLD showed significant differences between Group I and Groups II or III. However, the depth of the negative T wave showed the difference between percentage changes and difference of data. This is due to the same percentage change value between Groups I and II, which occurred by chance.
Table 2.
Percentange Change and Difference in Data in Groups I, II, and III and P Values for Comparisons of Group I vs. Groups II or III
| |
Group I |
Group II |
Group III |
P values |
| ANOVA |
Group I vs.
Group II |
Group I vs.
Group III |
| Heart rate |
| % Change |
0.39±14.38 |
0.26±13.91 |
−3.79±12.13 |
NS |
|
|
| Difference in data (beats/min) |
−0.50±10.21 |
−0.48±10.15 |
−3.37±9.64 |
NS |
|
|
| Systolic blood pressure |
| % Change |
−0.15±10.95 |
−1.08±12.01 |
−4.32±12.16 |
NS |
|
|
| Difference in data (mmHg) |
−1.27±16.01 |
−2.35±16.90 |
−7.52±18.83 |
NS |
|
|
| Diastolic blood pressure |
| % Change |
−6.21±13.40 |
−2.70±14.09 |
−5.23±17.21 |
NS |
|
|
| Difference in data (mmHg) |
−5.65±10.97 |
−2.67±10.04 |
−5.2±13.70 |
NS |
|
|
| SV1+RV5 |
| % Change |
−29.44±20.84 |
−19.84±23.84 |
−11.68±20.48 |
<0.0001 |
<0.005 |
<0.0001 |
| Difference in data (mm) |
−15.32±12.41 |
−10.31±12.59 |
−4.97±8.31 |
<0.0001 |
<0.005 |
<0.0001 |
| Depth of negative T wave |
| % Change |
−50.66±50.60 |
−51.45±46.46 |
−42.11±43.37 |
NS |
|
|
| Difference in data (mm) |
−4.72±4.85 |
−3.75±4.67 |
−1.79±2.20 |
<0.0002 |
<0.0001 |
<0.01 |
| LV end-diastolic dimension |
| % Change |
2.84±10.78 |
0.75±8.57 |
1.78±7.53 |
NS |
|
|
| Difference in data (mm) |
1.19±5.36 |
0.15±4.47 |
0.71±3.47 |
NS |
|
|
| LV end-systolic dimension |
| % Change |
9.89±17.07 |
3.24±14.26 |
3.12±10.41 |
<0.005 |
<0.005 |
<0.01 |
| Difference in data (mm) |
2.48±4.69 |
0.72±4.25 |
0.75±2.84 |
<0.01 |
<0.005 |
<0.02 |
| LV fractional shortening |
| % Change |
−6.46±15.11 |
−1.82±11.96 |
−1.05±12.08 |
<0.02 |
<0.02 |
<0.02 |
| Difference in data (%) |
−3.30±6.70 |
−1.00±5.02 |
−0.69±5.01 |
<0.02 |
<0.01 |
<0.01 |
| IVS wall thickness |
| % Change |
−7.46±13.30 |
−3.05±13.07 |
−5.96±9.70 |
NS |
|
|
| Difference in data (mm) |
−1.05±2.00 |
−0.49±1.57 |
−0.72±1.18 |
NS |
|
|
| LV posterior wall thickness |
| % Change |
−4.75±10.72 |
−2.14±13.63 |
−3.85±10.69 |
NS |
|
|
| Difference in data (mm) |
−0.60±1.27 |
−0.36±1.39 |
−0.43±1.11 |
NS |
|
|
| Left atrial dimension |
| % Change |
−1.02±12.24 |
−0.98±11.48 |
−1.51±11.86 |
NS |
|
|
| Difference in data (mm) |
−0.59±5.07 |
−0.56±4.28 |
−0.62±4.58 |
NS |
|
|
| E/A ratio |
| % Change |
8.75±45.07 |
18.63±62.93 |
13.90±42.56 |
NS |
|
|
| Difference in data |
0.04±0.38 |
0.10±0.53 |
0.08±0.36 |
NS |
|
|
| E/Ea ratio |
| % Change |
−4.32±35.97 |
−6.88±35.08 |
−0.95±30.30 |
NS |
|
|
| Difference in data |
−1.15±4.58 |
−1.49±5.14 |
−0.55±3.87 |
NS |
|
|
| LVLD |
| % Change |
19.44±10.41 |
14.58±10.68 |
14.65±10.40 |
<0.005 |
<0.002 |
<0.01 |
| Difference in data (mm) |
12.09±6.17 |
9.24±6.40 |
8.86±5.94 |
<0.002 |
<0.005 |
<0.002 |
Percentage change was calcualted as (last data − first data) / last data × 100; the difference in data was calculated by subtracting first data from last data. Unless indicated otherwise, data are given as the mean±SD. ANOVA, analysis of variance; Group I, chronic cibenzoline therapy (CCT) ≥10 years; Group II, 5 years≤CCT<10 years; Group III, 1 year ≤CCT<5 years; IVS, interventricular septum; LV, left ventricular; LVLD, left ventricular long distance.
Cardiovascular Complications During the Follow-up Periods
Figure 4 shows the incidence of cardiac complications during CCT in the 3 groups. Statistical analyses indicated no significant differences in the incidence of cardiac complications among the 3 groups, with the exception of LV apical aneurysms, which were only observed in Group I. The incidence of AF was 9.6%, 5.9%, and 4.6% in Groups I, II, and III, respectively. Other cardiac complications included 1 patient with paroxysmal supraventricular tachycardia and 1 with LVHF in Group I; 1 patient with paroxysmal supraventricular tachycardia in Group II; and 1 patient with pacemaker implantation in Group III (Figure 4).
Figure 5 shows a representative LV apical aneurysm before cibenzoline therapy (Figure 5A), at end-diastole during CCT (Figure 5B), and at end-systole during CCT (Figure 5C) in a patient in Group I.
Discussion
In this study, the patients with HNCM were divided into 3 groups according to the duration of CCT and the extent of changes in LV remodeling were compared among these groups. After CCT, LV systolic function remained unchanged, mainly due to a reduction in LVH, in all groups. LVLD increased in all groups. The improvement in LVH and LVLD depended on the duration of follow-up. An improvement in the E/Ea ratio was also observed in Groups I and II. These results indicate that CCT aids in treating patients with HNCM.
LV Remodeling and LVHF in HCM
Thaman et al. reported that the LV remodeling process in patients with HCM was a time-related phenomenon; therefore, the death rate depended on the follow-up duration.16 Thus, in the present study, patients with HNCM were divided into 3 groups according to the duration of follow-up with CCT. Over a follow-up period of ≥15 years, LVHF usually occurs according to progression of LV remodeling in HCM.17,18 LVHF in HCM has been reported since approximately 30 years before.17,19
It has been reported that no intervention can stop the process from typical HCM to end-stage LVHF.20 Although septal reduction therapy has been performed for HCM,21 a recent study reported a rather controversial effect of septal reduction therapy on the progression of LV remodeling.22 In addition, a recent study reported that the progression of LV remodeling was prevented in patients with HOCM who were treated with CCT4 (as observed in the present study) and attributed the improvement in LV remodeling in those with HNCM to CCT.
LV Remodeling Due to Differences in the Duration of CCT
Among the cardiac indices, LV end-systolic dimension and fractional shortening in Group I were decreased after CCT, and these values after therapy were equal to those in Groups II and III. Therefore, these differences do not require further investigation.
However, unlike LV end-systolic dimension and fractional shortening, differences in 2 ECG indices and LVLD seemed to differ among groups. Specifically, the extent of the improvement of 2 ECG indices and LVLD after CCT was greater in Group I than in Groups II and III. These findings indicate that the regression of LVH depends on the follow-up length due to CCT.
ECG Changes Due to CCT
The SV1+RV5 and negative T wave values are known to be correlated with the severity of the LV mass, as well as with the incidence of cardiovascular events.23,24 In addition, an increase in LV mass is accompanied by progressive myocardial ischemia.25 Chronic myocardial ischemia appears to be associated with progressive myocardial cell death, resulting in LVHF in patients with HCM.26 However, the ECG values in this study were reduced by CCT in all groups. Thus, CCT improves LVH and myocardial ischemia. This improvement was greater in Group I than in Groups II and III.
Echocardiographic Changes Due to CCT
In this study, LVLD was measured to evaluate LVH at the LV apex. Most patients with HNCM have LVH at the LV apex. Therefore, many patients in this study had precordial negative T waves and high SV1+RV5, as shown in Figure 1. Thus, evaluation of LVH at the LV apex seems necessary in assessing changes in LV remodeling. In the present study, both intra- and interobserver measurement variability of LVLD were found to be minimal, suggesting the robustness of the methodology. After CCT, LVLD increased in all groups. In addition, the increase in LVLD was greater in Group I than in Groups II and III. This indicates that the improvement in LVLD depended on the duration of CCT.
The most important findings of echocardiographic evaluations in this study were the preservation of LV systolic function and the regression of LVH in all groups. LV fractional shortening in HNCM after CCT remained higher than in normal control subjects.27 High LV fractional shortening is likely primarily related to the low values of LV wall stress due to high LV wall thickness. Another reason may be low cardiac output owing to shortening of the LVLD due to LVH. To compensate for the low cardiac output, LV fractional shortening may remain high.
LV Diastolic Functions Associated With CCT
We have reported previously that CCT improves LV diastolic functions in patients with HOCM.4 However, in the present study, left atrial dimension and the E/A ratio remained unchanged after CCT. This difference may be related to the severity of LV diastolic dysfunction between HOCM and HNCM. In contrast to left atrial dimension and the E/A ratio, the E/Ea ratio decreased in Groups I and II in the present study. The E/Ea ratio can predict LV filling pressure in patients with HCM.14 Thus, an improvement in the E/Ea ratio may indicate decreased LV filling pressure in patients with HNCM.
Comparisons of LV Remodeling Between ECG and Echocardiography
In patients with LVH on ECG, echocardiographic LVH may often disappear or there may be an LV apical aneurysm, as shown in Figures 4 and 5. Thus, careful echocardiographic examination is necessary to evaluate changes in LV remodeling. In addition, unfortunately, ECG cannot evaluate changes in LV diastolic function.
Cardiac Complications During CCT
Diastolic dysfunction is one of the essential characteristics of patients with HCM. Thus, the incidence of AF should be carefully considered. Indeed, the incidence of AF in the present study ranged between 4% and 10% in the 3 groups. AF in HCM patients is a known predictor of thromboembolism.28 The occurrence of AF significantly increases the risk of a detrimental clinical course.29 Thus, in addition to the treatment of AF, administration of direct oral anticoagulants is necessary.
An LV apical aneurysm was observed in 6 patients in Group I, and identifying apical aneurysms is important, especially during long-term follow-up therapy. These 6 patients had no clinical symptoms. Because these apical aneurysms had been found during periodic examinations, all patients had received a direct oral anticoagulant to prevent thrombosis. None of the patients had an apical aneurysm at the start of cibenzoline therapy and the development of the aneurysm may reflect the delay in starting cibenzoline therapy. Thallium-201 myocardial scintigraphy indicates that myocardial injury in HCM is most frequent at the LV apex.30 This may be related to the information of apical aneurysm in HNCM.
Mechanisms Underlying the Effects of Cibenzoline on the LV
LV diastolic dysfunction and LVH in HCM are reported to be closely related to increases in intracellular Ca2+
concentrations ([Ca2+]i) in myocytes.31 It is also known that the cardiac Na+/Ca2+
exchanger plays an important role in maintaining [Ca2+]i
homeostasis32 and preventing Ca2+
overload.33 Cibenzoline has a strong Na+
channel-blocking effect, which results in decreased intracellular Na+
concentrations ([Na+]i) in myocytes, and subsequently affects myocyte depolarization. This may trigger activation of the cardiac Na+/Ca2+
exchanger to increase [Na+]i, thereby reducing [Ca2+]i. These actions may explain the decrease in LV fractional shortening during the acute phase of cibenzoline treatment.3
The decreased LV fractional shortening during the acute phase of treatment with cibenzoline returns to normal during the chronic phase of treatment, and appears to remain unchanged during the follow-up period.4 In patients treated with cibenzoline, [Ca2+]i
during the chronic phase of treatment may not be below [Ca2+]i
in normal control subjects. This action of cibenzoline may be responsible for the maintenance of LV fractional shortening and the regression of LVH.
Study Limitations
This study has some limitations. This study was conducted as a retrospective analysis, and we acknowledge that it is difficult to use a newly devised echocardiographic measurement without the help of cardiac magnetic resonance imaging (MRI) or cardiac computed tomography (CT). Therefore, we were unable to further validate the reliability of the newly proposed index, LVLD. Further prospective studies are needed to validate LVLD, ideally incorporating other imaging modalities, such as cardiac MRI or CT, to strengthen the evidence. Unfortunately, confirmation of improvements in LVLD requires a few years. In any case, future studies should consider evaluating the LV apex in patients with HCM.
Acknowledgments
The authors thank Editage (www.editage.jp) for English language editing a draft of this manuscript. The authors also thank Hiroyuki Iwasaki, medical technologist; Hiroko Yauchi-Kawakami, Masako Yamamoto (nurses); and Miki Naruta-Mohri, Hiromi Matsumoto, Chika Yamada, Hinako Hirano, Chihiro Motoyama, and Koyuki Oki (medical clerks) for their kind assistance.
Sources of Funding
This study did not receive any specific funding.
Disclosures
For the essence of this work, M.H. obtained a Japanese patent (Patent no. 6522845) from the Japan Patent Office on May 10, 2019. The remaining authors have no conflicts of interest to declare.
IRB Information
This study was approved by the human investigations committees of Ehime University Hospital (No. 14-25 in 2002) and Uwajima City Hospital (No. 24 in 2003).
References
- 1.
Maron MS, Olivotto I, Betocchi S, Casey SA, Lesser JR, Losi MA, et al. Effect of left ventricular outflow tract obstruction on clinical outcome in hypertrophic cardiomyopathy. N Engl J Med 2003; 348: 295–303, doi:10.1056/NEJMoa021332.
- 2.
Kitaoka H, Tsutsui H, Kubo T, Ide T, Chikamori T, Fukuda K, et al. JCS/JHFS 2018 guideline on the diagnosis and treatment of cardiomyopathies. Circ J 2021; 85: 1590–1689, doi:10.1253/circj.CJ-20-0910.
- 3.
Hamada M, Shigematsu Y, Ikeda S, Hara Y, Okayama H, Kodama K, et al. Class Ia antiarrhythmic drug cibenzoline: A new approach to the medical treatment of hypertrophic obstructive cardiomyopathy. Circulation 1997; 96: 1520–1524, doi:10.1161/01.CIR.96.5.1520.
- 4.
Hamada M, Shigematsu Y, Ikeda S, Ohshima K, Ogimoto A. Impact of cibenzoline treatment on left ventricular remodelling and prognosis in hypertrophic obstructive cardiomyopathy. ESC Heart Fail 2021; 8: 4832–4842, doi:10.1002/ehf2.13672.
- 5.
Kitaoka H, Ieda M, Ebato M, Kozuma K, Takayama M, Tanno K, et al. Phase 3 open-label study evaluating the efficacy and safety of mavacamten in Japanese adults with obstructive hypertrophic cardiomyopathy: The HORIZON-HCM study. Circ J 2025; 89: 130–138, doi:10.1253/circj.CJ-24-0501.
- 6.
Hamada M, Shigematsu Y, Hara Y, Suzuki M, Ikeda S, Ohtsuka T, et al. Antiarrhythmic drug, cibenzoline, can directly improve the left ventricular diastolic function in patients with hypertrophic cardiomyopathy. Jpn Circ J 2001; 65: 531–538, doi:10.1253/jcj.65.531.
- 7.
Hamada M, Aono J, Ikeda S, Watanabe K, Inaba S, Suzuki J, et al. Effect of intravenous administration of cibenzoline on left ventricular diastolic pressures in patients with hypertrophic cardiomyopathy: Its relationship to transmitral Doppler flow profiles. Circ J 2007; 71: 1540–1544, doi:10.1253/circj.71.1540.
- 8.
Richardson P, McKenna W, Bristow M, Maisch B, Mautner B, O’Connell J, et al. Report of the 1995 World Health Organization/International Society and Federation of Cardiology Task Force on the definition and classification of cardiomyopathies. Circulation 1996; 93: 841–842, doi:10.1161/01.cir.93.5.841.
- 9.
Topol EJ, Traill TA, Fortuin NJ. Hypertensive hypertrophic cardiomyopathy of the elderly. N Engl J Med 1985; 312: 277–283, doi:10.1056/NEJM198501313120504.
- 10.
Takada M, Fujita S, Katayama Y, Harano Y, Shibakawa M. The relationship between risk of hypoglycemiya and use of cibenzoline and disopyramide. Eur J Clin Pharmcol 2000; 56: 335–342, doi:10.1007/s002280000136.
- 11.
Khoo KC, Szuna AJ, Colburn WA, Aogaichi K, Morganroth J, Brazzel RK. Single-dose pharmacokinetics and dose proportionality of oral cibenzoline. J Clin Pharmacol 1984; 24: 283–288, doi:10.1002/j.1552-4604.1984.tb01834.x.
- 12.
Sokolow M, Lyon TP. The ventricular complex in left ventricular hypertrophy as obtained by unipolar precordial and limb leads. Am Heart J 1949; 37: 161–186, doi:10.1016/0002-8703(49)90562-1.
- 13.
Sahn DJ, DeMaria A, Kisslo J, Weyman A. Recommendations regarding quantitation in M-mode echocardiography: Results of a survey of echocardiographic measurements. Circulation 1978; 58: 1072–1083, doi:10.1161/01.cir.58.6.1072.
- 14.
Bryg RJ, Pearson AC, Williams GA, Labovitz AJ. Left ventricular systolic and diastolic flow abnormalities determined by Doppler echocardiography in obstructive hypertrophic cardiomyopathy. Am J Cardiol 1987; 59: 925–931, doi:10.1016/0002-9149(87)91127-1.
- 15.
Nagueh SF, Lakkis NM, Middleton KJ, Spencer WH 3rd, Zoghbi WZ, Quinones MA. Doppler estimation of left ventricular filling pressures in patients with hypertrophic cardiomyopathy. Circulation 1999; 99: 254–261, doi:10.1161/01.CIR.99.2.254.
- 16.
Thaman R, Gimeno JR, Reith RT, Esteban MTT, Limongelli G, Murphy RT, et al. Progressive left ventricular remodeling in patients with hypertrophic cardiomyopathy and severe left ventricular hypertrophy. J Am Coll Cardiol 2004; 44: 398–405, doi:10.1016/j.jacc.2004.01.054.
- 17.
Hamada M. From typical hypertrophic cardiomyopathy to dilated cardiomyopathy-like features. J Jpn Soc Intern Med 1993; 82: 188–193 [in Japanese], doi:10.2169/naika.82.188.
- 18.
Harris KM, Spirito P, Maron MS, Zenovich AG, Formisano F, Lesser JR, et al. Prevalence, clinical profile, and significance of left ventricular remodeling in the end-stage phase of hypertrophic cardiomyopathy. Circulation 2006; 114: 216–225, doi:10.1161/CIRCULATIONAHA.105.583500.
- 19.
Hamada M, Shigematsu Y, Kuwahara T, Hara Y, Kodama K, Hiwada K. Transition from typical hypertrophic cardiomyopathy to end-stage congestive heart failure: 12-year follow-up study in 210 patients. Circulation 1997; 96 (Suppl I): I-462–I-463.
- 20.
Maron BJ, Spirito P. Implications of left ventricular remodeling in hypertrophic cardiomyopathy. Am J Cardiol 1998; 81: 1339–1344, doi:10.1016/s0002-9149(98)00164-7.
- 21.
McIntosh CL, Maron BJ. Current operative treatment of obstructive hypertrophic cardiomyopathy. Circulation 1988; 78: 487–495, doi:10.1161/01.CIR.78.3.487.
- 22.
Marstrand P, Han L, Day SM, Olivotto L, Ashlev EA, Michels M, et al. Hypertrophic cardiomyopathy with left ventricular systolic dysfunction. Circulation 2020; 141: 1371–1383, doi:10.1161/CIRCULATIONAHA.119.044366.
- 23.
Ohtani T, Hamada M, Shigematsu Y, Sumimoto T, Hiwada K. Clinical significance of negative T wave on electrocardiogram in patients with essential hypertension: Its relation with left ventricular mass. Hypertens Res 1993; 16: 191–195, doi:10.1291/hypres.16.191.
- 24.
Sundström J, Lind L, Amlöv J, Zethelius B, Andrén B, Lithell HO. Echocardiographic and electrocardiographic diagnoses of left ventricular hypertrophy predict mortality independently of each other in a population of elderly men. Circulation 2001; 103: 2346–2351, doi:10.1161/01.cir.103.19.2346.
- 25.
Hamada M, Kuwahara T, Shigematsu Y, Kodama K, Hara Y, Hashida H, et al. Relation between coronary blood flow and left ventricular mass in hypertension: Noninvasive quantification of coronary blood flow by thallium-201 myocardial scintigraphy. Hypertens Res 1998; 21: 227–234, doi:10.1291/hypres.21.227.
- 26.
Maron MS, Olivotto I, Maron BJ, Prasad SK, Cecchi F, Udelson JE, et al. The case for myocardial ischemia in hypertrophic cardiomyopathy. J Am Coll Cardiol 2009; 54: 866–875, doi:10.1016/j.jacc.2009.04.072.
- 27.
Hamada M, Ogimoto A, Otani T, Ohshima K, Kono T, Watanabe Y, et al. Changes of left ventricular remodeling due to increased afterload in patients with essential hypertension. Int J Cardiol 2022; 367: 74–80, doi:10.1016/j.ijcard.2022.08.050.
- 28.
Tsuda T, Hayashi K, Kato T, Kusuyama T, Nakagawa Y, Nomura A, et al. Hypertrophic cardiomyopathy predicts thromboembolism and heart failure in patients with nonvalvular atrial fibrillation: A prospective analysis from the Hokuriku-Plus AF registry. Circ J 2023; 87: 1790–1797, doi:10.1253/circj.CJ-23-0418.
- 29.
Olivotto I, Cecchi F, Casey SA, Dolara A, Traverse JH, Maron BJ. Impact of atrial fibrillation on the clinical course of hypertrophic cardiomyopathy. Circulation 2001; 104: 2517–2524, doi:10.1161/hc4601.097997.
- 30.
Hamada M, Shigematsu Y, Nakata S, Kuwahara T, Ikeda S, Ohshima K, et al. Predicting the clinical course in hypertrophic cardiomyopathy using thallium-201 myocardial scintigraphy. ESC Heart Fail 2021; 8: 1378–1387, doi:10.1002/ehf2.13218.
- 31.
Gwathmey JK, Warren SE, Briggs GM, Copelas L, Feldman MD, Phillips PJ, et al. Diastolic dysfunction in hypertrophic cardiomyopathy: Effect on active force generation during systole. J Clin Invest 1991; 87: 1023–1031, doi:10.1172/JCI115061.
- 32.
Iwamoto T, Watanabe Y, Kita S, Blaustein MP. Na+/Ca2+ exchange inhibitors: A new class of calcium regulators. Cardiovasc Disord Drug Targets 2007; 7: 188–198, doi:10.2174/187152907781745288.
- 33.
Weber CR, Ginsburg KS, Philipson KD, Shannon TR, Bers DM. Allosteric regulation of Na/Ca exchange current by cytosolic Ca in intact cardiac myocytes. J Gen Physiol 2001; 117: 119–131, doi:10.1085/jgp.117.2.119.