Abstract
Background:
Ventricular dilation is known as a pivotal predictor in recent-onset cardiomyopathy (ROCM), but its pathophysiology is not fully understood. In the present study we investigated whether single-cell stiffness of right and left ventricular-derived fibroblasts has an effect on cardiac phenotype in patients with ROCM.
Methods and Results:
Patients with endomyocardial biopsy-proven ROCM were included (n=10). Primary cardiac fibroblasts (CFBs) were cultured from left and right ventricular endomyocardial biopsies and their single-cell stiffness was analyzed by quantification of Young’s modulus using colloidal probe atomic force microscopy. Cardiac fibrosis was analyzed by Masson’s trichrome staining. CFBs from the left ventricle showed significantly decreased stiffness when compared with CFBs from the right ventricle, indexed by decreased stiffness (Young’s modulus 3,374±389 vs. 4,837±690 Pa; P<0.05). Young’s modulus of CFBs derived from the left ventricle correlated negatively with the left ventricular end-diastolic dimension derived from 2-dimensional echocardiography (R2
=0.77; P<0.01). Neither left nor right ventricular fibrosis correlated with the respective ventricular dimensions.
Conclusions:
Our data suggest that a decrease in single-cell stiffness of left ventricular fibroblasts could trigger left ventricular dilation in patients with ROCM. This implies a new potential mechanism for the ventricular dilation with this disease.
Recent-onset cardiomyopathy (ROCM), described as nonischemic and nonvalvular ventricular dysfunction with cardiac symptoms of less than 6 months’ duration, is a relevant cause of heart failure and includes increased morbidity and mortality.1
Patients with ROCM show great variation in the clinical course, which ranges from sufficient myocardial recovery to end-stage heart failure and increased mortality.1
As previously published, the most predictive factor for cardiac recovery in patients with ROCM is increased left ventricular (LV) dilation.1
This subgroup (ie, those with dilated cardiomyopathy: DCM) constitutes the third most common type of heart failure and is the most frequent indication for heart transplantation.2
Etiological aspects of LV dilation in DCM are under intense current investigation.3–5
Among other factors, imbalance in the cardiac extracellular matrix (ECM) is believed to be a key pathogenic factor of ventricular chamber dilation in heart failure. This includes increased accumulation of collagens, disturbance in ECM-regulating factors such as metalloproteinases, and impaired cell-cell communication in the myocardium.6
Cardiac fibroblasts (CFBs) are the main source of ECM-regulating proteins.7
These cells constitute the most frequent population in the myocardium and are of mesenchymal origin.8
CFBs show a typical flat, spindle-shaped morphology with lack of the cell basement membrane. As well as the production of ECM-regulating proteins, CFBs play a relevant role in the following: cell-cell communication with cardiomyocytes; electrical activity; production of growth factors and cytokines; and intercellular communication with other CFBs and with endothelial and smooth muscle cells.6,9
In addition, CFBs have been shown to act also as inflammatory cells by producing a variety of cytokines (eg, tumor necrosis factor (TNF)-α).7
This variety of functions is believed to contribute to angiogenesis, myocardial hypertrophy, cell proliferation, apoptosis, and cardiac inflammation. There is a growing body of evidence that CFB dysfunction affects the cardiac phenotype of patients. For example, primary CFBs from patients with heart failure but normal ejection fraction (EF) produced more collagen after cytokine stimulation with transforming growth factor-β, which was associated with an accumulation of collagen in their endomyocardial biopsies (EMBs).10
Whereas activation, function, and cell-cell communication of CFBs have been incrementally investigated, the effect of single-cell stiffness in this cell population on the cardiac phenotype in human heart failure has not until now been studied. Because cell stiffness has been shown to affect noncardiac diseases,11
we analyzed single-cell stiffness of CFBs derived from the right and left ventricles of patients with ROCM. Our study used life-cell atomic force microscopy (AFM) and correlated Young’s modulus with parameters of cardiac performance.
Methods
Study Population
In total, we included 10 patients with ROCM who fulfilled the following inclusion criteria: (1) LV systolic dysfunction evaluated by 2-dimensional (2D) echocardiography (LVEF ≤45%); (2) exclusion of ischemic and valvular etiologies of the LV dysfunction, dilatation, or symptoms, by coronary angiography and 2D echocardiography, respectively; and (3) symptoms of heart failure for <6 months. Patients presenting with cardiogenic shock, acute decompensated heart failure, or atrial fibrillation were not included in this study. In all patients, myocardial biopsies from the right ventricular (RV) and LV septa were performed during routine diagnosis at first hospital admission. All patients gave informed and written consent.
Echocardiography
Echocardiography was performed as described previously12,13
(Supplementary File 1). LV and RV performance was analyzed by quantification of the LV end-diastolic dimension (LVEDD) and (biplane manner to Simpson’s methodology), RV end-diastolic dimension (RVEDD), systolic pulmonary arterial pressure (PAP), and tricuspid annular plane systolic excursion (TAPSE). All measurements were performed by 2D echocardiography according to the guidelines from the American College of Cardiology and the American Heart Association.14
EMBs
EMBs from the RV septum were performed as previously described12
(Supplementary File 1).
Histology
Total collagen content of the EMBs was analyzed in Masson’s trichrome-stained slides using the interactive program Quantuepatho as described previously.15
The percentage of stained area to total area was calculated to quantify cardiac fibrosis.
Cell Culture
Primary CFBs were isolated and cultured according to a previously published modified protocol10
(Supplementary File 1).
Young’s Modulus E of CFBs
Figure 2
is a representative example of a force map measurement performed on a single, living CFB. An optical micrograph of a CFB is compared with the lateral distribution of its height as determined by colloidal probe AFM. Although both methods derive their information from different approaches (optical interaction for the micrograph vs. mechanical interaction for the cell height), they lead to similar results for the shape of the cell and the position of the nucleus (black arrow in
Figures 2A,B). The nucleus coincides with the highest position of the CFB (usually between 2 and 5 µm in height), whereas the flattest parts of the CFB are found in the vicinity of the cell boundary (usually <1µm in height) that extends into the lamellipodia. This indicates that the CFB is well spread out on the surface, which is also visible in the optical micrograph.

Measuring force maps is advantageous because they contain information about cell height and cell elastic properties on local compression by the colloid probe (CP). For each pixel of the force map, a fit of the Hertz model to the corresponding force profile (as described) was performed to locally resolve the distribution of the cell’s Young’s modulus E (Figure 2C). Depending on the residual of the fit (Figure 2D), which is a measure of the reliability of the determined E, 3 cases must be distinguished.
1. The lowest residuals (blue pixels in
Figure 2D) are found at relatively thick parts of the cell (>1.5 µm), which also correspond to the softest part of the CFB. These force curves are very well described by the Hertz model, yielding a reliable value of E.
2. Thinner parts of the CFB (height <≈1.5 µm) usually lead to much larger residuals (light-blue to red pixels in
Figure 2D), indicating that the force curves are less well described by the Hertz model and that the Young’s modulus E is less precisely quantified by the fitting procedure.
3. At very thin parts of the CFB, the force profiles consist mainly of hard wall contact between the CP and supporting glass slide, superimposed by little or no contribution of cell deformation. Thus, the force curves contain almost no elastic information on the CFB. The corresponding pixels are omitted in
Figure 2
(white pixels) and were rejected from further analysis.
Such maps contain much information about CFB’s elastic properties, but their measurement is time-consuming, which limits the total number of CFBs that can be measured within the available time. We therefore investigated whether measuring Young’s modulus E at certain positions of the CFB would be representative for the full map. Because E exhibits the lowest scattering in the vicinity of the nucleus (an area that is also easily resolvable in optical micrographs), we compared the distribution of E measured across the whole CFB (Figure 2) with the E obtained under the condition that only force curves in the vicinity of the nucleus were taken into account (Figures 3A,B, respectively). A comparable result for the mean E is obtained in both approaches, despite the greatly reduced number of force curves in the latter case. Thus, measuring force curves in the vicinity of the nucleus is sufficient to obtain a reliable measure of CFB stiffness, which greatly decreases the number of measurements necessary to characterize a single CFB, and hence increases the number of CFBs that can be investigated within the available time.

Differences in Young’s modulus E between LV- and RV-derived CFBs were analyzed by a linear mixed model (random intercept/slope model) approach including patient ID, fibroblast ID, and measurement ID as random factors. Young’s modulus data were log-transformed. Normality of residuals was ensured by visually checking Q-Q and density plots. Homogeneity of variance was ensured by visually checking residuals vs. fitted plots. P-values were obtained by Wald chi squared test. Correlations between LVEDD/RVEDD and Young’s modulus, and LVEDD/RVEDD and fibrosis, were analyzed by univariate linear regression models. Normality of residuals was ensured by visually checking Q-Q and density plots. Homogeneity of variance was ensured by visually checking residuals vs. fitted plots. P-values were obtained on the basis of F-values. For additional correlation analyses, individual mean values of the LV and RV Young’s moduli for each patient were extracted from the linear mixed model. We analyzed relationships between LV and RV cell stiffness and LV and RV performance by using Pearson’s correlation tests. All statistical analyses were performed using R version 2.15.0 (R Development Core Team 2012) with the lme4 package (Bates 2005, Bates 2011) and the car package (Fox & Weisberg, 2011).
Results
Baseline Characteristics of the Patients
Table 1
shows the baseline characteristics of the patients at first hospital admission. Overall, they had reduced systolic LV function indexed by impaired LVEF (median 32.5, 26;40) and LV dilation indexed by increased LVEDD (median 62, 59;72). Patients received angiotensin-converting enzyme inhibitors, β-blockers, and aldosterone antagonists as medical heart failure therapy. One patient had mid-grade mitral valve regurgitation (2nd degree), 1 patient had mild mitral valve regurgitation (1st degree) and 1 patient had mild tricuspid valve regurgitation (1st degree). All patients were in sinus rhythm and were not paced.
Table 1.
Clinical Baseline Characteristics of the Patients With Recent-Onset Cardiomyopathy at First Hospital Admission
| Parameter |
[n=10] |
| Age [year] |
49.8 (41.2;72.0) |
| Female [n (%)] |
3 (30%) |
| Disease duration [days] |
51.5 (23.5;96.0) |
| Cardiovascular risk factors |
|
| Body mass index [kg/m2] |
31.2 (27.1;32.7) |
| Systolic blood pressure [mmHg] |
128.5 (121.5;145.0) |
| Diastolic blood pressure [mmHg] |
76.5 (65.0;90.0) |
| Current smoker [n (%)] |
4 (40%) |
| Diabetes mellitus [n (%)] |
2 (20%) |
| Arterial hypertension [n (%)] |
5 (50%) |
| ICD devices [n (%)] |
2 (20%) |
| Pacemaker devices [n (%)] |
1 (10%) |
| Medication (percent of maximum dose) |
|
| β-blocker [%] |
31.25 (25.0;48.75) |
| ACE inhibitors [%] |
87.5 (37.5;100.0) |
| Aldosterone antagonists [%] |
75.0 (37.5;150.0) |
| Hemodynamic parameters |
|
| LV ejection fraction [%] |
32.5 (26.0;40.0) |
| LV end-diastolic dimension [mm] |
62.0 (59.0;72.0) |
| TAPSE [mm] |
21.0 (18.0;23.5) |
| RV end-diastolic dimension [mm] |
33.0 (30.0;38.0) |
| Systolic pulmonal arterial pressure [mmHg] |
27.0 (25.0;30.0) |
| LV mass index [g/m2] |
121.5 (114.5;137.8) |
| e/E’ ratio |
11.0 (6.7;13.6) |
| Cardiac index [L·min–1·m–2] |
2.5 (2.3;2.8) |
| Pulmonary capillary wedge pressure [mmHg] |
9.5 (8.0;11.5) |
| Pulmonary artery mean pressure [mmHg] |
17.0 (13.3;19.0) |
| LV end-diastolic pressure [mmHg] |
13.5 (12.0;18.5) |
| RV end-diastolic pressure [mmHg] |
4.5 (3.3;5.8) |
Data are shown as median (1st, 3rd quartile).
ACE, angiotensin-converting enzyme; ICD, implantable cardioverter defibrillator; LV, left ventricular; RV, right ventricular; TAPSE, tricuspid annular plane systolic excursion.
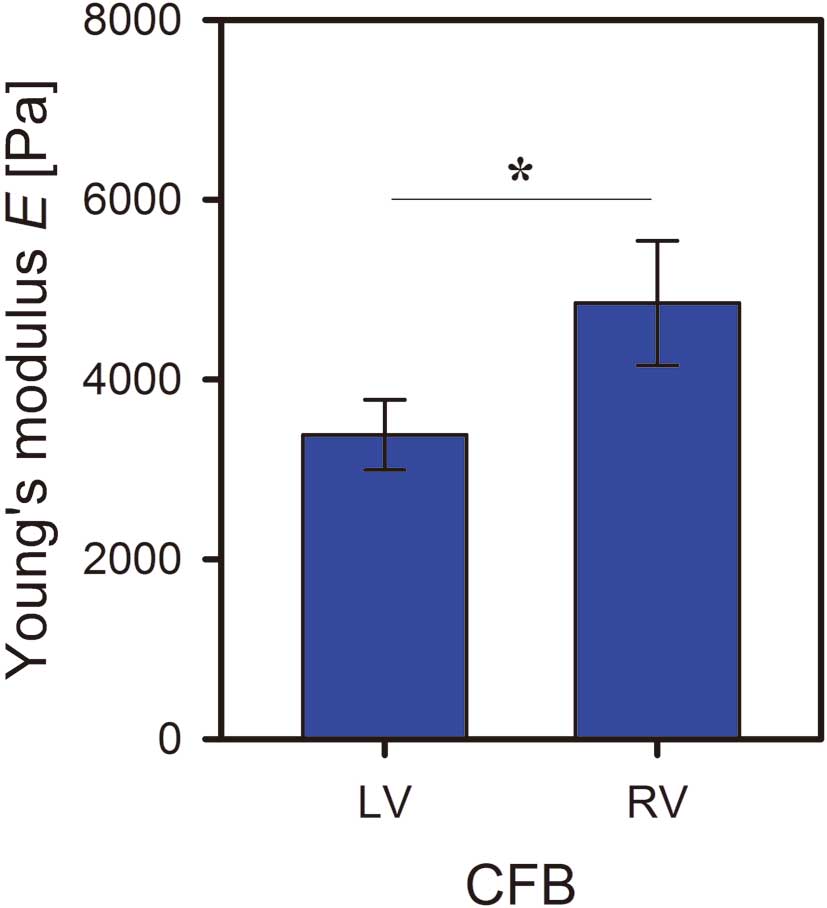
As shown in
Figure 4, CFBs derived from the LV showed significantly decreased cell stiffness when compared with CFBs derived from the RV as indexed by decreased Young’s modulus (3,383±390 Pa vs. 4,850±692 Pa; P=0.01, mean±standard error).
Correlations Between Cell Stiffness and Cardiac Performance
Linear regression analysis (Figure 5) showed that the Young’s moduli of CFBs derived from the LV correlated negatively with the LVEDD quantified during first hospital admission (LVEDD=81.934–0.005459×E; R2
=0.77; P=0.009). In contrast, the Young’s moduli of CFBs derived from the RV do not correlate with the RVEDD (R2
=0.12; P=0.37). There was a statistically significant correlation between the stiffness of RV and LV CFBs (R2
=0.98; P<0.001).
Table 2
shows the results of correlation analyses of RV and LV CFBs and the parameters of LV and RV performance. Stiffness of CFBs derived from the LV did not significantly correlate with LVEF (r=0.09; P=0.82), TAPSE (r=0.32; P=0.44), PAP (r=−0.50; P=0.17) or RVEDD (r=−0.33; P=0.38). In addition, stiffness of CFBs derived from the RV did not significantly correlate with TAPSE (r=0.29; P=0.48) or PAP (r=0.57; P=0.11).
Table 2.
Correlation Between Single-Cell Stiffness of Primary CFBs and Hemodynamic Parameters in Patients With Recent-Onset Cardiomyopathy
| Correlation |
r |
P value |
| LV CFB stiffness vs. LV ejection fraction |
0.09 |
0.82 |
| LV CFB stiffness vs. TAPSE |
0.32 |
0.44 |
| LV CFB stiffness vs. systolic pulmonal arterial pressure |
0.50 |
0.17 |
| LV CFB stiffness vs. RV end-diastolic dimension |
–0.33 |
0.38 |
| RV CFB stiffness vs. TAPSE |
0.29 |
0.48 |
| RV CFB stiffness vs. systolic pulmonal arterial pressure |
0.57 |
0.11 |
Correlation between Young’s moduli for primary CFBs of the left ventricle and the LV ejection fraction, TAPSE, systolic pulmonary arterial pressure, and RV end-diastolic dimension, as well as between Young’s moduli of primary cardiac fibroblasts from the right ventricle and the TAPSE and systolic pulmonary arterial pressure, were analyzed using the univariate linear regression model. There was no significant correlation between Young’s modulus and hemodynamic parameters.
CFB, cardiac fibroblast. Other abbreviations as in Table 1.
LV and RV fibrosis was quantified in Masson’s trichrome-stained EMBs. As shown in
Figure 6, LV fibrosis did not correlate with the LVEDD (R2
=0.36, P=0.15), nor did RV fibrosis correlate with the RVEDD (R2
=0.08, P=0.45).
Discussion
In the present study we determined the following new findings.
1. We quantified for the first time the single-cell stiffness of primary human CFBs using AFM.
2. We showed that CFBs derived from the LV were significantly less stiff than CFBs derived from the RV.
3. Single-cell stiffness of CFBs from the LV correlated significantly with LV dilation.
Both ventricular inflammation and fibrosis are at the focus of intense current investigations into heart failure, including LV dilation.15,16,19
However, in the present study we proved the hypothesis that impaired cardiac performance could not only be caused by biological and functional alterations, but could also result from abnormalities in the physical and structural characteristics of single cells. Such biophysical single-cell properties have been previously investigated, at least in part, in noncardiac diseases. For example, airway smooth muscle cells isolated from rats that were hyper-responsive to asthma showed greater cell stiffening responses to the contractile agonist, serotonin, when compared with cells from hyporesponsive rats.11
Cardiac fibrosis has been often observed in several types of cardiomyopathy. For example, in the experimental setting of viral myocarditis, this disease is strongly associated with increased cardiac content of collagens.21,22
This is also the case in experimental ischemic cardiomyopathy.23
In nonischemic cardiomyopathy, midwall myocardial fibrosis has been shown to be a major component of pathological remodeling, and to be a predictor of adverse outcome.24
Because there is a growing body of evidence suggesting that cardiac fibrosis is involved in LV dilation,25
we quantified the total collagen content of RV and LV EMBs. In contrast to our results on single-cell stiffness, the levels of both RV and LV fibrosis did not correlate with RV and LV dilation, respectively.
The presence of LV fibrosis, at least in some patients with heart failure, including cardiomyopathy, is well documented.31,32
In DCM, the presence of late gadolinium enhancement is a predictor for worsening outcome and associated with LV dilation indexed by LV end-diastolic volume.33
To the best of our knowledge, there are no data published to show that the extent of cardiac fibrosis correlates with LV dimensions, especially in ROCM. Our study showed no correlation between fibrosis and LVEDD. We can speculate that extent of cardiac fibrosis is more predictive for LV dilatation in the later stages of the disease and not in ROCM. Another explanation could be that the presence, but not the extent, of cardiac fibrosis might predict LV dilation. We measured total collagen content. In this regard, it could be that collagen subtypes correlate with LV dilation.
Current research on cardiac diseases focuses on molecular, microbiological, immunological, and pathological aspects rather than on the mechanical basis, which could make a direct contribution to cardiac performance. In the present study we were able to show that primary CFBs derived from RV and LV EMBs from patients with ROCM showed varying single-cell stiffness. Cells derived from the LV were significantly less stiff than cells from the RV. This is, to the best of our knowledge, the first time that the biomechanical properties of primary LV and RV human CFBs in a cardiac disease have been investigated.
Furthermore, we were interested in the clinical effect of our finding that LV CFBs were less stiff than RV CFBs. We therefore correlated the Young’s moduli of both cell populations with classical parameters of ventricular performance derived from 2D echocardiography. We found that the stiffness of LV-derived CFBs, but not of RV-derived CFBs, strongly negatively correlated with the LVEDD as the clinical gold standard parameter of LV dimensions. Our data suggest that less stiff CFBs in the LV myocardium could contribute to pathological dilation of the LV. This means that not only cell-cell contact (eg, fibroblast-fibroblast or fibroblast-myocyte), directly or indirectly through the ECM, but also cell membrane properties might contribute to LV dilation. This enlarges the current research, which mainly focuses on the ECM and the role of fibroblasts as matrix-regulating proteins. LV dilation as a trigger for a decrease in fibroblast stiffness might also be a possible mechanism to explain our findings. However, in the light of increased wall stress in dilated ventricles according to Laplace’s law, this mechanism seems unlikely.
ROCM typically involves the LV, but RV dysfunction and dilation may also be involved.17
Medical treatment of patients with heart failure and LV dysfunction by pharmacological inhibition of the renin-angiotensin-system (RAS) and of the β-adrenergic system has been shown to improve the outcome in a number of clinical trials.18
In contrast, although typical features such as myocardial fibrosis or hypertrophy are also present in RV dysfunction,19
the same medical strategy in a small randomized trial failed to show a substantial benefit for RV heart failure with regard to pharmacological RAS inhibition.20
No data from large controlled trials exist regarding the benefit of RAS or β-adrenergic inhibition for isolated right heart failure. However, current knowledge of the medical treatment of heart failure suggests that various underlying pathophysiological mechanisms are involved in alterations of LV and RV performance. In summary, we were able to show that single-cell stiffness of CFBs differs between the right and left ventricular myocardium in patients with ROCM. Single-cell stiffness from LV-derived CFBs strongly correlated negatively with LV dilation. We thus showed a new potential mechanism for LV dilation in ROCM.
Study Limitations
Our study includes several potential limitations. Owing to the invasiveness of EMBs, the study population was limited. However, despite the small sample size, we succeeded in demonstrating a highly statistically significant and strong correlation between single-cell stiffness and LV dilation in carefully characterized patients. In addition, there was no correlation regarding the RV and CFB stiffness, which might potentially have been influenced by the sample size. However, there was no indicator in the present data set for a significant correlation regarding the RV and CFB stiffness. Although we investigated ROCM patients, it is intriguing to speculate that a similar relationship might be observed under conditions of LV dilation as the hallmark for end-stage heart disease; for example, ischemic cardiomyopathy or mitral regurgitation. Further studies should investigate this. Finally, results from cultured cells in vitro cannot be directly transferred to the in vivo setting. However, until now, there has not been a valid technique available to analyze single-cell stiffness in cardiac tissue in vivo, especially from humans. Further studies are required to investigate the causality of decreased CFB stiffness and dilation in the LV in large patient cohorts.
Acknowledgments
This study was supported by the Deutsche Herzstiftung (F/01/10 to A.R.) and grants to ZIK-HIKE (FKZ 03Z2CN11, FKZ 03Z2CN12).
Disclosures
None of the authors has a conflict of interest to disclose.
Supplementary Files
Supplementary File 1
Material and Methods
Please find supplementary file(s);
http://dx.doi.org/10.1253/circj.CJ-13-1188
References
- 1.
McNamara DM, Starling RC, Cooper LT, Boehmer JP, Mather PJ, Janosko KM, et al.
Clinical and demographic predictors of outcomes in recent onset dilated cardiomyopathy results of the IMAC (Intervention in Myocarditis and Acute Cardiomyopathy)-2 study.
J Am Coll Cardiol
2011;
58:
1112–1118.
- 2.
Marchant DJ, Boyd JH, Lin DC, Granville DJ, Garmaroudi FS, Mcmanus BM.
Inflammation in myocardial diseases.
Circ Res
2012;
110:
126–144.
- 3.
Anzai T.
Post-infarction inflammation and left ventricular remodeling: A double-edged sword.
Circ J
2013;
77:
580–587.
- 4.
Choi JO, Kim EY, Lee GY, Lee SC, Park SW, Kim DK, et al.
Predictors of left ventricular reverse remodeling and subsequent outcome in nonischemic dilated cardiomyopathy.
Circ J
2013;
77:
462–469.
- 5.
Ogimoto A, Okayama H, Nagai T, Suzuki J, Inoue K, Nishimura K, et al.
Impact of synergistic polymorphisms in adrenergic receptor-related genes and cardiovascular events in patients with dilated cardiomyopathy.
Circ J
2012;
76:
2003–2008.
- 6.
Fan D, Takawale A, Lee J, Kassiri Z.
Cardiac fibroblasts, fibrosis and extracellular matrix remodeling in heart disease.
Fibrogenesis Tissue Repair
2012;
5:
15.
- 7.
Zeisberg EM, Kalluri R.
Origins of cardiac fibroblasts.
Circ Res
2010;
107:
1304–1312.
- 8.
Souders CA, Bowers SL, Baudino TA.
Cardiac fibroblast: The renaissance cell.
Circ Res
2009;
105:
1164–1176.
- 9.
Westermann D, Savvatis K, Lindner D, Zietsch C, Becher PM, Hammer E, et al.
Reduced degradation of the chemokine MCP-3 by matrix metalloproteinase-2 exacerbates myocardial inflammation in experimental viral cardiomyopathy.
Circulation
2011;
124:
2082–2093.
- 10.
Westermann D, Lindner D, Kasner M, Zietsch C, Savvatis K, Escher F, et al.
Cardiac inflammation contributes to changes in the extracellular matrix in patients with heart failure and normal ejection fraction.
Circ Heart Fail
2011;
4:
44–52.
- 11.
An SS, Fabry B, Trepat X, Wang N, Fredberg JJ.
Do biophysical properties of the airway smooth muscle in culture predict airway hyperresponsiveness?
Am J Respir Cell Mol Biol
2006;
35:
55–64.
- 12.
Riad A, Meyer zu Schwabedissen H, Weitmann K, Herda LR, Dorr M, Empen K, et al.
Variants of Toll-like receptor 4 predict cardiac recovery in patients with dilated cardiomyopathy.
J Biol Chem
2012;
287:
27236–27243.
- 13.
Herda LR, Trimpert C, Nauke U, Landsberger M, Hummel A, Beug D, et al.
Effects of immunoadsorption and subsequent immunoglobulin G substitution on cardiopulmonary exercise capacity in patients with dilated cardiomyopathy.
Am Heart J
2010;
159:
809–816.
- 14.
Cheitlin MD, Alpert JS, Armstrong WF, Aurigemma GP, Beller GA, Bierman FZ, et al.
ACC/AHA Guidelines for the Clinical Application of Echocardiography: A report of the American College of Cardiology/American Heart Association Task Force on Practice Guidelines (Committee on Clinical Application of Echocardiography)Echocardiography): Developed in collaboration with the American Society of Echocardiography.
Circulation
1997;
95:
1686–1744.
- 15.
Kindermann I, Kindermann M, Kandolf R, Klingel K, Bultmann B, Muller T, et al.
Predictors of outcome in patients with suspected myocarditis.
Circulation
2008;
118:
639–648.
- 16.
Yilmaz A, Kindermann I, Kindermann M, Mahfoud F, Ukena C, Athanasiadis A, et al.
Comparative evaluation of left and right ventricular endomyocardial biopsy: Differences in complication rate and diagnostic performance.
Circulation
2010;
122:
900–909.
- 17.
Maron BJ, Towbin JA, Thiene G, Antzelevitch C, Corrado D, Arnett D, et al.
Contemporary definitions and classification of the cardiomyopathies: An American Heart Association Scientific Statement from the Council on Clinical Cardiology, Heart Failure and Transplantation Committee; Quality of Care and Outcomes Research and Functional Genomics and Translational Biology Interdisciplinary Working Groups; and Council on Epidemiology and Prevention.
Circulation
2006;
113:
1807–1816.
- 18.
McMurray JJ, Adamopoulos S, Anker SD, Auricchio A, Bohm M, Dickstein K, et al.
ESC Guidelines for the diagnosis and treatment of acute and chronic heart failure 2012: The Task Force for the Diagnosis and Treatment of Acute and Chronic Heart Failure 2012 of the European Society of Cardiology. Developed in collaboration with the Heart Failure Association (HFA) of the ESC.
Eur Heart J
2012;
33:
1787–1847.
- 19.
Lubiszewska B, Gosiewska E, Hoffman P, Teresinska A, Rozanski J, Piotrowski W, et al.
Myocardial perfusion and function of the systemic right ventricle in patients after atrial switch procedure for complete transposition: Long-term follow-up.
J Am Coll Cardiol
2000;
36:
1365–1370.
- 20.
Therrien J, Provost Y, Harrison J, Connelly M, Kaemmerer H, Webb GD.
Effect of angiotensin receptor blockade on systemic right ventricular function and size: A small, randomized, placebo-controlled study.
Int J Cardiol
2008;
129:
187–192.
- 21.
Riad A, Westermann D, Escher F, Becher PM, Savvatis K, Lettau O, et al.
Myeloid differentiation factor-88 contributes to TLR9-mediated modulation of acute coxsackievirus B3-induced myocarditis in vivo.
Am J Physiol Heart Circ Physiol
2010;
298:
H2024–H2031.
- 22.
Riad A, Westermann D, Zietsch C, Savvatis K, Becher PM, Bereswill S, et al.
TRIF is a critical survival factor in viral cardiomyopathy.
J Immunol
2011;
186:
2561–2570.
- 23.
Riad A, Jager S, Sobirey M, Escher F, Yaulema-Riss A, Westermann D, et al.
Toll-like receptor-4 modulates survival by induction of left ventricular remodeling after myocardial infarction in mice.
J Immunol
2008;
180:
6954–6961.
- 24.
Lehrke S, Lossnitzer D, Schob M, Steen H, Merten C, Kemmling H, et al.
Use of cardiovascular magnetic resonance for risk stratification in chronic heart failure: Prognostic value of late gadolinium enhancement in patients with non-ischaemic dilated cardiomyopathy.
Heart
2011;
97:
727–732.
- 25.
Elnakish MT, Hassona MD, Alhaj MA, Moldovan L, Janssen PM, Khan M, et al.
Rac-induced left ventricular dilation in thyroxin-treated ZmRacD transgenic mice: Role of cardiomyocyte apoptosis and myocardial fibrosis.
PLoS One
2012;
7:
e42500, doi:10.1371/journal.pone.0042500.
- 26.
Schäfer A, Radmacher M.
Influence of myosin II activity on stiffness of fibroblast cells.
Acta Biomaterial
2005;
1:
273–280.
- 27.
Walter N, Busch T, Seufferlein T, Spatz JP.
Elastic moduli of living epithelial pancreatic cancer cells and their skeletonized keratin intermediate filament network.
Biointerphases
2011;
6:
79–85.
- 28.
Dimitriadis EK, Horkay F, Maresca J, Kachar B, Chadwick RS.
Determination of elastic moduli of thin layers of soft material using the atomic force microscope.
Biophys J
2002;
82:
2798–2810.
- 29.
Senden TJ.
Force microscopy and surface interactions.
Curr Opin Coll Interf Sci
2001;
6:
95–101.
- 30.
Butt HJ, Jaschke M.
Calculation of thermal noise in atomic force microscopy.
Nanotechnology
1995;
6:
1–7.
- 31.
Shah AM.
Ventricular remodeling in heart failure with preserved ejection fraction.
Curr Heart Fail Rep
2013;
10:
341–349.
- 32.
Burchfield JS, Xie M, Hill JA.
Pathological ventricular remodeling: Mechanisms: Part 1 of 2.
Circulation
2013;
128:
388–400.
- 33.
Assomull RG, Prassad SK, Lyne J, Smith G, Burman ED, Khan M, et al.
Cardiovascular magnetic resonance, fibrosis, and prognosis in dilated cardiomyopathy.
J Am Coll Cardiol
2006;
48:
1977–1985.