Abstract
Background:
Patients with hypertrophic cardiomyopathy (HCM) sometimes develop myocardial fibrosis in association with adverse cardiovascular events. Electrocardiography (ECG) could provide helpful information on myocardial fibrosis in HCM, as in coronary artery disease.
Methods and Results:
A total of 60 patients with HCM without bundle branch block underwent cardiac magnetic resonance imaging (CMR). The extent or location of late gadolinium enhancement (LGE) was examined in relation to 12-lead ECG. A notch on QRS was defined as at least 2 consecutive spikes in the same polarity with a reversal of direction ≥90° and the initial negative deflection ≥0.05 mV. LGE was associated with notched QRS, leftward QRS axis, and prolonged QRS duration, but not with any other findings such as abnormal Q waves, R-wave amplitude, or ST-T changes. Notched QRS was most useful in determining the presence or absence of myocardial fibrosis, with a sensitivity of 70% and a specificity of 81% using a cut-off of the number of leads with notched QRS ≥2. The number of notched QRS leads was positively correlated with LGE volume (P<0.01) and the lead distribution of notched QRS was informative about the location of LGE.
Conclusions:
A notch on QRS was useful in estimating myocardial fibrosis as assessed on CMR LGE in HCM patients without bundle branch block.
Patients with hypertrophic cardiomyopathy (HCM) often develop left ventricular (LV) myocardial fibrosis, which can be assessed non-invasively using late gadolinium enhancement (LGE) on cardiac magnetic resonance imaging (CMR).1,2
More recently, myocardial fibrosis as assessed using LGE has been reported to be associated with adverse cardiovascular events in patients with HCM.3–8
Electrocardiography (ECG) provides helpful information in terms of myocardial fibrosis in patients with coronary artery disease (CAD), but few data are available regarding the usefulness in patients with HCM. ECG could also be informative in myocardial fibrosis assessment (ie, initial risk stratification) in patients with HCM. The objective of the present study was to examine the relationship of ECG features with myocardial fibrosis as assessed using LGE CMR in patients with HCM.
Methods
Subjects
The present study consisted of consecutive patients with HCM who had undergone LGE CMR for an initial risk assessment at Matsushita Memorial Hospital, Osaka, from March 2010 to August 2013. The diagnosis of HCM was based on the conventional echocardiographic demonstration of maximum LV end-diastolic wall thickness ≥15 mm in the absence of any cardiac or systemic disorder that could cause hypertrophy, for example, severe hypertension (defined as blood pressure ≥160/100 mmHg) or aortic stenosis (defined as aortic valve area <1.5 cm2).8–10
A total of 72 patients with HCM met the inclusion criteria. Of these, 2 patients were excluded because of a previous history of myocardial infarction. We excluded 3 patients in whom CMR was discontinued because of possible side-effects of gadolinium, difficulty in holding their breath, or claustrophobia. Furthermore, we excluded 7 patients with right bundle branch block because of the interference of ECG assessment: none had left bundle branch block on 12-lead ECG. Ultimately, the present study consisted of 60 patients with HCM (43 men; mean age, 63 years). All patients were clinically stable; none of them had clinically significant valvular heart disease or renal dysfunction (defined as estimated glomerular filtration rate <60 ml·min–1·1.73 m–2). There were no patients treated with permanent mechanical device implantation, septal myectomy, alcohol septal ablation, or heart transplantation. CAD was ruled out in all patients on the basis of conventional coronary angiography, multidetector computed tomography, magnetic resonance angiography, or exercise myocardial perfusion scintigraphy. Informed consent for this study was obtained from all patients with HCM.
CMR
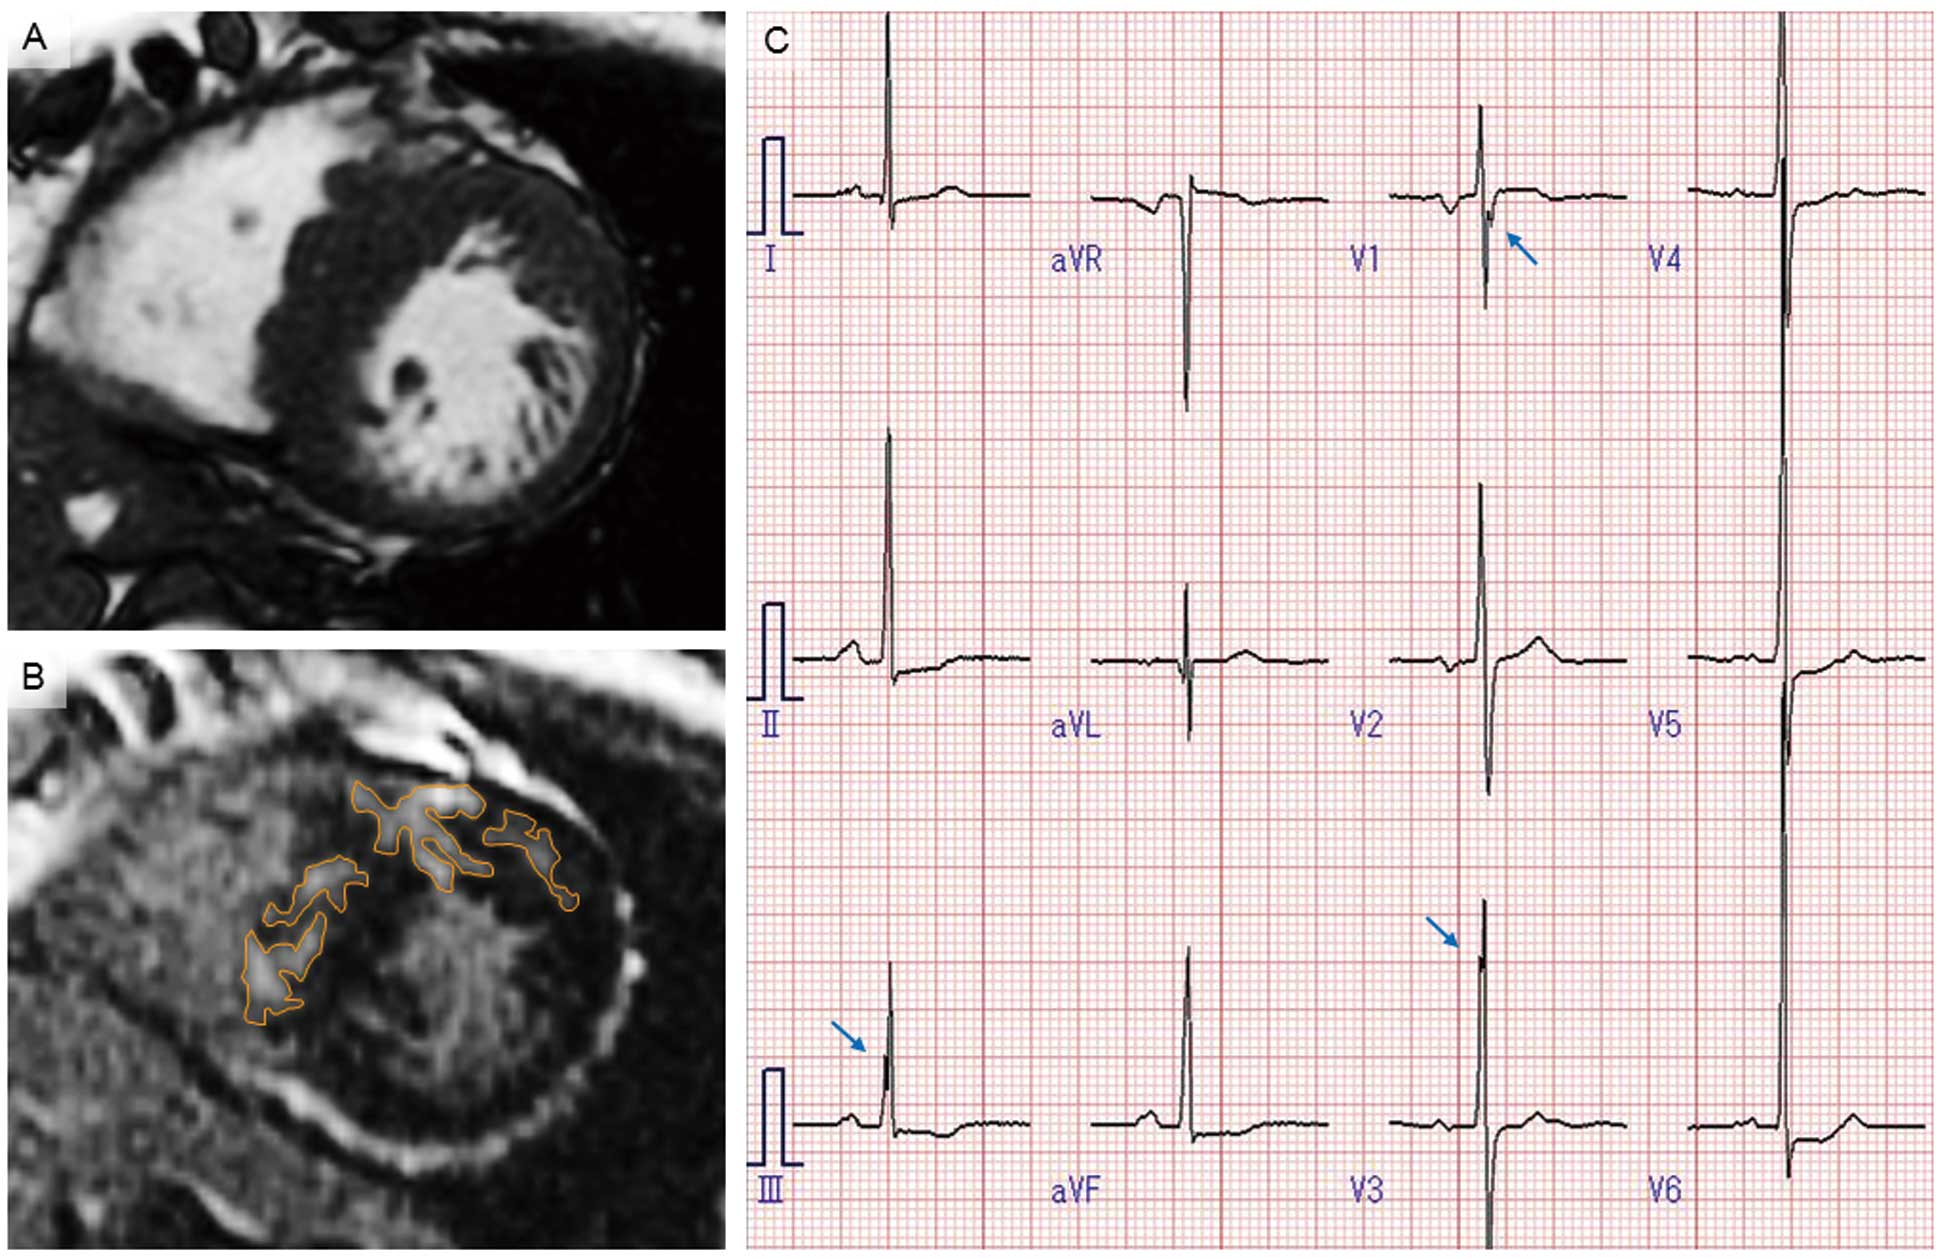
CMR was done with a 1.5-T imaging system (Signa HDx; General Electric Medical Systems, WI, USA;
Figure 1). Steady-state free procession of cine images was obtained in a long-axis view and short-axis views at basal, mid-, and apical LV levels (slice thickness, 7 mm; spacing, 5 mm; and field of view, 360 mm×360 mm).9–11
Approximately 10 min after i.v. injection of 0.1 mmol/kg gadopentetate dimeglumine (Magnevist; Schering, Berlin, Germany), LGE images were obtained in a long-axis view and in short-axis views at basal, mid-, and apical LV levels under serial breath-holds using a 2-D, spoiled, and segmented inversion recovery and gradient-echo sequence.9–11
Inversion time was selected using a standardized algorithm on the basis of myocardial and blood T1 values, heart rate, time of imaging from contrast injection, and dose of contrast. The following scan parameters were used: slice thickness, 7 mm; spacing, 5 mm; field of view, 270 mm×270 mm; flip angle, 20°; spatial resolution, 1.6 mm×2.3 mm; and number of averages, 2.
The endocardial and epicardial borders and maximum wall thickness of the LV were manually measured at the end-systolic phase of cine short-axis views using commercially available software (Plissimo Ex Version 1.0.4.5; Panasonic Medical Solutions, Osaka, Japan). LV mass was calculated from the total volume multiplied by 1.05 g/ml and indexed to height in cm.12
LGE was defined as 2 SD above the mean signal intensity of apparently normal myocardium.9–12
The extent of LGE was assessed according to the sum of enhanced areas on all short-axis images (LGE volume; expressed as g/cm) and the proportion of LV mass (%LGE, expressed as %).9,10,12
The location of LGE was determined on the basis of a 17-segment model of the LV, including 1 apex segment on a vertical long-axis view and 16 segments on 3 short-axis views.13
ECG
Standard 12-lead ECG was performed at rest in the supine position using a commercially available device (FCP-7431 or FCP-8800; Fukuda Denshi Tokyo, Japan; filter range, 0.05–150 Hz; AC filter off, muscle filter off, drift filter 0.5 Hz, 25 mm/s, 10 mm/mV). RR interval, QRS duration, QT interval, and corrected QT interval using Bazett’s formula14
were automatically measured. PQ interval was not calculated in patients with atrial fibrillation. QRS duration and QT interval were also measured manually at 2× magnification using a digital caliper (FEV-20, V04-49, Fukuda Denshi). A frontal plane QRS axis was classified into 4 groups: normal axis, –30 to +90°; right axis deviation, +90 to ±180°; left axis deviation, –30 to –90°; and extreme axis deviation, –90 to ±180°. Left atrial enlargement was considered present in patients with sinus rhythm when P terminal force in lead V1 or Morris index was >0.04 mm-s.15
Right bundle branch block was defined as QRS duration ≥120 ms, rSR’ in lead V1 or V2, and S waves in lead I and either lead V5 or V6; left bundle branch block was defined as QRS duration ≥120 ms, predominantly upright complexes with slurred R waves in leads I, V5, and V6, and QS or rS pattern in V1. In accordance with Sokolow-Lyon voltage criteria,16
the presence or absence of LV hypertrophy was determined in patients without left bundle branch block.
R-wave amplitude was summed separately in limb leads except aVR, in chest leads, and in all leads except aVR. Total number of leads except aVR was also calculated in terms of abnormal Q wave, ST-segment elevation, ST-segment depression, and T-wave inversion. Abnormal Q wave was defined as >40 ms and >25% of the R-wave amplitude; ST-segment elevation or depression was defined as >0.1 mV at 0.08 s after J point; T-wave inversion was defined as >0.1 mV in depth. We assessed notched QRS in all leads, which was defined as a wave with at least 2 consecutive spikes in the same polarity17
with a reversal of direction ≥90°;18
notched QRS with the initial negative deflection ≥0.05 mV was classified as deep-notched QRS (Figures 1C,2).18
Fragmented QRS was defined as the presence of various RSR’ patterns, such as >1 R’ or notching of the R wave or S wave, with QRS duration <120 ms on at least 2 contiguous leads representing anterior (V1–V5), lateral (I, aVL, V6), or inferior (II, III, aVF) myocardial segments.19

Echocardiography was performed with commercially available equipment (SONOS 5500; Philips Medical Systems, Best, the Netherlands, or Vivid 9, GE Healthcare, WI, USA) according to a standard method.20
LV end-diastolic diameter, LV ejection fraction, interventricular septum thickness, LV posterior wall thickness, left atrial end-systolic diameter, mitral valve E-wave peak velocity, septal mitral annular early peak velocity (E’) on tissue Doppler imaging, and the ratio of E wave to E’ wave were measured. LV outflow obstruction was considered present when the peak flow velocity was >2.5 m/s on the Doppler method under resting conditions or the Valsalva maneuver.
Statistical Analysis
Categorical variables were compared using Chi-squared test or Fisher’s exact test as appropriate. Continuous variables are expressed as mean±SD and were compared using Student’s t-test. LGE volume, %LGE, sum of R-wave amplitude, and total number of leads are expressed as mean±SD and were compared using Mann-Whitney U-test because of possibly skewed distributions. Spearman rank correlation coefficient was used to examine correlations between total number of leads with notched QRS, LGE volume, and %LGE. Receiver operating characteristic (ROC) analysis was applied to ECG variables associated with LGE, defined at P<0.05, to determine the optimal cut-off. These variables were also examined on multiple logistic regression analysis after adjustment for age and gender. The reproducibility of ECG findings was evaluated using mean absolute differences. Two-sided P<0.05 was considered statistically significant. All calculations were performed using SPSS version 11.0 (SPSS, Chicago, IL, USA) or StatView 5.0 (SAS Institute, Cary, NC, USA).
Results
LGE was detected in 23 of 60 patients (38%). LGE volume and %LGE ranged from 0.1 g/cm to 48.0 g/cm and from 0.2% to 30.7%, respectively. The location of LGE was ventricular septum in 18 patients, anterior wall in 8, apex in 8, inferior wall in 2, and lateral wall in 1. LGE was associated with younger age, higher maximum wall thickness, and higher LV mass (Table 1). Medications did not significantly differ between patients with and without LGE: calcium antagonists, 46% vs. 26% (P=0.12); angiotensin-converting enzyme inhibitors/angiotensin receptor blockers, 43% vs. 26% (P=0.18); β-blockers, 19% vs. 30% (P=0.31); or amiodarone, 0% vs. 9% (P=0.14).
Table 1.
Baseline Patient Characteristics
| |
LGE |
P-value |
| Negative (n=37) |
Positive (n=23) |
| Age (years) |
66±10 |
55±14 |
<0.01 |
| Men |
28 (76) |
15 (65) |
0.38 |
| NYHA functional class |
| I |
24 (65) |
10 (43) |
0.08 |
| II |
12 (32) |
9 (39) |
|
| III |
1 (3) |
4 (17) |
|
| Echocardiography |
| LV end-diastolic diameter (mm) |
44±7 |
46±6 |
0.30 |
| LVEF (%) |
64±10 |
60±10 |
0.14 |
| Interventricular septum thickness |
13±4 |
15±5 |
0.11 |
| LV posterior wall thickness |
10±4 |
10±4 |
0.59 |
| LAD (mm) |
36±7 |
39±8 |
0.09 |
| E (cm/s) |
70±18 |
77±19 |
0.19 |
| E/e’ |
9.9±5.1 |
11.1±6.8 |
0.44 |
| LVOTO |
3 (8) |
0 |
0.23 |
| CMR |
| Location of hypertrophy‡ |
| Ventricular septum |
28 (76) |
20 (87) |
0.24 |
| Anterior wall |
10 (27) |
10 (43) |
0.19 |
| Apical area |
12 (32) |
7 (30) |
0.87 |
| Lateral wall |
9 (24) |
5 (22) |
0.54 |
| Maximum wall thickness (mm) |
20±5 |
25±5 |
<0.01 |
| LV mass (g/cm) |
63±18 |
80±27 |
<0.01 |
| LGE volume (g/cm) |
0 |
7.7±9.9† |
– |
| %LGE (%) |
0 |
8.5±7.2† |
– |
Data given as mean±SD, n (%) or †mean±SE. ‡Some patients had ≥2 hypertrophic sites. CMR, cardiac magnetic resonance imaging; HCM, hypertrophic cardiomyopathy; LAD, left atrial diameter; LGE, late gadolinium enhancement; LV, left ventricle/ventricular; LVEF, left ventricular ejection fraction; LVOTO, left ventricular outflow tract obstruction; NYHA, New York Heart Association.
LGE was associated with longer QRS duration and lower QRS axis; left axis deviation was present only in patients with LGE (Table 2). In addition, LGE was associated with higher total number of leads with notched QRS and deep-notched QRS, but not with sum of R-wave amplitude or total number of leads with ST-segment elevation, ST-segment depression, and T-wave inversion. The total number of leads with abnormal Q wave was higher in patients with LGE than in those without it, with the difference being just above the significance threshold (P=0.06). There was no significant difference in the findings of lead aVR or the incidence of fragmented QRS between the 2 groups. The longest QRS duration and maximum QT interval measured manually were 95±11 ms and 403±41 ms in patients without LGE, and 103±11 ms (P<0.01) and 421±48 ms (P=0.15) in patients with LGE, respectively.
Table 2.
Standard 12-Lead ECG Findings
| |
LGE |
P-value |
| Negative (n=37) |
Positive (n=23) |
| Basic parameters |
| RR interval (ms) |
885±147 |
888±117 |
0.94 |
| PQ interval (ms)† |
168±23 |
168±30 |
0.99 |
| QRS duration (ms) |
101±9 |
108±15 |
0.02 |
| QRS axis deviation ( ˚ ) |
37±31 |
7±49 |
<0.01 |
| Normal axis |
37 (100) |
17 (74) |
|
| Left axis deviation |
0 |
6 (26) |
|
| Right axis deviation |
0 |
0 |
|
| Extreme axis deviation |
0 |
0 |
|
| QT interval (ms) |
402±30 |
399±32 |
0.75 |
| Corrected QT interval |
422±36 |
424±26 |
0.92 |
| Atrial fibrillation |
1 (3) |
4 (17) |
0.07 |
| Left atrial enlargement† |
2 (5) |
2 (9) |
0.63 |
| LV hypertrophy |
24 (65) |
14 (61) |
0.75 |
| Sum of R-wave amplitude (mV) |
| Limb leads |
4.9±2.9 |
4.6±2.4 |
0.95 |
| Chest leads |
10.6±5.6 |
9.0±5.8 |
0.29 |
| All leads |
15.5±8.1 |
13.6±7.7 |
0.38 |
| Total number of leads |
| Abnormal Q wave |
0.3±0.9 |
0.8±1.4 |
0.06 |
| ST-segment elevation |
1.6±1.3 |
1.7±1.5 |
0.78 |
| ST-segment depression |
1.2±1.9 |
1.9±2.3 |
0.20 |
| T-wave inversion |
3.5±2.8 |
4.3±2.1 |
0.17 |
| Notched QRS |
1.8±1.5 |
2.7±1.8 |
0.04 |
| Deep-notched QRS |
1.3±1.3 |
2.2±1.5 |
0.01 |
| Lead aVR |
| Q-wave amplitude (mV) |
1.0±0.5 |
0.9±0.6 |
0.39 |
| Notched QRS |
3 (8) |
4 (17) |
0.25 |
| Deep-notched QRS |
1 (3) |
1 (4) |
0.62 |
| Fragmented QRS |
11 (30) |
11 (49) |
0.13 |
Data given as mean±SD or n (%). †Patients with atrial fibrillation were excluded. ECG, electrocardiography. Other abbreviations as in Table 1.
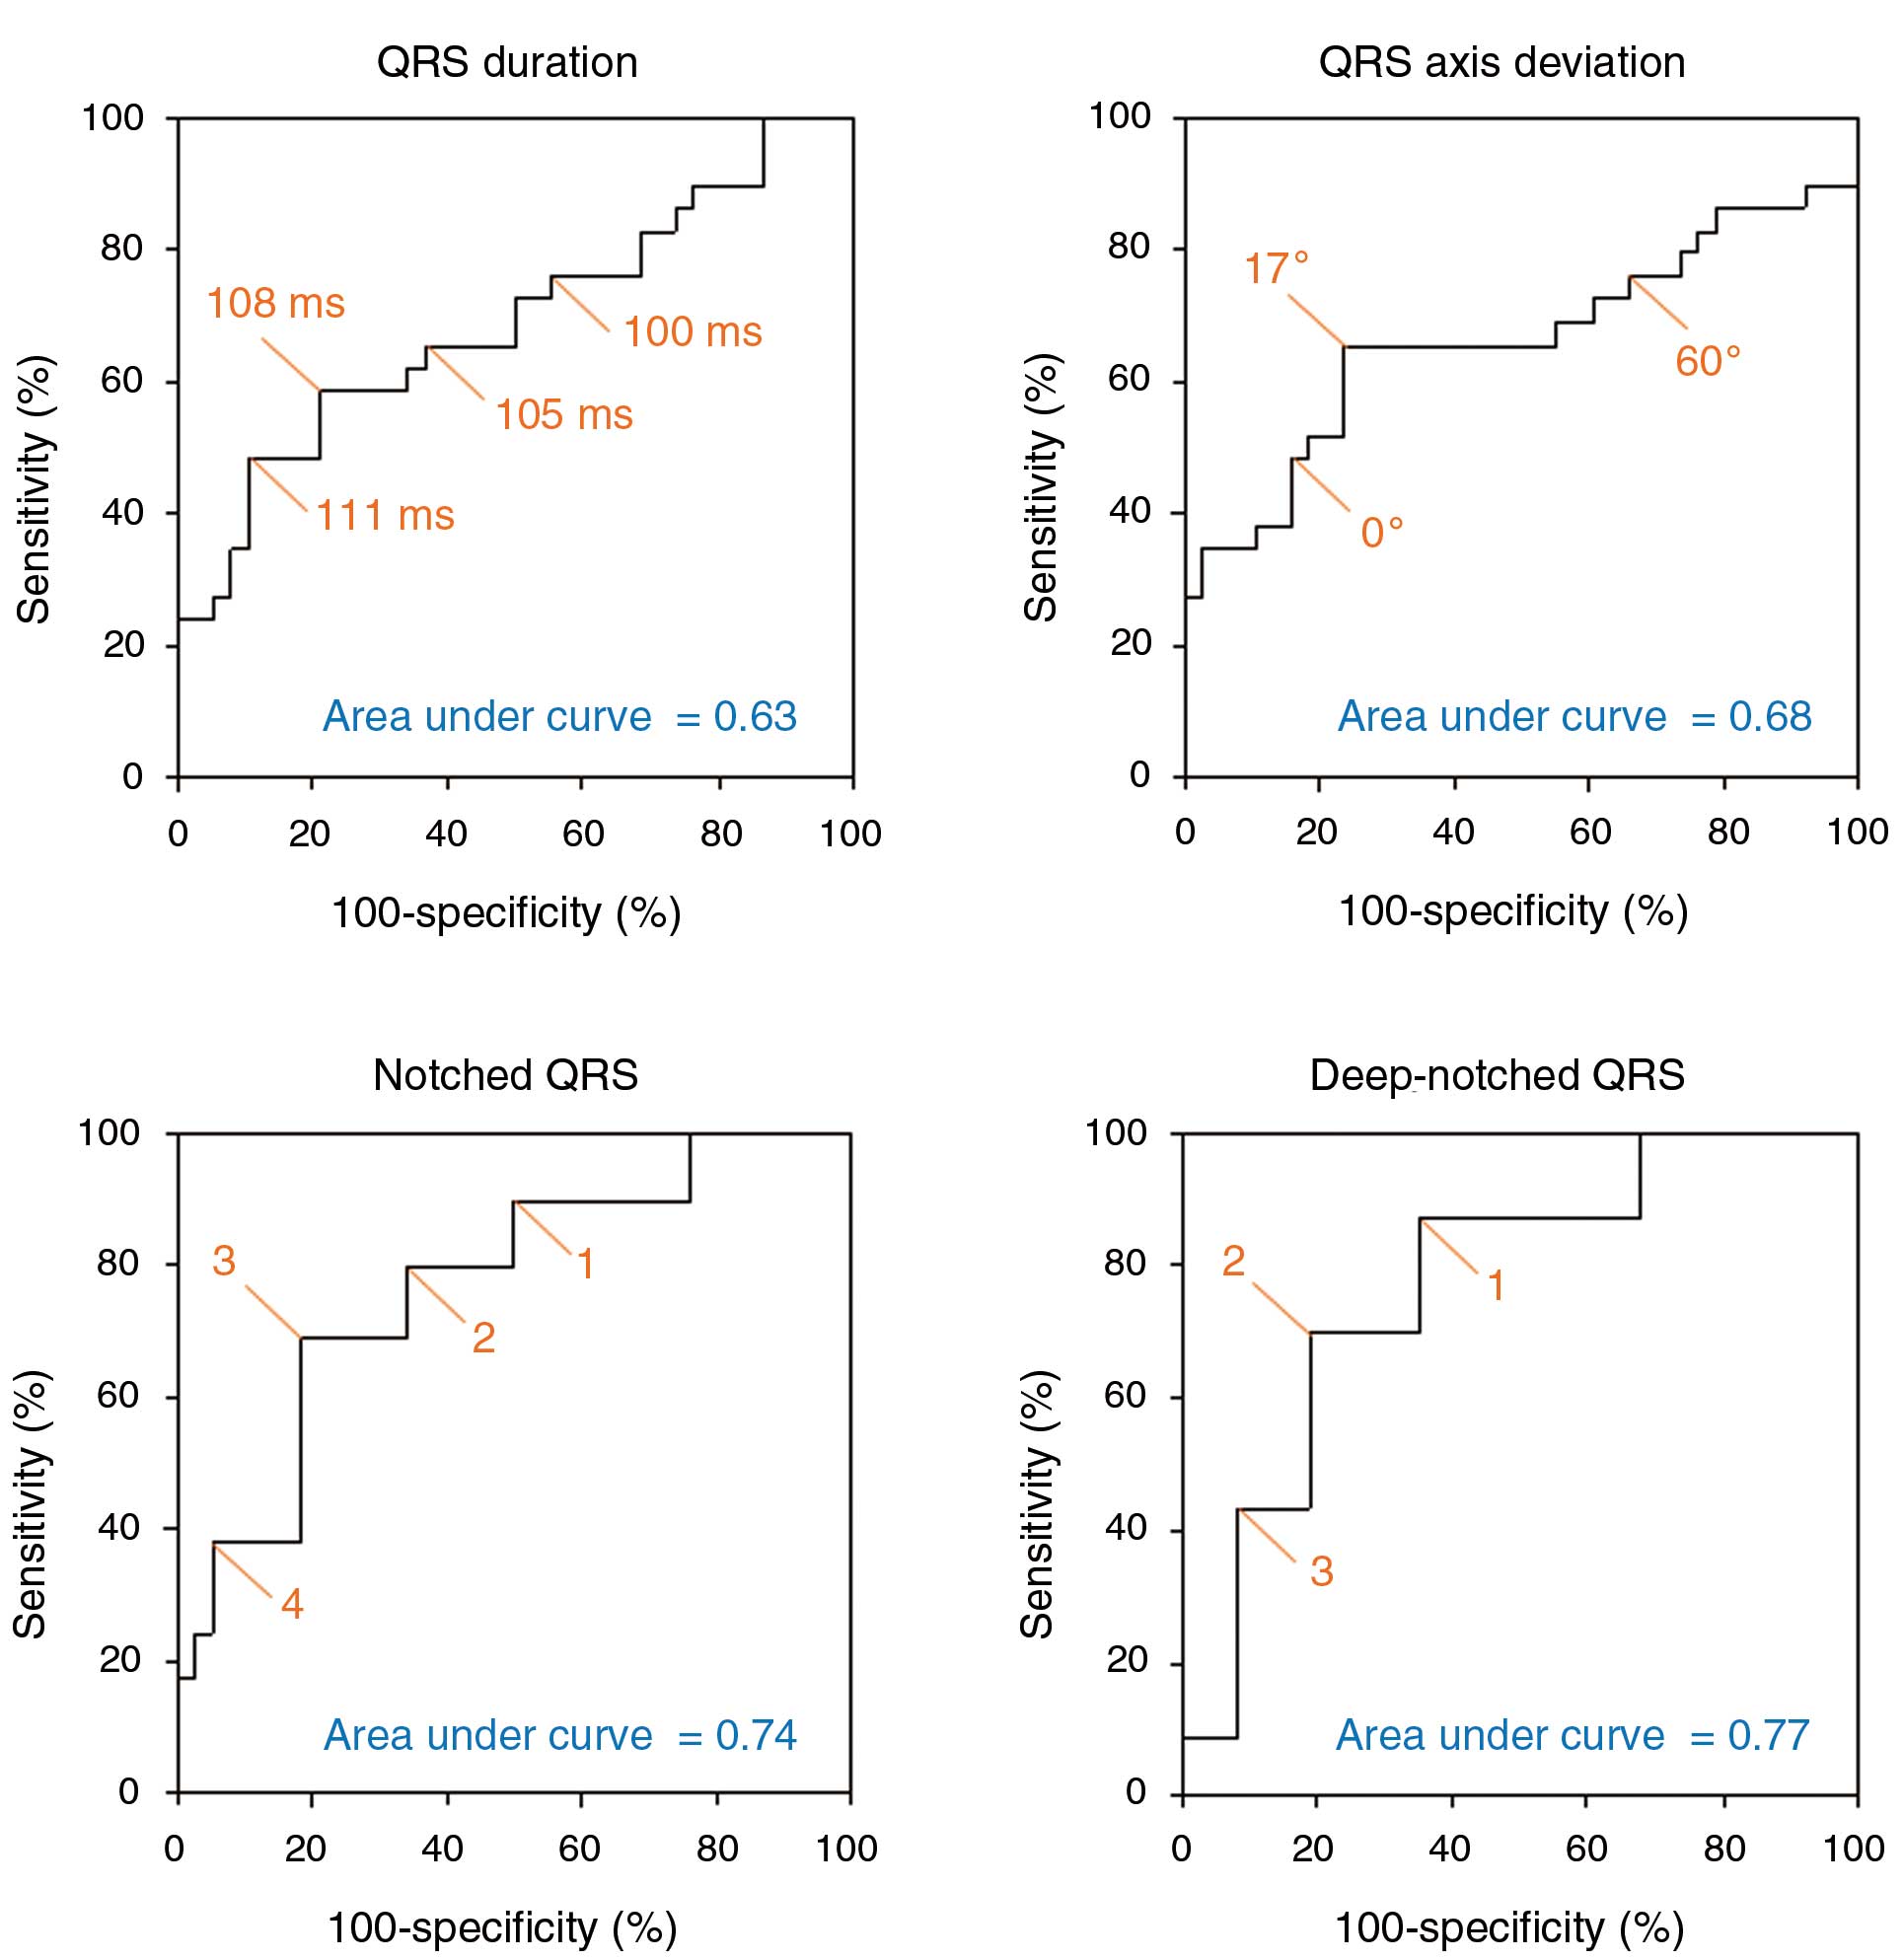
On ROC analysis for the detection of LGE, the optimal cut-off of QRS duration was ≥108 ms, QRS axis deviation ≤17°, or total number of leads with notched QRS ≥3 and that with deep-notched QRS ≥2, with the area under the curve being highest for total number of leads with deep-notched QRS (Figure 3). On multiple logistic regression analysis after adjustment for age and gender, the independent predictors for LGE included number of leads with deep-notched QRS ≥2 (OR, 24.8; 95% CI: 2.9–211.9; P<0.01) and QRS axis deviation ≤17° (OR, 22.6; 95% CI: 2.5–203.8; P=0.01). The diagnostic value of number of leads with deep-notched QRS ≥2 for the detection of LGE was good, with sensitivity 70%, specificity 81%, accuracy 77%, positive predictive value (PPV) 70%, and negative predictive value (NPV) 80%. The diagnostic value of the presence of left axis deviation of QRS was highly specific for the detection of LGE, with sensitivity 26%, specificity 100%, accuracy 72%, PPV 100%, and NPV 69%.
Total number of leads with deep-notched QRS was correlated with LGE volume and %LGE (correlation coefficient, 0.44; P<0.01 in both).
Table 3
shows the relationship between the locations of LGE and leads with deep-notched QRS. The presence of deep-notched QRS in lead II, III, or aVF was associated with a high incidence of LGE in the inferior wall of the LV (100%) and the ventricular septum (67%), whereas deep-notched QRS in leads V1–V4 was observed predominantly in the apical area (88%) and the anterior wall (75%).
Table 3.
LGE Location and Leads With Deep-Notched QRS
| |
Lead |
| II, III, aVF |
V1–V4 |
I, aVL, V5, V6 |
aVR |
| Ventricular septum (n=18) |
12 (67) |
9 (50) |
7 (39) |
4 (22) |
| Anterior wall (n=8) |
4 (50) |
6 (75) |
4 (50) |
2 (25) |
| Apical area (n=8) |
3 (38) |
7 (88) |
4 (50) |
1 (13) |
| Inferior wall (n=2) |
2 (100) |
1 (50) |
1 (50) |
1 (50) |
| Lateral wall (n=1) |
0 |
0 |
0 |
0 |
Data given as n (%). Abbreviations as in Table 1.
The reproducibility of ECG findings was evaluated in a total of 20 randomly selected patients with HCM. Interobserver and intraobserver variability of the number of leads with deep-notched QRS were small, with absolute differences of 0.4±0.7 and 0.5±0.7, respectively. Of the 20 patients, 7 were diagnosed as having LGE on CMR. Interobserver and intraobserver variability did not lead to any change in the classification according to the cut-off of the number of leads with deep-notched QRS ≥2, except in 1 patient in whom the interobserver and intraobserver differences were both 1.
Follow-up ECG was available in all of the 20 patients during a mean interval of 17 months (range, 5–34 months). Interobserver and intraobserver variability of the number of leads with deep-notched QRS was small, with absolute differences of 0.4±0.7 and 0.5±0.7, respectively. The interobserver and intraobserver variability did not lead to any change in the classification according to the cut-off of the number of leads with deep-notched QRS ≥2, except in 1 patient in whom the interobserver and intraobserver differences in the numbers were both 1. No patient developed right or left bundle branch block. Absolute differences in automatically measured QRS duration and QRS axis were 0.3±4.2 ms and 0.4±10.0°, respectively. Three patients had a left axis deviation at both the initial and follow-up examinations, in 2 of whom LGE was observed; 2 developed a left axis deviation (ie, from –27 to –33° and from –19 to –33°), and 1 of them had LGE.
Discussion
The present study has shown that 12-lead ECG features including notched or deep-notched QRS, lower QRS axis or left axis deviation, and prolonged QRS duration are associated with myocardial fibrosis as assessed on LGE CMR in patients with HCM. Of these, deep-notched QRS was most useful not only in determining the presence or absence of myocardial fibrosis but also in assessing the extent and location of myocardial fibrosis in patients with HCM.
A close relationship between deep-notched QRS and myocardial fibrosis was observed in HCM patients who had no bundle branch block. This finding is not surprising because the presence of a notch on the QRS complex without bundle branch block would imply non-smooth conduction due to myocardial fibrosis.21,22
Furthermore, it seems intuitive that the number and the site of leads with notched QRS were associated with the extent and location of myocardial fibrosis in the present HCM patients because a QRS complex is a direct marker of conduction in myocardial segments corresponding to the lead.21,22
Since cardiovascular events have been reported to be associated with the presence of LGE3,5
and to increase in proportion to the extent of LGE in patients with HCM,4
the present findings indicate that notched QRS could be useful for risk stratification of selected HCM patients. Given its simplicity, cost-effectiveness, and lack of complications, as compared with CMR, notched QRS may be an indicator of the requirement for further examination. Prospective studies are also warranted to examine the relationship of notched QRS with prognosis in patients with HCM.
The present study also showed that lower QRS axis or left axis deviation was diagnostic of myocardial fibrosis, although the diagnostic value was lower than that of notched QRS except for the specificity and PPV. The mechanism linking myocardial fibrosis with a frontal plane QRS axis remains unclear, but the indirect effect of myocardial fibrosis on the QRS axis may be proposed. In the present study, LGE was mainly located in the ventricular septum (ie, 78%). It seems likely that delayed anterior fascicular conduction due to myocardial fibrosis in the ventricular septum results in a leftward shift of the frontal QRS axis.23
The same explanation may be applied to prolonged QRS duration as a marker for the detection of myocardial fibrosis because left anterior hemiblock could cause an increase in QRS duration of 10–20 ms.24
Abnormal Q wave or fragmented QRS is considered to be a good marker of myocardial fibrosis in patients with CAD,19,25
but neither was significantly associated with myocardial fibrosis in the present study. This may be explained by the difference in myocardial fibrosis between CAD and HCM patients. Myocardial fibrosis of HCM has been reported to be not transmural but predominant in the midwall layer.26,27
There were some limitations to the present study. It was conducted in a single center and the patients were highly selected, indicating that it may not be possible to extrapolate the present findings to the general HCM population. The assessment of notched QRS or deep-notched QRS could be uncertain, but we strictly and objectively defined notched QRS, and the reproducibility of the diagnosis was good. No pathological findings were available in the present patients, but LGE on CMR has been established as a reliable method for the non-invasive assessment of myocardial fibrosis.28
The association of notched QRS with other clinical findings, such as arrhythmia or reduced contractility, remains to be elucidated.
Conclusions
Notch on QRS was a good marker for the detection of myocardial fibrosis as assessed on LGE CMR in HCM patients without bundle branch block. Furthermore, the number or site of leads with deep-notched QRS was useful in assessing the extent or location of myocardial fibrosis.
Disclosures
Conflict of Interest: None declared.
References
- 1.
Moon JC, Reed E, Sheppard MN, Elkington AG, Ho SY, Burke M, et al. The histologic basis of late gadolinium enhancement cardiovascular magnetic resonance in hypertrophic cardiomyopathy. J Am Coll Cardiol 2004; 43: 2260–2264.
- 2.
Maron MS, Olivotto I, Maron BJ, Prasad SK, Cecchi F, Udelson JE, et al. The case for myocardial ischemia in hypertrophic cardiomyopathy. J Am Coll Cardiol 2009; 54: 866–875.
- 3.
Rubinshtein R, Glockner JF, Ommen SR, Araoz PA, Ackerman MJ, Sorajja P, et al. Characteristics and clinical significance of late gadolinium enhancement by contrast-enhanced magnetic resonance imaging in patients with hypertrophic cardiomyopathy. Circ Heart Fail 2010; 3: 51–58.
- 4.
O’Hanlon R, Grasso A, Roughton M, Moon JC, Clark S, Wage R, et al. Prognostic significance of myocardial fibrosis in hypertrophic cardiomyopathy. J Am Coll Cardiol 2010; 56: 867–874.
- 5.
Bruder O, Wagner A, Jensen CJ, Schneider S, Ong P, Kispert EM, et al. Myocardial scar visualized by cardiovascular magnetic resonance imaging predicts major adverse events in patients with hypertrophic cardiomyopathy. J Am Coll Cardiol 2010; 56: 875–887.
- 6.
Green JJ, Berger JS, Kramer CM, Salerno M. Prognostic value of late gadolinium enhancement in clinical outcomes for hypertrophic cardiomyopathy. JACC Cardiovasc Imaging 2012; 5: 370–377.
- 7.
Sakuma H. Late gadolinium enhancement and prognosis of hypertrophic cardiomyopathy. Circ J 2014; 78: 832–834.
- 8.
Hen Y, Iguchi N, Utanohara Y, Takada K, Machida H, Takayama M, et al. Prognostic value of late gadolinium enhancement on cardiac magnetic resonance imaging in Japanese hypertrophic cardiomyopathy patients. Circ J 2014; 78: 929–937.
- 9.
Kawasaki T, Sakai C, Harimoto K, Yamano M, Miki S, Kamitani T. Usefulness of high-sensitivity cardiac troponin T and brain natriuretic peptide as biomarkers of myocardial fibrosis in patients with hypertrophic cardiomyopathy. Am J Cardiol 2013; 112: 867–872.
- 10.
Harimoto K, Kawasaki T, Honda S, Miki S, Kamitani T. Right bundle branch block and ventricular septal fibrosis in patients with hypertrophic cardiomyopathy. J Electrocardiol 2014; 47: 636–641.
- 11.
Ho CY, López B, Coelho-Filho OR, Lakdawala NK, Cirino AL, Jarolim P, et al. Myocardial fibrosis as an early manifestation of hypertrophic cardiomyopathy. N Engl J Med 2010; 363: 552–563.
- 12.
Rudolph A, Abdel-Aty H, Bohl S, Boyé P, Zagrosek A, Dietz R, et al. Noninvasive detection of fibrosis applying contrast-enhanced cardiac magnetic resonance in different forms of left ventricular hypertrophy relation to remodeling. J Am Coll Cardiol 2009; 5: 284–291.
- 13.
Cerqueira MD, Weissman NJ, Dilsizian V, Jacobs AK, Kaul S, Laskey WK, et al; American Heart Association Writing Group on Myocardial Segmentation and Registration for Cardiac Imaging. Standardized myocardial segmentation and nomenclature for tomographic imaging of the heart: A statement for healthcare professionals from the Cardiac Imaging Committee of the Council on Clinical Cardiology of the American Heart Association. Circulation 2002; 105: 539–542.
- 14.
Bazett HC. An analysis of the time-relations of electrocardiograms. Heart 1920; 7: 353–370.
- 15.
Morris JJ Jr, Estes EH Jr, Whalen RE, Thompson HK Jr, McIntosh HD. P-wave analysis in valvular heart disease. Circulation 1964; 29: 242–252.
- 16.
Sokolow M, Lyon TP. The ventricular complex in left ventricular hypertrophy as obtained by unipolar precordial and limb leads. Am Heart J 1949; 37: 161–186.
- 17.
Fonseca-Guzman AM, Climent AM, Millet J, Berne P, Brugada J, Ramos R, et al. Fragmentation in body surface potential mapping recordings from patients with Brugada syndrome. Comput Cardiol 2011; 38: 637–640.
- 18.
Loring Z, Chelliah S, Selvester RH, Wagner G, Strauss DG. A detailed guide for quantification of myocardial scar with the Selvester QRS score in the presence of electrocardiogram confounders. J Electrocardiol 2011; 44: 544–554.
- 19.
Das MK, Khan B, Jacob S, Kumar A, Mahenthiran J. Significance of a fragmented QRS complex versus a Q wave in patients with coronary artery disease. Circulation 2006; 113: 2495–2501.
- 20.
Lang RM, Bierig M, Devereux RB, Flachskampf FA, Foster E, Pellikka PA, et al; Chamber Quantification Writing Group; American Society of Echocardiography’s Guidelines and Standards Committee; European Association of Echocardiography. Recommendations for chamber quantification: A report from the American Society of Echocardiography’s Guidelines and Standards Committee and the Chamber Quantification Writing Group, developed in conjunction with the European Association of Echocardiography, a branch of the European Society of Cardiology. J Am Soc Echocardiogr 2005; 18: 1440–1463.
- 21.
Take Y, Morita H. Fragmented QRS: What is the meaning? Indian Pacing Electrophysiol J 2012; 12: 213–225.
- 22.
Surawicz B, Knilans T. Chou’s electrocardiography in clinical practice. Philadelphia: Elsevier, 2008.
- 23.
Perloff JK, Roberts NK, Cabeen WR Jr. Left axis deviation: A reassessment. Circulation 1979; 60: 12–21.
- 24.
Rosenbaum MB, Elizari MV, Levi RJ, Nau GJ, Pisani N, Lázzari JO, et al. Five cases of intermittent left anterior hemiblock. Am J Cardiol 1969; 24: 1–7.
- 25.
Das MK, Suradi H, Maskoun W, Michael MA, Shen C, Peng J, et al. Fragmented wide QRS on a 12-lead ECG: A sign of myocardial scar and poor prognosis. Circ Arrhythm Electrophysiol 2008; 1: 258–268.
- 26.
Maron BJ, Roberts WC. Quantitative analysis of cardiac muscle cell disorganization in the ventricular septum of patients with hypertrophic cardiomyopathy. Circulation 1979; 59: 689–706.
- 27.
Kuribayashi T, Roberts WC. Myocardial disarray at junction of ventricular septum and left and right ventricular free walls in hypertrophic cardiomyopathy. Am J Cardiol 1992; 70: 1333–1340.
- 28.
Ordovas KG, Higgins CB. Delayed contrast enhancement on MR images of myocardium: Past, present, future. Radiology 2011; 261: 358–374.
