Abstract
Background:
The geographic distribution of cardiovascular (CV) health-care services has not been assessed systematically.
Methods and Results:
Data of the Japanese Circulation Society (JCS) annual survey were provided to the JCS working group with the permission of the JCS Scientific Committee. The status of CV practice in 2010 was then assessed in 47 prefectures retrospectively, along with national census and gross domestic product (GDP) data. The surveyed indices included resources (hospitals, beds and cardiologists), burden (number of inpatients), and outcome (CV mortality and autopsy) in each prefecture, which correlated well with respective populations or GDP. Inequality of geographic distribution was evident for pediatrics among the 47 prefectures, according to Lorenz curve, Gini coefficient or the maximum/minimum ratio for each index. According to the Gini coefficients, only the number of inpatients (medical or acute myocardial infarction) and beds for the total number of general hospitals or the hospitals surveyed in the present JCS study were lower than expected with regard to GDP.
Conclusions:
Geographic disparity of CV resources or burden was larger in pediatrics than in CV medicine or surgery. Improvement of equality in CV practice with regard to appropriateness and quality are the coming challenges for the JCS.
A long with rapid urbanization, aging population, population growth, globalization and industrialization, developed countries have experienced an epidemiologic transition from pestilence and famine to delayed degenerative disease or non-communicable disease.1,2
Disease statistics show that cardiovascular disease (CVD) has become an epidemic also in Japan, as in other industrial countries.3,4
This trend will be exaggerated, because the population of aged people (ie, ≥65 years) is expected to increase until 2042.5
These changes in social demography have been discussed with regard to geographic inequality in physician distribution.6,7
Editorial p????
To deal with the clinical burden of CVD, the Japanese Circulation Society (JCS) launched the Board of Cardiovascular Specialties System for board certification of cardiologists in 1989. This system includes certification of general hospitals (GH) with cardiovascular (CV) beds in order to meet JCS criteria for teaching hospitals to provide cardiology training to physicians seeking to be a JCS board-certified cardiologist and the JCS board test.8
Then, the JCS National Survey on the Management of CVD (JCS survey) was launched in 2004 to assess the clinical activity of each institution with CV beds to provide adequate training to the applicants of the board of cardiology specialist. An annual summary of the surveyed clinical activities was published by the JCS in a fact book in Japanese and on its website.9
Given that the JCS annual reports during 2004 and 2010 showed that the number of GH responding to the JCS survey increased year by year and almost plateaued in 2008, we undertook the present retrospective evaluation of the consolidated data based on the annual survey of 2010. The aim was to investigate the geographic distribution of medical resources, burden of CVD and outcome of CV inpatient practice among 47 prefectures.
Methods
Subjects and Data Collection
A nationwide annual survey of institutions for CV care was conducted by the JCS Scientific Committee. The number of institutions with CV beds, based on the regional government database of medical institutions, was 3,791 in 2010.9
A letter was sent to the president of each institution requesting participation in the JCS survey. Responding to the survey was voluntary until 2009, when it became mandatory by the JCS to respond in order to obtain or maintain JCS certification. The detailed questionnaire was completed via the Internet once a year to report the data for the previous year, and 1,647 institutions responded to the present survey. Among them, the number of GH was 1,629.
Data were collected by the Japan Clinical Research Assistance Center (JCRAC) Data Center of the National Center for Global Health and Medicine, at which the questionnaires were available for 24 weeks in the middle of each year to provide information about the preceding year. Outliers were detected using JMP®9 (SAS Institute, Cary, NC, USA) and assessed clinically as well as epidemiologically by members of the JCS working group (H.Y., S.H., T.O.). These related to the number of CV beds for surgery, and the number of autopsies. These figures were then queried directly with the respective institutions via JCRAC by a data manager (Y.S.) or a statistician (A.K.). The corrected numbers were used in the present study, which were different from those reported in the 2010 JCS annual report.9
Data on the total number of GH and their general beds in Japan were obtained from the public data source. Data of the JCS annual survey were provided to the JCS working group through the permission of the JCS Scientific Committee. Data sheets provided information on the whole institution, including number of general beds, cardiologists, inpatients including cases of acute myocardial infarction (AMI) and admission to the cardiac/coronary care unit (CCU), CV death and autopsy related to CVD. The present analysis of the JCS survey was discussed and approved for publication by the JCS Scientific Committee.
Public Data Sources
The Summary of Static/Dynamic Surveys of Medical Institutions was used to identify for each prefecture the number of medical care institutions, inpatient census, bed occupancy rates, and the number of health-care professionals (medical doctors, nurses, allied health workers).10–12
The National Statistics Center e-Stat report and the government report were used to obtain the population and the gross domestic product (GDP) of each prefecture in 2010,13,14
and the Annual of the Pathological Autopsy Cases of Japan was used for mortality and autopsy rates.15
Definitions and Measures
AMI
Diagnostic criteria were based on the universal definition in 2007 and the JCS guideline 2008: (1) detection of rise and/or fall of cardiac biomarkers (preferably troponin); (2) typical chest pain lasting >30 min; (3) ST-segment elevation in at least 2 contiguous leads; and (4) treatment with primary percutaneous coronary intervention (angioplasty and/or stent deployment).16,17
Areas of Japan
Japan is divided into 47 prefectures for the first level of jurisdiction and administrative division. The JCS regional societies, however, are divided geographically into 9 regions.8
Given that the government plan of the Do-Shu-System divides the area of Kanto-Ko-Shin-Etu into Kitakanto-Shin-Etu and Minamikanto, the present study on the larger region analysis followed the government grouping.18
Accordingly, the present 10 regions are Hokkaido; Tohoku (Aomori, Iwate, Akita, Miyagi, Yamagata, and Fukushima); Kitakanto-Shin-Etu (Ibaragi, Tochigi, Gunma, Niigata, Nagano); Minamikanto (Saitama, Chiba, Tokyo, Kanagawa, Yamanashi); Hokuriku (Toyama, Ishikawa, Fukui); Tokai (Shizuoka, Gifu, Aichi, Mie); Kinki (Shiga, Kyoto, Osaka, Hyogo, Nara, Wakayama); Chugoku (Okayama, Hiroshima, Shimane, Tottori, Yamaguchi); Shikoku (Kagawa, Tokushima, Kochi, Ehime); and Kyushu-Okinawa (Fukuoka, Saga, Nagasaki, Kumamoto, Oita, Miyazaki, Kagoshima, Okinawa).
Cardiologist
This is a clinician in the fields of CV medicine (physician), CV surgery (surgeon), or CV pediatrics (pediatrician).
Cardiology Specialist
This is a JCS-certified board member.
CVD
The ICD-10 codes were used, including I00–I99 (excluding I60–I69), and Q20–Q28.
CV Institution
The administrative office of each prefecture requires every institution to define the field of clinical practice. The list of the institutions for CV practice is public, but the level of CV activity, including the number of beds, inpatients or specialty staff, are unknown.
General Beds
Beds allocated for patients receiving care other than for psychiatric disease, infectious diseases, tuberculosis, and long-term care.19
GH
Any hospital, excluding those that treat only patients with psychiatric diseases or tuberculosis.19
Surveyed GH
Institutions include both GH and inpatient clinics in which the number of beds was <20. Surveyed GH were GH with ≥20 inpatient beds that participated in the JCS annual survey.
Hospital
An institution with ≥20 inpatient beds that provides medical and dental care by medical doctors or dentists.19
Measure of Burden
The number of hospital inpatients with CVD or who had AMI.
Measure of Outcome
The number of in-hospital CV deaths and autopsies due to CVD.
Medical Resources
The number of institutions, GH, general beds, and medical doctors
.
Number of CV general beds was divided into medical, surgical and pediatric beds and cardiologists into physician, surgeon and pediatrician.
Statistical Analysis
Data are presented as mean±SD. Each index related to resources, burden and outcome was aggregated for the 47 prefectures as a whole and for the 10 regions as a whole. To measure the geographic distribution of the respective indices and GDP, (1) Pearson’s correlation coefficients for the volume of clinical activity and the population or the number of GH; (2) maximum/minimum ratio; and (3) the Lorenz curves or the Gini coefficients for the 47 prefectures or 10 regions were analyzed using absolute values or adjusted per 0.1 million general population. The Gini coefficient was derived from the Lorenz curve, which is commonly used in studies on income inequality among countries,20
or in temporal changes of the regional distribution of physicians.6,7
When the Lorenz curve (y; a relative cumulative share of the number of variables, 0≤y≤1) is represented by the function y=L(x), where x is a relative cumulative population (0≤x≤1), the Gini coefficient is 0.5–∫01L(x)dx.6,21
All statistical analysis was conducted by H.T. and A.K., using JMP®9 (SAS Institute), SAS®9.3 (SAS Institute) and Excel.
Results
Coverage of JCS Annual Survey
The surveyed GH comprised 21.5% and 65.6% of the total number of GH and of GH with >300 beds, respectively (Figures 1A,B). A total of 1,647 institutions that participated in the JCS 2010 survey had 551,455 general beds, and 61,381 of those beds were available for CVD (Figure 1C). The JCS 2010 survey covered 61% of general beds in total, and peak cumulative beds was noted at a hospital size of 300–399 beds among the surveyed GH (Figure 1D). General beds assigned to CVD comprised 11% of those in the surveyed GH and 6.8% of the whole of Japan, in which the occupancy rate of CV beds was higher in small-scale GH (Figure 1D). The number of cardiologists in surveyed institutions in the present study was 6.9% of the total number of in-hospital clinicians, and 52% of the JCS-certified board members (cardiology specialists) participated; for physician cardiologists and surgeon cardiologists this was 83% and 89%, respectively. The surveyed number of CVD deaths in hospital and that of CV autopsies, comprised 24% and 12% of the total in Japan (Table 1).

Table 1.
Statistics Related to Inpatient Practice in 2010
| Variable |
JCS annual survey |
MHLW statistics |
| n |
Max/Min |
n |
Max/Min |
| Medical resources |
| Institutions |
| Total no. GH in Japan |
NE |
NE |
7,587 |
4.96 |
| CV institutions |
3,791 |
5.53 |
NA |
NA |
| Surveyed GH |
1,629 |
3.54 |
NA |
NA |
| General beds |
551,455 |
2.51 |
903,621 |
2.14 |
| CV bed |
61,381 |
3.17 |
NA |
NA |
| Medicine |
48,547 |
3.20 |
NA |
NA |
| Surgery |
10,785 |
4.42 |
NA |
NA |
| Pediatrics |
1,995 |
(56.1) |
NA |
NA |
| Clinicians in the hospital |
NA |
NA |
180,966 |
NA |
| Cardiologists |
12,407 |
2.53 |
NA |
NA |
| Physician |
9,149 |
2.71 |
11,015 |
NA |
| Surgeon |
2,639 |
2.96 |
2,955 |
NA |
| Pediatrician |
619 |
10.8 |
NA |
NA |
| Board members |
6,160 |
2.88 |
NA |
NA |
| CV burden |
| CV inpatients |
| Medicine |
1,072,488 |
3.07 |
NA |
NA |
| Surgery |
144,311 |
3.17 |
NA |
NA |
| Pediatrics |
24,837 |
(187) |
NA |
NA |
| CCU |
226,180 |
8.32 |
NA |
NA |
| AMI |
68,087 |
1.65 |
NA |
NA |
| CV outcome |
| Death due to CVD |
44,681 |
3.44 |
189,360† |
NA |
| Autopsy related to CVD |
1,720 |
6.28 |
13,791‡ |
NA |
†Total number of deaths in Japan (reference 13). ‡Reference 15. (n), only 46 prefectures included, because of zero in 1 prefecture. Max/Min, maximum divided by the minimum, per 0.1 million population in 47 prefectures. AMI, acute myocardial infarction; CCU, coronary/cardiac care unit; CV, cardiovascular; CVD, CV disease; GH, general hospital; JCS, Japanese Circulation Society; MHLW, Ministry of Health, Labor and Welfare, Japan; NA, not available; NE, not examined.
The nationwide distribution of clinical resources is shown in
Figure 2. The total number of GH, CV institutions or surveyed GH in each prefecture correlated well with the respective populations or GDP (Table 2;
Figure 2A). The number of CV institutions and surveyed GH also correlated well with the respective numbers of GH in each prefecture (r=0.980, 0.965), but the adjusted number of GH, CV institutions and surveyed GH per 0.1 million population in each prefecture varied widely with regard to the respective population (Figure 2B). The adjusted number of GH was similarly low, not only in sparsely populated prefectures such as Aomori, Iwate and Tottori, but also in highly urbanized prefectures such as Saitama, Shizuoka, Kanagawa, Chiba and Tokyo.

Table 2.
Differences in Inpatient Practice Among 47 Prefectures in 2010
| Variable |
Correlation coefficient (r) |
Gini coefficient |
| With population |
With GDP |
47 prefectures |
10 regions |
| Medical resources |
| Institutions |
| Total no. GH in Japan |
0.887 |
0.817 |
0.206 |
0.187 |
| CV institutions |
0.904 |
0.806 |
0.201 |
0.180 |
| Surveyed GH |
0.923 |
0.848 |
0.177 |
0.158 |
| General beds |
| CV beds |
0.937 |
0.872 |
0.150 |
0.116 |
| Medicine |
0.932 |
0.864 |
0.159 |
0.121 |
| Surgery |
0.914 |
0.848 |
0.182 |
0.114 |
| Pediatrics |
0.847 |
0.873 |
0.315 |
0.126 |
| Clinicians in the hospital |
| Cardiologists |
0.947 |
0.953 |
|
|
| Physician |
0.946 |
0.941 |
0.151 |
0.094 |
| Surgeon |
0.942 |
0.968 |
0.151 |
0.079 |
| Pediatrician |
0.890 |
0.940 |
0.252 |
0.097 |
| Board members |
0.934 |
0.926 |
0.160 |
0.106 |
| CV burden |
| CV inpatients |
| Medicine |
0.961 |
0.878 |
0.124 |
0.081 |
| Surgery |
0.946 |
0.854 |
0.146 |
0.085 |
| Pediatrics |
0.797 |
0.757 |
0.369 |
0.217 |
| CCU |
0.950 |
0.915 |
0.168 |
0.095 |
| AMI |
0.992 |
0.924 |
0.060 |
0.032 |
| CV outcome |
| Death due to CVD |
0.926 |
0.813 |
0.165 |
0.124 |
| Autopsy related to CVD |
0.917 |
0.972 |
0.214 |
0.103 |
GDP, gross domestic product. Other abbreviations as in Table 1.
The number of general beds in the total GH or surveyed GH along with the number of CV beds in surveyed GH in each prefecture correlated well with the respective populations (Figure 2C; r=0.962, 0.958, 0.937). The number of total general beds or CV beds in the surveyed GH in each prefecture also correlated well with the total number of general beds in each prefecture (r=0.987, 0.988). The adjusted number of general beds per 0.1 million population in each prefecture varied widely with regard to the respective population for the total number of general beds, general beds for surveyed GH or CV beds for surveyed GH (Figure 2D).
Highly significant correlation was also noted between the number of beds in each subspecialty of medicine, surgery or pediatrics and the population or GDP in the respective prefectures (Table 2;
Figure 2E). The adjusted number of subspecialty beds per 0.1 million in each prefecture varied widely with regard to the respective populations (Figure 2F). The number of physicians, surgeons, pediatricians and cardiology specialists correlated well with the respective populations or GDP (Table 2;
Figure 2G) or the numbers of surveyed GH (r=0.960–0.838). The adjusted number of subspecialists per 0.1 million population varied widely with regard to the respective populations (Figure 2H).
Clinical Burden of CV Practice
Nationwide burden for in-hospital CV care is summarized in
Figure 3. The number of CV inpatients in medicine, surgery, and pediatrics in each prefecture correlated well with the respective populations or GDP (Table 2;
Figure 3A) or with the number of surveyed GH (r=0.977–0.769). The adjusted number of CV inpatients per 0.1 million population in each prefecture varied widely with regard to the respective populations (Figure 3B). The total number of AMI and CCU inpatients in 2010 was 68,087 and 226,180, respectively. The number of AMI and CCU patients in each prefecture depended on the respective population or GDP (Table 2;
Figure 3C) or the number of surveyed GH (r=0.936, 0.861). The adjusted number of AMI or CCU inpatients per 0.1 million population in each prefecture varied widely (Figure 3D).
Outcomes of CV Practice
Overall in Japan, the total number of CV deaths and of CVD autopsies in the JCS 2010 survey was 44,681 and 1,720 cases, respectively, and correlated well with the respective population or GDP (Table 2;
Figure 4A). There was an exponential relationship between the number of CV deaths and of autopsies (R2=0.836). The proportion of CV autopsies to the total number of CV deaths was 4% in 2010. The adjusted number of CV deaths or autopsies per 0.1 million population varied widely (Figure 4B).
Lorenz Curves and Gini Coefficients
To assess the geographic distribution of clinical practice, a Lorenz curve of each index was drawn against the relative cumulative population for the 47 prefectures or 10 regions (Figure 5;
Table 2). All of the curves show an increasing but concave function. The total number of GH in Japan, CV institutions and surveyed GH followed a similar trajectory, below the diagonal line representing perfect equality (Figure 5A). In each subdivision, beds (Figure 5B), cardiologists (Figure 5C) and inpatients (Figure 5D) also followed a similar trajectory, while CV pediatric beds (Figure 5B), pediatricians (Figure 5C) and inpatients in pediatrics (Figure 5D) had by far the largest inequality. The Lorenz curve for AMI was very close to the line of equality (Figure 5E), while CCU inpatients, CV death and autopsy were unequally distributed (Figures 5E,F). The Gini coefficient and the population-adjusted maximum/minimum ratio of GDP were 0.1333 and 2.7, respectively (Figure 5G).
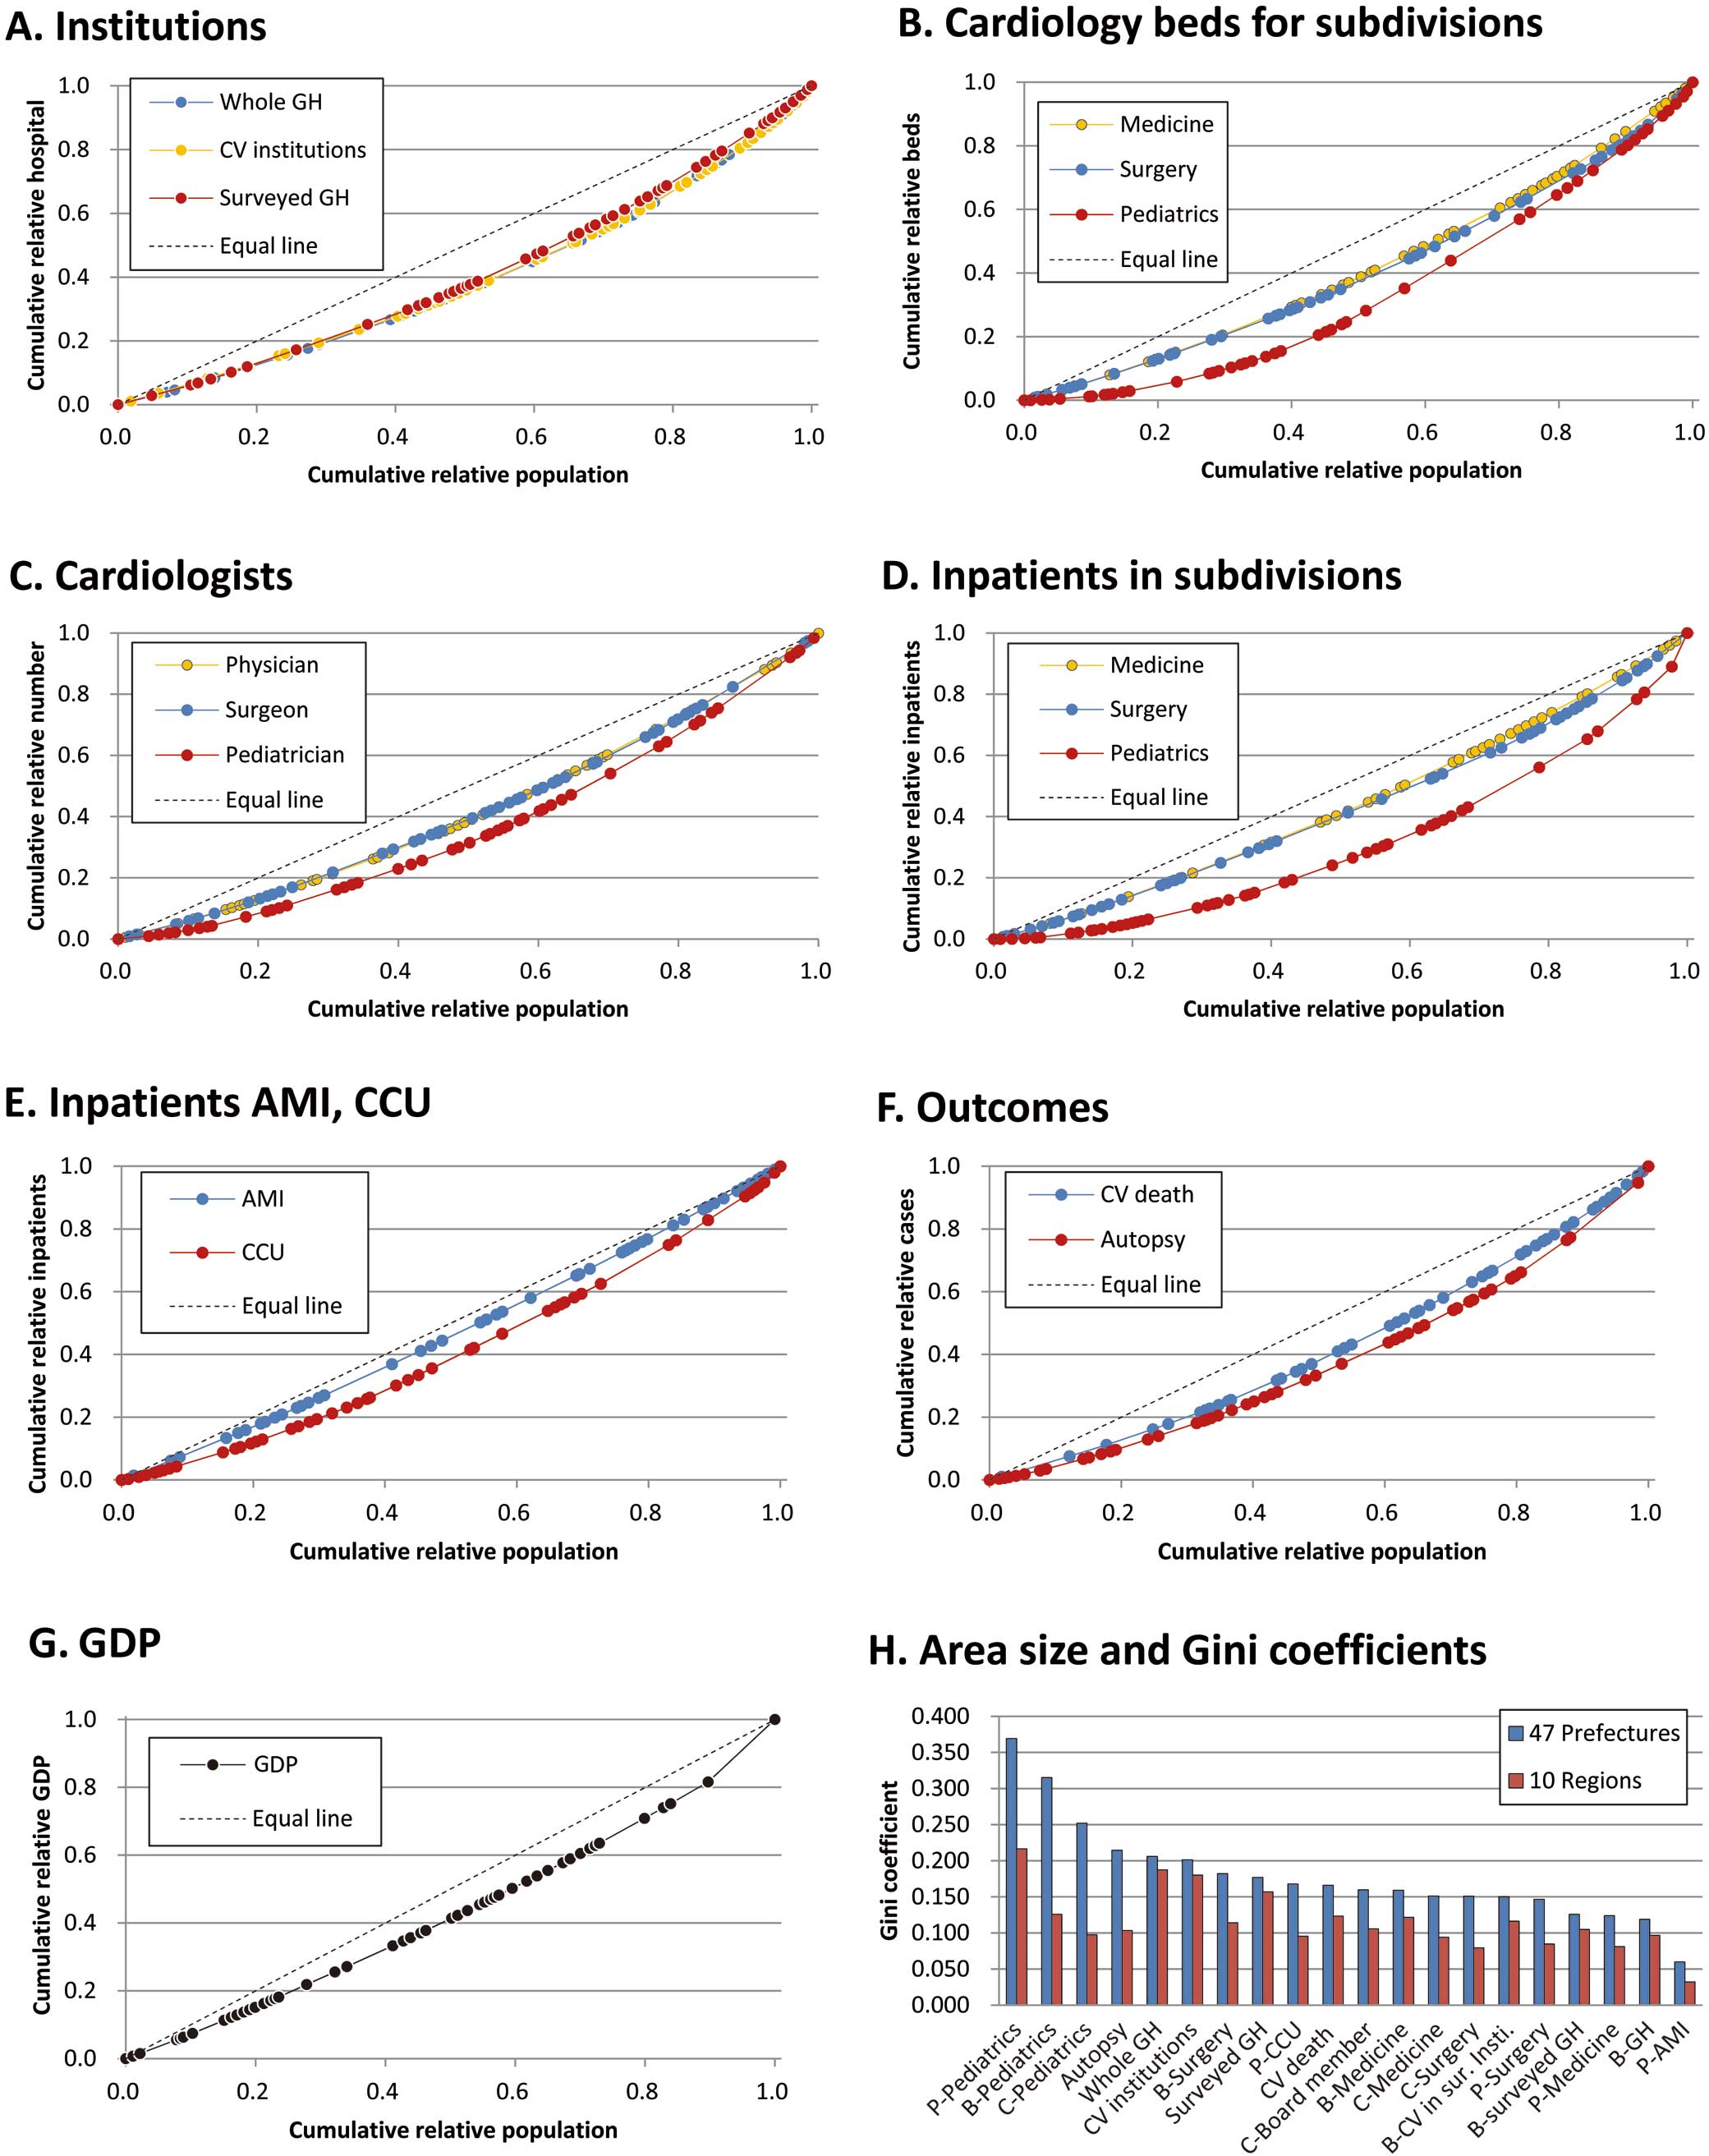
The Gini coefficient for each index for the 47 prefectures and for the 10 regions is shown in
Figure 5H. The Gini coefficients for the 47 prefectures correlated with those for the 10 regions (r=0.695). The Gini coefficient for each index was larger for the 47 prefectures (range, 0.060–0.369) than those for the 10 regions (range, 0.032–0.217). The population-adjusted maximum/minimum ratios (Table 1) correlated exponentially with Gini coefficient (R2=0.860).
Discussion
The past 17 years have witnessed research on the nationwide survey or registry, pioneered by Takeshita et al in Japan.22
The aim of the present study on the JCS survey 2010 was to capture data that reflect real-world clinical practice in the 47 prefectures. Clinical volume, which reflects activity of CV practice, was assessed on resources, burden, and outcome for the 47 prefectures. The main findings of the present study are as follows: (1) surveyed numbers of resources, burdens and outcomes of CV practice in each prefecture correlated well with the respective populations, GDP or number of GH; (2) a wide variation was noted in each index among prefectures, when it was adjusted per 0.1 million population of the respective prefectures; (3) inequality of geographic distribution was evident in beds, pediatricians and inpatients for pediatrics; and (4) the Gini coefficients for clinical indices for the 47 prefectures correlated with those for the 10 regions, and each coefficient was lower for the 10 regions than for the 47 prefectures.
JCS 2010 Survey vs. Nationwide Volume
The JCS survey has been carried out since 2004. We chose 2010 as a representative year, because the number of surveyed GH had almost plateaued by 2008, and the medical institutions along the Pacific Coast were destroyed by the 2011 Tohoku earthquake and tsunami. Therefore, 2010 was the most suitable for social observations.
The number of GH that participated in the present JCS 2010 survey comprised only 22% of the total number of GH in Japan. Nevertheless, the distributions of surveyed GH and their beds were geographically similar to those for the total number of GH, as shown by the similar trajectories of the respective Lorenz curves (Figure 5A), as well as by the high correlation coefficient for the total number of GH in each prefecture (r=0.979 in CV institutions and 0.958 in surveyed GH). In the present study, the number of physicians and surgeons in cardiology who took part in the survey comprised 83% and 89% of the total number in Japan, respectively. Accordingly, the present results reflected the nationwide inpatient practice for CVD beyond the relatively smaller number of the surveyed GH.
Characteristics of Inequality Indicators
Absolute numbers for the general population, GDP or GH are obviously major determinants of geographic distribution of CV clinical activity, as supported by the high correlation coefficients. A large variation in the population-adjusted numbers for each index represents the presence of inequality. As a measure of inequality, the Gini coefficient integrates all of the divided regional values into 1 nationwide parameter, while the maximum/minimum ratio is calculated using the 2 extreme values for each of the 47 prefectures. The maximum/minimum ratio varied from 187 to 1.65, suggesting a widening inequality. An exponential relationship between Gini coefficient and the maximum/minimum ratio for the 47 prefectures as well as for the 10 regions means that the maximum/minimum ratio of CV activities was flat, up to a turning point of the Gini coefficient, after which the ratio increased non-linearly.
A maldistribution of physicians was demonstrated throughout the whole country as well as among nations.6,7
Previous reports noted 2 characteristics of the Gini coefficient for physicians. First, an obvious increase in physicians did not improve the Gini coefficient of nationwide physician distribution in both Japan and USA.6,7,23
Practicing physicians increased from 150.1 to 165.2 per 0.1 million population during 1998 and 2008, but such an increase did not reduce the Gini coefficients in Japan.7
In the USA, the physician-to-population ratio (per 0.1 million population) increased from 158.2 in 1980 to 232.9 in 2005, but the Gini coefficient decreased from 0.34 to 0.32.23
Second, the summation of the regions of medical service area alters the level of the Gini coefficient due to an attenuation of the maximum/minimum ratio. For example, Kobayashi and Takaki reported Gini coefficients of 0.331–0.340 for 3,268 municipal bodies,6
which was similar to that for the USA.23
Tanihara et al noted a range of 0.224–0.211 for 348 secondary tiers of medical care (STM).7
In the present study the Gini coefficients for CV physicians, surgeons, and pediatricians were 0.151, 0.151, and 0.252, respectively, for the 47 prefectures. The difference in sample size (ie, 3,268, 348 and 47 for Kobayashi and Takaki,6
Tanihara et al7
and the present study, respectively) thus affects the calculation of Gini coefficient, the difference in which may be partly explained by a reduction of maximum/minimum ratio to 2.7 for the present 47 prefectures, and 21.3 in the study of 348 STM. A clear attenuation of Gini coefficient was confirmed in the present study when the Gini coefficients for the 47 prefectures were compared with those for the 10 regions (Figure 5H).
Factors Related to Inequality
A high equality in CV practice for medicine or surgery may be explained by setting up of universal health coverage, which has been uniform across the nation since 1961 and which has promised equality of medical service distribution.24,25
Of note, 76% of the hospitalized patients lived in the same STM area in 2008, which also assists in maintaining equality.12,24
From the ranking of the Gini coefficients (Figure 5) or the comparison of the Lorenz curves, inequality in pediatrics was evident in the distribution of both medical resources and CV burden for the 47 prefectures. The present findings accord well with the geographic disparity in the pediatric health-care systems.26
Urbanization has been considered as a factor affecting the equality of health-care services,7,23
and this was also supported in the present study. Geographic inequality of mortality has been correlated with income level.27–29
In the present study, 4 indices did not correlate with GDP: these were the number of beds for GH or surveyed GH, and the number of medical or AMI inpatients. In addition, GDP affected pediatric beds, pediatricians and CVD autopsies more than it did the other 17 indices. Japan currently has the lowest level of fertility among the developed nations, which might accelerate the decrease of pediatricians and widen the inequality of physician distribution.
Study Limitations
The present study has some potential limitations. First, data collected were based on the reported values from the surveyed institutions. Values are an aggregation for each prefecture and unambiguous. Second, details of inpatient practice or performance of medical resources were not included in the present analysis. Third, the quality of reported information was limited due to self-reporting without outside verification of the data. Therefore, we addressed the quality of data by correcting for reporting errors by meticulously comparing the data from hospitals over several years of surveys. Fourth, the appropriateness, quality, or effectiveness of CV inpatient practice was not accessible in the present analysis.
Coming Challenges for the JCS Annual Survey
The United Nations and the world recognize the global importance of non-communicable disease, with CVD at the forefront.30
All countries need information on what is being achieved as a result of health-care decisions and polices, and how improvements can be measured.31
Thus, systematic monitoring and assessment of inpatient practice as a national project will be needed in order to study the clinical practice environment. This nationwide annual survey will provide important information on the monitoring of the current activities and outcomes in inpatient CV practice. When the systematic surveys of lifestyle, socioeconomic status, and environmental differences are added to the quantitative analysis of the effects of CV management on outcome, this will enable re-engineering of the health-care system, which will in turn enable reduction of geographic disparity and improvement of the nationwide balance of the health-care system.32
Recent developments in information technology will provide several powerful tools with which to secure the data quality and management.33
The results of the JCS survey will provide reassurance, in general, on the quality, reliability, and availability of CV inpatient practice in Japan.
Acknowledgments
This work was totally funded by the Japanese Circulation Society (JCS). The authors would like to thank all individuals nationwide who have contributed to the JCS survey over the past 10 years. We are also proud of the contribution by staff in the surveyed institutions for CV practice despite the limited number of cardiologists and of available general beds.
Disclosures
The authors declare that they have no conflicts of interest.
References
- 1.
Smith SC, Collins A, Ferrari R, Holmes DR, Logstrup S, Jur C, et al. Our time: A call to save preventable death from cardiovascular disease (heart disease and stroke). J Am Coll Cardiol 2012; 60: 2343–2348.
- 2.
Lim SS, Vos T, Flaxman AD, Danaei G, Shibuya K, Adair-Rohani H, et al. A comparative risk assessment of burden of disease and injury attributable to 67 risk factors and risk factor clusters in 21 regions, 1990–2010: A systematic analysis for the Global Burden of Disease Study 2010. Lancet 2012; 380: 2224–2260.
- 3.
Ministry of Health, Labour and Welfare. Health statistics in Japan 2010. http://www.mhlw.go.jp/english/database/db-hss/dl/hs2007.html (accessed July 25, 2014).
- 4.
Go AS, Mozaffarian D, Roger VL, Benjamin EJ, Berry JD, Blaha MJ, et al. Executive Summary: Heart disease and stroke statistics–2014 update: A report from the American Heart Association. Circulation 2014; 129: 399–410.
- 5.
Cabinet Office, Government of Japan. Annual report on the aging society: 2013. http://www8.cao.go.jp/kourei/english/annualreport/2013/2013pdf_e.html (accessed August 26, 2014).
- 6.
Kobayashi Y, Takaki H. Geographic distribution of physicians in Japan. Lancet 1992; 340: 1391–1393.
- 7.
Tanihara S, Kobayashi Y, Une H, Kawachi I. Urbanization and physician maldistribution: A longitudinal study in Japan. BMC Health Serv Res 2011; 11: 260–266.
- 8.
Japanese Circulation Society. Board certified member of the Japanese Circulation Society. http://www.j-circ.or.jp/english/activities/senmoni.html (accessed October 27, 2014).
- 9.
Japanese Circulation Society. The Japanese Registry of all cardiac and vascular diseases. http://jroadinf.ncvc.go.jp/ (accessed November 5, 2014).
- 10.
Ministry of Health, Labour and Welfare. Hospital report. http://www.mhlw.go.jp/english/database/db-hss/mi.html (accessed November 5, 2014).
- 11.
Ministry of Health, Labour and Welfare. Patient survey of 2008, 2011. http://www.e-stat.go.jp/SG1/chiiki/ToukeiDataSelectDispatchAction.do (accessed July 25, 2014).
- 12.
Ministry of Health, Labour and Welfare. Survey of physicians, dentists, and pharmacologists, 2011. http://www.mhlw.go.jp/toukei/youran/data24k/2-47.xls-5k-2013-05-14 (accessed August 30, 2014).
- 13.
e-Stat. Statistics Japan. http://www.e-stat.go.jp/ (accessed August 30, 2014).
- 14.
Cabinet Office, Government of Japan. Kenminkeizaikeisan. http://www.esri.cao.go.jp/jp/sna/sonota/kenmin/kenmin_top.html (accessed August 30, 2014) (in Japanese).
- 15.
Japanese Society of Pathology. Annual of the pathological autopsy cases of Japan. http://pathology.or.jp/kankoubutu/autopsy-index.html (accessed August 30, 2014).
- 16.
Thygesen K, Alpert JS, White HD; Joint ESC/ACCF/AHA/WHF Task Force for the Redefinition of Myocardial Infarction,
Jaffe AS, Apple FS, Galvani M, et al. Universal definition of myocardial infarction. Circulation 2007; 116: 2634–2653.
- 17.
Guidelines for the management of patients with ST-elevation myocardial infarction (JCS 2008). Circ J 2008; 72(Suppl IV): 1347–1442.
- 18.
Ministry of Internal Affairs and Communications. Dou-shyu-sei. http://www.soumu.go.jp/main-sosiki/jichi-gyousei/c-gyousei/doushyusei/ (accessed August 29, 2014).
- 19.
Ministry of Health, Labour and Welfare. The medical service law. http://mhlw.go.jp/english/wpsp-hw6/dl/02e.pdf (accessed August 29, 2014).
- 20.
Karlsson M, Nilsson T, Lyttkens CH, Leeson G. Income inequality and health: Importance of a cross-country perspective. Soc Sci Med 2010; 70: 875–885.
- 21.
Lee WC. Characterizing exposure-disease association in human populations using the Lorenz curve and Gini index. Stat Med 1997; 16: 729–739.
- 22.
Shihara M, Tsutsui H, Tsuchihashi M, Shigematsu H, Yamamoto S, Koike G, et al. Coronary revascularization in Japan. Part 1: Survey of facilities during 1997. Jpn Circ J 2001; 65: 1005–1010.
- 23.
Matsumoto M, Inoue K, Bowman R, Noguchi S, Toyokawa S, Kajii E. Geographical distributions of physicians in Japan and US: Impact of healthcare system on physician dispersal pattern. Health Policy 2010; 96: 255–261.
- 24.
Ikeda N, Saito E, Kondo N, Inoue M, Ikeda S, Satoh T, et al. Japan: Universal health care at 50 years 1: What has made the population of Japan healthy? Lancet 2011; 378: 1094–1105.
- 25.
Ikegami N, Yoo BK, Hashimoto H, Matsumoto M, Ogata H, Babazono A, et al. Japan: Universal health care at 50 years 2. Japanese universal health coverage: Evolution, achievements, and challenges. Lancet 2011; 378: 1106–1115.
- 26.
Okamoto Y, Iwami T, Kitamura T, Nitta M, Hiraide A, Morishima T, et al. Regional variation in survival following pediatric out-of-hospital cardiac arrest. Circ J 2013; 77: 2596–2603.
- 27.
Schwartz WB, Newhouse JP, Bennett BW, Williams AP. The changing geographic distribution of board-certified physicians. N Engl J Med 1980; 303: 1032–1038.
- 28.
Nakaya T, Dorling D. Geographical inequalities of mortality by income in two developed island countries: A cross-national comparison of Britain and Japan. Soc Sci Med 2005; 60: 2865–2875.
- 29.
OECD. Growing unequal? Income distribution and poverty in OECD countries. http://www.oecd.org/social/soc/ (accessed November 5, 2014).
- 30.
World Health Organization. United Nations high-level meeting on noncommunicable disease prevention and control. http//www.who.int/nmh/events/un-ncd_summit2011/en/ (accessed November 5, 2014).
- 31.
Krumholz HM. Outcomes research in the global environment: Learning from each other. Circ Cardiovasc Qual Outcomes 2011; 4: 489–490.
- 32.
Schofield DJ, Callander EJ, Shrestha RN, Passey ME, Percival R, Kelly SJ. Indirect economic impacts of comorbidities on people with heart disease. Circ J 2014; 78: 644–648.
- 33.
Hilbert M, Lopez P. The world’s technological capacities to store, communicate, and compute information. Science 2011; 332: 60–65.


