Abstract
Background:
Indoxyl sulfate (IS) is a protein-bound uremic toxin that is known to be associated with the risk of cardiovascular (CV) disease and death in both predialysis and dialysis patients. Data on levels of protein-bound uremic toxins in kidney transplant patients are scarce. The study’s objective was to evaluate the levels of IS in kidney transplant patients and the relationship with hard outcomes.
Methods and Results:
In 311 kidney transplant patients, IS levels were measured immediately before transplantation (T0), and 1 month (M1) and 12 months (M12) afterwards. Over a mean±standard deviation follow-up period of 113±29 months, a total of 55 deaths, 70 CV events and 71 graft losses were recorded. We observed a rapid significant decrease (below or near the normal value) in IS levels after kidney transplantation. Total and free IS levels at M12 were significantly higher in non-transplant patients than in transplant patients (P=0.003 and <0.0001 respectively), despite having similar estimated glomerular filtration rates. Lastly, IS levels were not associated with overall mortality, CV events or graft loss at T0, M1 or M12.
Conclusions:
IS levels were significantly lower in kidney transplant receipts than in non-recipients suggesting that kidney transplantation protects against an increase in IS levels. IS levels were not associated with hard outcomes in kidney transplant patients.
Kidney transplantation is the optimal treatment for patients with end-stage renal disease. Nevertheless, cardiovascular disease (CVD) remains the most common cause of death after kidney transplantation, and the event rate is highest in the early postoperative period.1
Kidney function is rarely restored to normal levels in renal transplant cases, and the majority of patients suffer from a degree of chronic kidney disease (CKD) that is severe enough to raise morbidity and mortality rates.2,3
The uremic syndrome observed in CKD patients has been attributed to the retention of a myriad of compounds that are normally cleared by the kidneys in healthy individuals. If these solutes interfere with biological/biochemical functions, they are referred to as uremic toxins.4
A substantial number of studies have linked the concentration of uremic solutes to overall mortality and CVD.5–8
Many studies have focused on establishing the circulating concentrations of individual solutes in predialysis and dialysis patients. In contrast, there are very few published data on levels of uremic toxins in kidney transplant patients in general and levels during the first year after transplantation in particular.9
Compared with the general population, kidney transplant recipients are at greater risk of CVD.10
Uremic toxins might also constitute a non-traditional risk factor in this population, as has been demonstrated in other groups of patients with impaired renal function. There are a considerable number of studies linking the protein-bound solutes indoxyl sulfate (IS) and p-cresyl sulfate to CV damage and events.8
In preclinical studies, IS induces oxidative stress, enhances the production of endothelial microparticles, inhibits endothelial proliferation and wound repair, and leads to tubular toxicity.11
These findings have been reinforced by clinical studies in which higher IS levels were found to be independently associated with the progression of CKD.12
In a cohort of patients at different stages of CKD, Barreto et al demonstrated positive associations between IS levels on the one hand and vascular calcification, overall mortality and CV mortality on the other.13
A recent study of 521 incident hemodialysis patients confirmed that elevated total IS levels were associated with all-cause mortality.14
Data on post-transplantation levels of protein-bound uremic toxins are very scarce. However, a study by Huang et al demonstrated that serum levels of p-cresol (a surrogate marker for p-cresyl sulfate) and IS were significantly higher in transplant patients with advanced CKD than in those with less advanced CKD.15
However, we are not aware of any published data on concentrations of protein-bound uremic toxins (of which IS is the prototype) in the immediate post-transplantation stages or on comparative levels of IS in transplant and non-transplant CKD patients with similar estimated glomerular filtration rates (eGFR) and on their association with CV risk.
Hence, the objectives of the present study were to (1) evaluate serum IS levels in kidney transplant patients, and (2) investigate the possible relationship between IS levels and biochemical parameters, CV events, graft survival and mortality.
Methods
Patient Selection and Study Protocol
Over a 7-year period (from January 1, 1998, to December 31, 2005), a total of 311 patients who had undergone kidney transplantation in the Department of Nephrology, Dialysis & Transplantation at Amiens University Hospital were included in the TOXTRANSLANT study. All patients gave their written, informed consent to participation. The study was approved by the local investigational review board (Comité de Protection des Personnes Nord-Ouest II, Amiens, France).
Included patients had undergone kidney transplantation and had consented to blood sample collection at the various study time points. At each study visit, demographic, clinical, biological and therapeutic data were recorded (on the basis of the patients’ medical charts).
Furthermore, we performed a case-control study. The controls were non-transplanted CKD patients from a prospective observational study of the link between uremic toxins and CV outcomes.13,16,17
The patients were at different stages of CKD (including 37 in CKD stage 3 and 37 in CKD stage 4). In the case-control study, the patients having received a transplant were matched for age, sex and eGFR with non-transplanted CKD patients. The investigators who performed the matching were blinded to the patients’ uremic toxins levels. Only 45 case patients and 45 control patients could be matched for all the study parameters.
Laboratory Tests
Blood samples were collected immediately before kidney transplantation (T0) and then at 1 (M1) and 12 months (M12) afterwards. A portion of each biological sample was analyzed immediately in an on-site biochemistry and bone biology laboratory, and the remainder was frozen and stored at −80℃ for subsequent quantification of IS. Serum calcium, phosphate, albumin, creatinine and protein levels were assayed using standard auto-analyzer techniques (using the Modular IIP system from Roche Diagnostics, Basel, Switzerland). Serum intact parathyroid hormone (iPTH) was determined in an immunochemiluminescence assay with a Nichols kit (Nichols Institute Diagnostics, San Juan Capistrano, CA, USA) from 2003 to 2006 and an IMMULITE®
2000 kit (Siemens Healthcare Diagnostics, Deerfield, IL, USA) from 2006 onwards (normal values: 10–70 pg/ml). The eGFR was calculated (in ml/min/1.73 m2) using the abbreviated Modification of Diet in Renal Disease (MDRD) equation. Urine calcium, phosphate and creatinine per 24 h (mmol/24 h) were determined at T0, M1 and M12 and assayed in the on-site laboratory.
For the assays of total and free IS in serum, the frozen samples were thawed, deproteinized by heat denaturation and then analyzed using reverse-phase high-performance liquid chromatography. Concentrations of IS were determined by fluorescence detection (excitation: 280 nm; emission: 340 nm), as described previously.18
The laboratory’s reference serum values in healthy controls are 0.016±0.004 mg/100 ml for total IS and 0.090±0.034 mg/100 ml for free IS. Free and total IS levels were measured using the same method in the same laboratory (Nephrology Section, Ghent University Hospital, Ghent, Belgium) in both the TOXTRANSPLANT cohort and the 45 non-transplanted CKD patients.
Follow-up
Death, CV outcomes and graft loss were prospectively recorded until September 30, 2011. For deaths, each medical chart was reviewed by a physician and the cause of death was assigned on the basis of all the available clinical information. For out-of-hospital deaths, the patient’s primary care physician was interviewed to gain pertinent information. Major CV events included stroke, myocardial infarction, congestive heart failure, coronary revascularization, hospitalization for angina, revascularization procedure for lower limb arteriopathy or sudden death. Graft loss was defined as the need for dialysis treatment (because of end-stage renal disease) for at least 3 consecutive months in transplant recipients.
Statistical Analysis
Data are expressed as the mean±standard deviation or number and percentage, as appropriate. The patients’ characteristics at different time points were compared in a test for repeated variables. Spearman’s rank correlation coefficient was used to assess the relationship between selected clinical or biochemical variables and serum IS levels. As the latter were not normally distributed, log-normalized IS values were analyzed. A Kaplan-Meier actuarial curve was used to estimate overall survival, CV events and graft loss occurrence for patients with IS values above and below the median values at T0, M1 and M12. The log-rank test was used to compare survival curves. Univariate and multivariate analyses were performed using Cox proportional hazard models of overall mortality, CV events and graft loss. Three models were applied for each outcome. Model 1 was a univariate, non-adjusted model testing for difference between IS levels at T0 and those at M12 (referred to as ∆IS). Model 2 was a multivariate model that included ∆IS and age. Lastly, model 3 was a multivariate test that included ∆IS, age and years on dialysis. The effect of repeated values of IS on the prognosis was assessed using a Cox mixed-effects model.
In the substudy analysis, the characteristics of the non-transplanted CKD population and the transplanted population were compared. Paired samples were compared using Student’s t-test. In all tests, a P value ≤0.05 was considered to be statistically significant. Statistical analyses were performed using SPSS software (SPSS Inc, Chicago, IL, USA), version 18.0 for Windows (Microsoft Corp, Redmond, WA, USA).
Results
The general characteristics of the 311 included patients (males: 61.8 %) are summarized in
Table 1. The mean±standard deviation (SD) age (at the time of transplantation) was 56±14 years. 97.4% of the transplant patients had received a kidney from a deceased donor. The main donor characteristics were as follows: 70% male; mean±SD age: 41±14; mean±SD serum creatinine level: 91.6±54.3 μmol/L. The most common immunosuppressive drug regimen combined corticosteroids, a calcineurin inhibitor and mycophenolic acid. It is noteworthy that the majority of patients received a 6-month course of sulfamethoxazole/trimethoprim after transplantation (to prevent
Pneumocystis carinii
infections). The main cause of renal failure was glomerular disease (34%). Prior to transplantation, 83% of patients were on hemodialysis, 10% were on peritoneal dialysis and 7% were not on dialysis. The mean time on dialysis prior to transplantation was 4.0±7.9 years.
Table 1.
Clinical, Demographic and Biological Characteristics of the Study Population as a Function of Time (Immediately Before (T0), 1 Month (M1) and 12 Months After Transplantation (M12))
| |
T0
(n=311) |
M1
(n=305) |
M12
(n=299) |
P value |
| T0 vs. M1 |
T0 vs. M12 |
M1 vs. M12 |
| Age, years |
56±14 |
|
|
|
|
|
| Male sex, % |
61.8 |
|
|
|
|
|
| Time on dialysis prior to transplantation, days |
1,459±2,900
(143) |
|
|
|
|
|
| Body mass index (kg/m2) |
25±5 (24) |
|
|
|
|
|
| Active smoker, % |
17 |
|
|
|
|
|
| Previous CV disease, % |
23 |
|
|
|
|
|
| Diabetes mellitus, % |
9 |
|
|
|
|
|
| Hypertension, % |
69 |
|
|
|
|
|
| Dyslipidemia, % |
22 |
|
|
|
|
|
| CKD stage, % |
|
|
|
0.231 |
0.037 |
<0.001 |
| 1 |
|
8.5 |
4 |
|
|
|
| 2 |
|
30.6 |
25.7 |
|
|
|
| 3 |
|
53 |
62.4 |
|
|
|
| 4 |
|
6.8 |
6.6 |
|
|
|
| 5 |
|
0.8 |
0.9 |
|
|
|
| eGFR, ml/min/1.73 m2 |
|
57.0±51.6 |
52.6±20.5 |
|
|
<0.001 |
| Serum creatinine, μmol/L |
|
140.6±60.4 |
145.3±55.8 |
|
|
0.099 |
| Calcium, mmol/L |
2.3±0.22 |
2.39±0.23 |
2.48±0.18 |
0.305 |
0.312 |
<0.001 |
| Phosphate, mmol/L |
0.94±0.48 |
0.82±0.26 |
1.11±0.2 |
<0.001 |
<0.001 |
<0.001 |
| Proteins, g/L |
55.2±6.9 |
60.1±5.6 |
66.3±5.2 |
<0.001 |
<0.001 |
<0.001 |
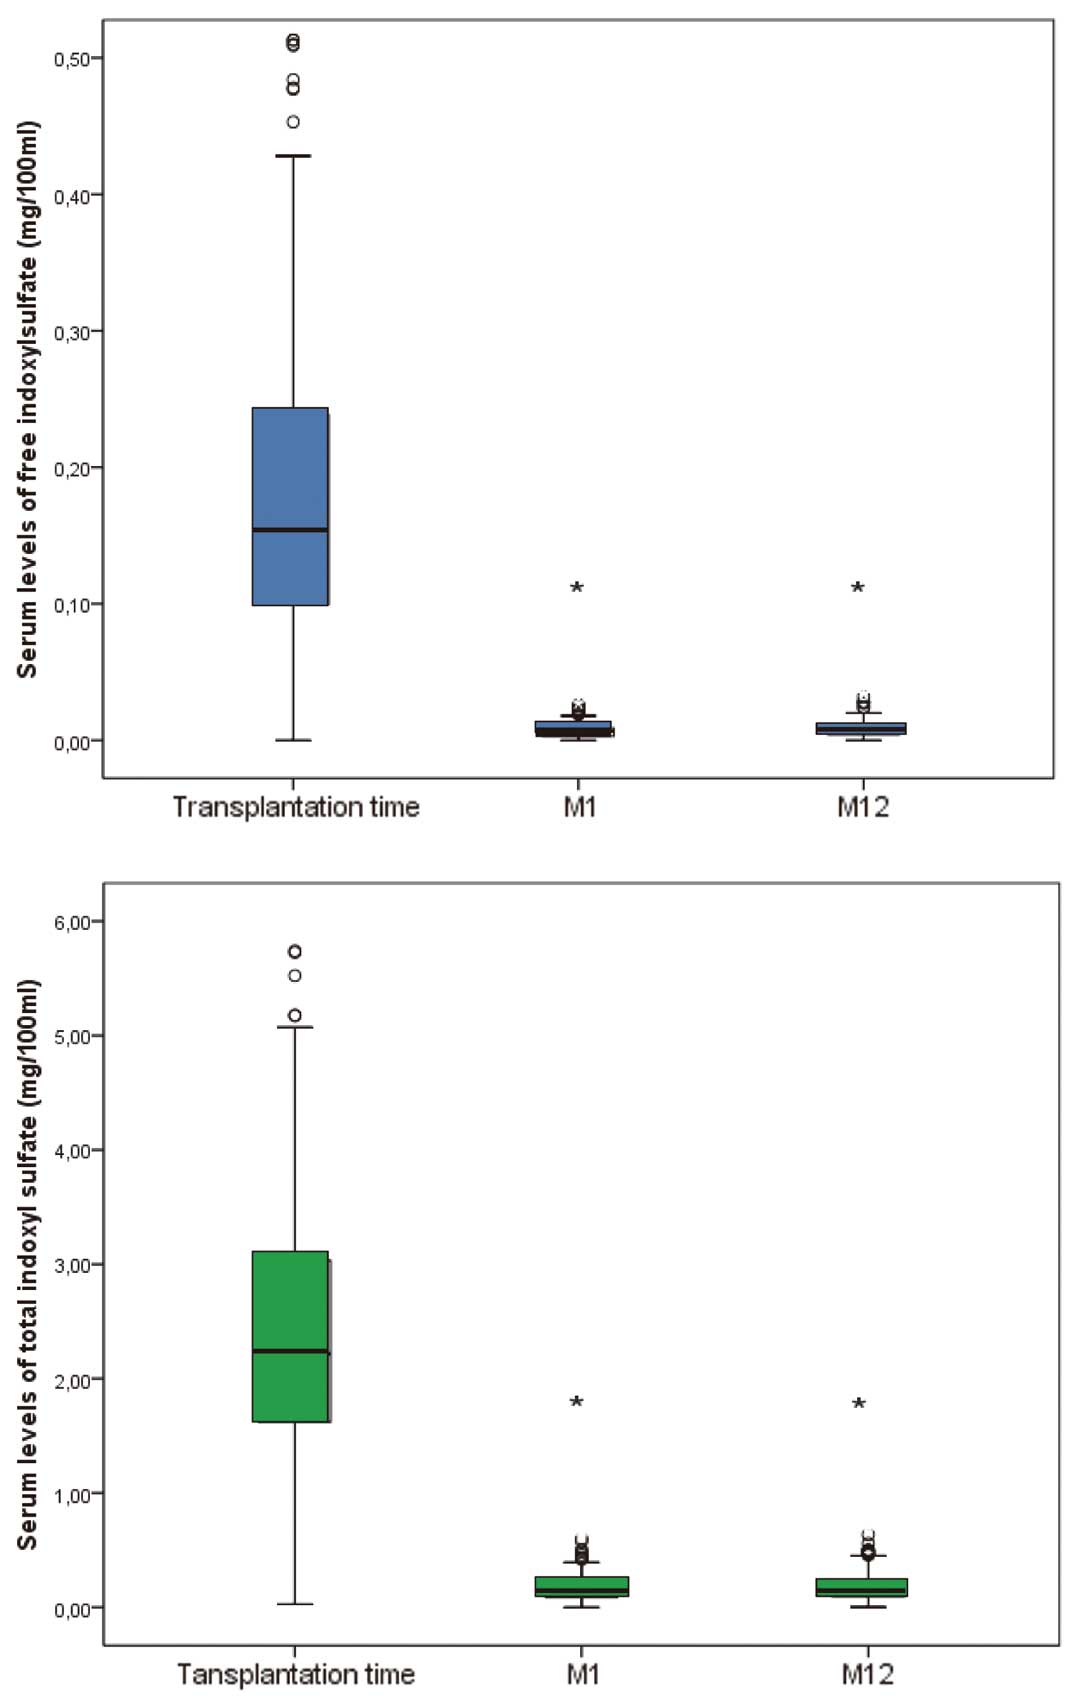
| Free IS, mg/dl |
0.187±0.132 |
0.011±0.043 |
0.009±0.013 |
<0.001 |
<0.001 |
0.652 |
| Total IS, mg/dl |
2.38±1.08 |
0.18±0.22 |
0.20±0.19 |
<0.001 |
<0.001 |
0.106 |
| iPTH, pg/ml |
309±362 |
146.5±134.1 |
113.9±129.0 |
|
|
<0.001 |
| CRP, mg/L |
7.7±24 (3) |
|
|
|
|
|
| Hemoglobin, g/dl |
11.9±1.8 |
|
|
|
|
|
| 25(OH) vitamin D, ng/ml |
|
16.4±10.3 |
21.53±13.1 |
|
|
<0.001 |
| Albumin, g/L |
|
38.14±4.9 |
41.36±4.09 |
|
|
<0.001 |
| Urine creatinine, mmol/24 h |
|
11.6±4.4 |
14.48±6.7 |
|
|
0.001 |
| Urine calcium, mmol/24 h |
|
2.73±1.96 |
2.98±2.63 |
|
|
0.130 |
| Urine phosphate, mmol/24 h |
|
24.8±13.8 |
27.5±12.9 |
|
|
0.006 |
| Urine calcium/creatinine (mmol/mmol) |
|
0.25±0.18 |
0.9±11.76 |
|
|
0.328 |
| Urine phosphate/creatinine (mmol/mmol) |
|
2.25±1.18 |
2.22±0.75 |
|
|
0.606 |
| Treatments |
| Corticoids, % |
|
85.3 |
87.2 |
|
|
|
| Mycophenolate, % |
|
76.3 |
78.6 |
|
|
|
| Cyclosporine, % |
|
83.3 |
73.1 |
|
|
|
| Tacrolimus, % |
|
15 |
22.3 |
|
|
|
| Everolimus/rapamycin, n (%) |
|
11 (3.1) |
17 (4.9) |
|
|
|
| Phosphate binder, n (%) |
|
1 (0.3) |
– |
|
|
|
| Use of vitamin D, n (%) |
|
29 (8.2) |
96 (27.7) |
|
|
|
| Cinacalcet, n (%) |
|
– |
1 (0.3) |
|
|
|
CKD, chronic kidney disease; CV, cardiovascular; eGFR, estimated glomerular filtration rate (according to the MDRD equation); IS, indoxyl sulfate; iPTH, intact parathyroid hormone.
Renal function improved rapidly after transplantation; the mean eGFR was 57.0±51.6 ml/min/1.73 m2
at 1 month after transplantation (M1), and 52.6±20.5 ml/min/1.73 m2
at 12 months after transplantation (M12).
Immediately prior to transplantation (T0), there were no differences in either the free or total IS level between patients on hemodialysis or peritoneal dialysis before transplantation and those not on dialysis before transplantation. At M1 and M12, total and free IS levels were significantly lower (P<0.001) than at T0 (Figure 1, Table 1). Further analysis of the data revealed a positive correlation between total IS levels and free IS levels at M1 (r2=0.502, P<0.001) and at M12 (r2=0.554 P<0.001). There were no significant differences in the total or free IS levels as a function of the CKD stage at either M1 or M12. There was no correlation between IS levels and donor characteristics.
Correlations between IS levels and biochemical parameters are summarized in
Table 2. At M1, log-normalized total IS levels were (1) positively correlated with serum calcium levels and urine creatinine and calcium levels, and (2) negatively correlated with the serum 25-hydroxyvitamin D level. At M12, log-normalized free IS levels were negatively correlated with serum total protein. There was no correlation between IS levels and the eGFR.
Table 2.
Correlations Between Log-Normalized IS Levels and Biochemical Parameters in Kidney Transplant Recipients
| |
Ln [free IS] |
Ln [total IS] |
| r |
P value |
r |
P value |
| T0 |
| Calcium |
0.055 |
0.368 |
0.049 |
0.420 |
| Phosphate |
0.035 |
0.573 |
0.064 |
0.294 |
| Proteins |
0.002 |
0.980 |
−0.037 |
0.540 |
| Hemoglobin |
−0.061 |
0.414 |
−0.59 |
0.435 |
| CRP |
0.037 |
0.626 |
0.006 |
0.938 |
| iPTH |
−0.127 |
0.098 |
−0.092 |
0.233 |
| M1 |
| Creatinine |
0.039 |
0.537 |
−0.027 |
0.659 |
| CKD stage |
0.031 |
0.624 |
−0.035 |
0.569 |
| eGFR |
−0.003 |
0.968 |
0.093 |
0.130 |
| Calcium |
0.038 |
0.548 |
0.279 |
<0.001 |
| Phosphate |
0.027 |
0.666 |
−0.010 |
0.868 |
| iPTH |
0.064 |
0.326 |
0.043 |
0.501 |
| 25(OH) vitamin D |
−0.065 |
0.341 |
−0.148 |
0.028 |
| Proteins |
0.005 |
0.937 |
0.053 |
0.386 |
| Albumin |
0.038 |
0.548 |
0.013 |
0.841 |
| Urine creatinine |
0.012 |
0.854 |
0.032 |
0.617 |
| Urine calcium |
0.077 |
0.242 |
0.157 |
0.014 |
| Urine phosphate |
−0.030 |
0.652 |
−0.009 |
0.885 |
| Urine calcium/creatinine |
0.086 |
0.196 |
0.185 |
0.005 |
| Urine phosphate/creatinine |
−0.025 |
0.706 |
0.010 |
0.878 |
| M12 |
| Creatinine |
0.108 |
0.092 |
−0.014 |
0.826 |
| CKD Stage |
0.023 |
0.723 |
−0.035 |
0.579 |
| eGFR |
−0.075 |
0.242 |
0.031 |
0.621 |
| Calcium |
−0.108 |
0.090 |
−0.039 |
0.537 |
| Phosphate |
0.082 |
0.197 |
0.121 |
0.056 |
| iPTH |
0.126 |
0.051 |
0.116 |
0.069 |
| 25(OH) vitamin D |
−0.082 |
0.216 |
−0.044 |
0.503 |
| Proteins |
−0.137 |
0.032 |
−0.165 |
0.009 |
| Albumin |
−0.122 |
0.062 |
−0.139 |
0.032 |
| Urine creatinine |
0.127 |
0.584 |
0.049 |
0.835 |
| Urine calcium |
−0.085 |
0.195 |
−0.056 |
0.389 |
| Urine phosphate |
−0.034 |
0.606 |
0.032 |
0.621 |
| Urine calcium/creatinine |
−0.088 |
0.187 |
−0.058 |
0.383 |
| Urine phosphate/creatinine |
−0.069 |
0.299 |
0.003 |
0.960 |
Abbreviations as in Table 1.
In the substudy analysis (Figure 2), total and free IS levels were significantly higher in non-transplant patients with CKD (0.34±0.23 mg/100 ml and 0.04±0.007 mg/100 ml, respectively) than in transplant recipients (0.21±0.17 mg/100 ml and 0.01±0.1 mg/100 ml; P=0.003 and <0.0001, respectively). It is noteworthy that the 2 populations were perfectly matched for age (mean age: 68±11 in both groups), sex and eGFR (mean (range) eGFR: 36.0±10.4 ml/min/1.73 m2
(17.2–58.8) in transplant recipients, and 35.6±12.1 ml/min/1.73 m2
(16.5–59.2) in CKD patients). Furthermore, there were no significant differences between non-transplanted CKD patients and transplanted CKD patients in terms of serum calcium (2.3±0.1 vs. 2.3±0.3 mmol/L, respectively; P=NS), serum albumin (38.6±5.7 vs. 36.6±5.3 g/L, respectively; P=NS) and serum 25(OH) D levels (18.9±9.4 vs. 18.7±13.7 ng/ml, respectively; P=NS).

During the follow-up period (mean duration: 113±29 months), there were 55 deaths (from CVD in 90% of cases, infectious disease in 5%, cancer in 3% and unknown causes in 2%), 70 CV events (myocardial infarction: 23%; hospitalization for angina: 15%; coronary revascularization: 11%: stroke: 8%; revascularization for lower limb arteriopathy: 10%; other reasons: 33%) and 71 graft losses (allograft nephropathy: 54%; acute rejection: 9%; non-specific causes: 37%). There were no correlations between the total and free IS levels at the time of transplantation on the one hand and graft survival, CV events or mortality on the other (Figure 3). Likewise, free and total IS levels at 1 and 12 months were not associated with overall mortality or the occurrence of CV events or graft loss (Figure 3). In our cohort, overall mortality and the occurrence of CV events were independently associated with age and time on dialysis, whereas graft loss was independently associated with age only (Tables 3,4).

Table 3.
Multivariate Cox Regression Analysis of Risk Factors at Baseline for All-Cause Mortality and the Occurrence of CV Events or Graft Loss in Kidney Transplant Recipients
| Event |
Free IS |
|
Total IS |
| RR (95% CI) |
P value |
RR (95% CI) |
P value |
| Overall mortality (n=55) |
| Model 1 |
|
|
Model 1 |
|
|
| ΔIS |
1.611 (0.221–11.715) |
0.638 |
ΔIS |
1.032 (0.788–1.352) |
0.819 |
| Model 2 |
|
|
Model 2 |
|
|
| Age |
1.069 (1.043–1.096) |
<0.001 |
Age |
1.065 (1.040–1.091) |
<0.001 |
| ΔIS |
3.188 (0.372–27.31) |
0.290 |
ΔIS |
1.115 (0.546–1.469) |
0.439 |
| Model 3 |
|
|
Model 3 |
|
|
| Age |
1.072 (1.045–1.099) |
<0.001 |
Age |
1.068 (1.042–1.094) |
<0.001 |
| Years on dialysis |
1.002 (1.000–1.004) |
0.036 |
Years on dialysis |
1.002 (1.000–1.004) |
0.051 |
| ΔIS |
3.234 (0.370–28.380) |
0.289 |
ΔIS |
1.109 (0.841–1.462) |
0.462 |
| CV events (n=70) |
| Model 1 |
|
|
Model 3 |
|
|
| ΔIS |
0.439 (0.074–2.609) |
0.365 |
ΔIS |
0.956 (0.754–1.213) |
0.710 |
| Model 2 |
|
|
|
|
|
| Age |
1.039 (1.017–1.061) |
<0.001 |
Age |
1.041 (1.020–1.063) |
<0.001 |
| ΔIS |
0.754 (0.123–4.616) |
0.760 |
ΔIS |
1.024 (0.805–1.303) |
0.844 |
| Model 3 |
|
|
|
|
|
| Age |
1.042 (1.020–1.064) |
<0.001 |
Age |
1.044 (1.022–1.066) |
<0.001 |
| Years on dialysis |
1.002 (1.000–1.003) |
0.019 |
Years on dialysis |
1.002 (1.000–1.003) |
0.018 |
| ΔIS |
0.743 (0.120–4.584) |
0.791 |
ΔIS |
1.098 (0.799–1.296) |
0.885 |
| Graft loss (n=71) |
| Model 1 |
|
|
|
|
|
| ΔIS |
0.809 (0.103–6.347) |
0.840 |
ΔIS |
1.059 (0.818–1.371) |
0.663 |
| Model 2 |
|
|
|
|
|
| Age |
0.980 (0.962–0.999) |
0.041 |
Age |
0.982 (0.964–1.001) |
0.062 |
| ΔIS |
0.698 (0.090–5.377) |
0.730 |
ΔIS |
1.026 (0.794–1.326) |
0.843 |
| Model 3 |
|
|
|
|
|
| Age |
0.981 (0.962–1.000) |
0.050 |
Age |
0.983 (0.964–1.002) |
0.073 |
| Years on dialysis |
1.000 (0.999–1.0002) |
0.657 |
Years on dialysis |
1.000 (0.999–1.002) |
0.665 |
| ΔIS |
0.699 (0.090–5.418) |
0.732 |
ΔIS |
1.026 (0.793–1.327) |
0.845 |
CI, confidence interval; ΔIS, difference between IS levels at T0 and those at M12; RR, relative risk. Other abbreviations as in Table 1.
Table 4.
Mixed Model Analysis of Risk Factors at Baseline for All-Cause Mortality and the Occurrence of CV Events or Graft Loss in Kidney Transplant Recipients
| Event |
Free IS |
|
Total IS |
| RR (95% CI) |
P value |
RR (95% CI) |
P value |
| Overall mortality (n=55) |
| Model 1 |
| Age |
1.071 (1.037–1.106) |
<0.001 |
Age |
1.069 (1.035–1.104) |
<0.001 |
| Years on dialysis |
1.030 (1.030–1.009) |
0.0049 |
Years on dialysis |
1.029 (1.008–1.051) |
0.0064 |
| CKD stage |
2.135 (1.437–3.174) |
0.0002 |
ΔIS |
2.092 (1.396–3.134) |
0.0003 |
| CV events (n=70) |
| Model 2 |
| Age |
1.044 (1.018–1.070) |
0.0009 |
Age |
1.043 (1.018–1.070) |
0.0008 |
| Years on dialysis |
1.024 (1.002–1.047) |
0.0343 |
Years on dialysis |
1.024 (1.002–1.047) |
0.0346 |
| Graft loss (n=71) |
| Model 3 |
| Age |
0.984 (0.959–1.009) |
0.2178 |
Age |
0.984 (0.959–1.009) |
0.2082 |
| CKD stage |
1.452 (0.983–2.144) |
0.0612 |
ΔIS |
1.434 (0.969–2.122) |
0.0712 |
Abbreviations as in Tables 1,3.
Discussion
The present study of 311 kidney transplant recipients is the first to demonstrate that serum IS levels fall significantly within 1 month of kidney transplantation and that this decrease persists at 1 year. We found that total and free IS levels were significantly lower in transplant recipients than in non-recipients matched for age, sex and eGFR. There was no relationship between IS levels and eGFR at M1 or M12. Most importantly, IS levels were not associated with overall mortality, the occurrence of CV events or graft loss.
Our results thus demonstrate that (1) kidney transplantation normalized levels of at least one prototypic protein-bound uremic toxin and (2) this normalization persisted until at least 12 months after transplantation. In contrast to the absence of a correlation between IS and eGFR in the current study, the only previous study of protein-bound uremic toxins in kidney transplant patients (by Huang et al15) found that IS levels were significantly higher in individuals with advanced CKD than in those with less advanced CKD. In the present study, we did not observe a correlation between IS levels and eGFR. However, Huang et al’s study was based on a small sample size (n=95, vs. 311 in the present study) and mainly included patients with stage 2 (36.8%) and stage 3 (48.4%) CKD. Furthermore, we evaluated IS levels up to 12 months after kidney transplantation at fixed time points, whereas the mean time since transplantation in Huang et al’s study was 5.3±4.9 years. The absence of correlation between IS levels and eGFR might also be related to the fact that the GFR (of which eGFR is a surrogate) has little effect on renal clearance of IS (which in fact mainly depends on tubule function).19
Even more strikingly, we found that total and free IS levels were significantly lower in transplant recipients than in non-recipients with CKD matched for age, sex and eGFR, suggesting that kidney transplantation and/or events related to transplantation (including the administration of immunosuppressive drugs) can influence uremic toxin levels. Serum levels of uremic retention solutes are conditioned by both generation and elimination. IS results from the metabolic activity of colon microbes. Recently, Fricke et al20
studied changes over time in the urinary, oral and rectal microbiota of kidney transplant recipients prior to transplantation and then 1 and 6 months afterwards. The researchers observed marked, persistent changes in the composition of the microbiota as a result of transplantation and the associated medications. Similarly, a recent pilot study of serial fecal specimens (n=85) collected from 26 kidney transplant recipients over the first 3 months after transplantation revealed significant post-transplantation alterations in the gut microbiota.21
Hence, a possible explanation for our findings is that the decrease in protein-bound uremic toxin levels may be related to reduced microbial production. Given that neither of the abovementioned studies compared transplant recipients and non-receipts with similar degrees of CKD or looked at potential correlations with uremic toxin levels, it would be interesting to assess these aspects in more depth.
Furthermore, antimicrobial therapy is likely to alter the composition of the gut microbiota and thus modify uremic toxin generation. Indeed, in a study of 11 patients on peritoneal dialysis, Poesen et al reported that antibiotics decreased the intestinal generation of microbiota-derived uremic toxins (Abstract Poesen et al. American Society of Nephrology Congress FR-PO282, 2014). Likewise, in patients having undergone allogeneic stem cell transplantation, the loss of bacterial diversity during courses of antibiotic treatment was associated with a decrease in mean IS levels in the urine.22
In the present study, the majority of patients were treated with antibiotics for the first 6 months after transplantation (to prevent
Pneumocystis carinii
infections). However, the decrease in IS levels persisted at month 12 (ie, 6 months after the withdrawal of prophylactic antibiotic treatment).
Other factors with a potential role include a decrease in sulfotransferase activity (responsible for sulfate conjugation of IS) or modulation of organic acid transporters (OATs), both of which have been linked to the administration of a number of drugs and other chemicals.23–27
However, we are not aware of any studies on the modulation of sulfotransferase or OAT activity by compounds involved in the transplantation process.
It is important to note that although all our patients suffered from CKD, the surprisingly low concentrations of IS make it unlikely that this molecule would have contributed to the CV risk (at least not in the immediate post-transplant stage). Accordingly, our study is the first to demonstrate a lack of association between IS levels (at the time of transplantation and then 1 and 12 months afterwards) and overall mortality, CV events or graft loss. Hence, adverse events after transplantation are influenced by factors other than the levels of protein-bound uremic toxins in the first year after transplantation.
Interestingly, IS levels at the time of transplantation were not predictive of hard outcomes, even although the levels were well above the normal range. Apart from the decrease in IS concentration per se, it is possible that transplantation and/or the administration of immunosuppressive drugs can provide additional protection against IS toxicity. IS may have a key role in harmful cardiac remodeling mediated by activation of nuclear factor-κB (NF-κB) pathways.28
It is known that the anti-inflammatory activity of both corticosteroids and cyclosporine A is partly related to inhibition of NF-κB signaling. Hence, one can hypothesize that immunosuppressive therapy protects against the harmful effects of IS by blocking inflammatory pathways.
Study Limitations
These include its single-center design and the use of eGFR for estimation of kidney function, which might not be accurate enough in patients with low renal function; eGFR may diverge from the true GFR and does not reflect the function of the tubules (which are responsible for clearance of IS). The study’s main strengths are the comparison of IS levels in transplant receipts and non-recipients, and the recording of hard outcomes during patient follow-up.
Conclusions
Our present results show that IS levels fall significantly 1 month after kidney transplantation and that this decrease persists for at least 12 months. At 12 months after kidney transplantation, free and total IS levels were significantly lower in recipients that in CKD patients matched for age, sex and renal function, suggesting that kidney transplantation protects against an increase in IS levels, perhaps via the modulation of IS production. Interestingly, we failed to confirm the findings of previous studies in dialysis and predialysis populations, in which elevated IS levels were strongly associated with CVD, CKD progression, and mortality. In our well-characterized cohort of kidney transplant patients, IS levels at the time of transplantation and 1 and 12 months afterwards were not predictive of mortality, CV events or graft loss. Hence, adverse events after transplantation are mainly influenced by factors other than the IS level during the first year post-transplantation. In transplant recipients, the CV risk does not appear to be related to IS toxicity. Hence, studies of other uremic toxins in the same population are now mandatory. Lastly, characterization of the mechanisms that underlie the post-transplantation fall in IS levels might facilitate the development of strategies other than kidney transplantation for decreasing uremic toxin concentrations.
References
- 1.
Collins AJ, Foley RN, Herzog C, Chavers B, Gilbertson D, Herzog C, et al. US renal data system 2012: Annual data report. Am J Kidney Dis 2013; 61: A7, e1–e476, doi:10.1053/j.ajkd.2012.11.031.
- 2.
Vanholder R, Massy Z, Argiles A, Spasovski G, Verbeke F, Lameire N; European Uremic Toxin Work Group. Chronic kidney disease as cause of cardiovascular morbidity and mortality. Neprol Dial Transplant 2005; 20: 1048–1056.
- 3.
Chronic Kidney Disease Prognosis Consortium,
Matsushita K, van der Velde M, Astor BC, Woodward M, Levey AS, de Jong PE, et al. Association of estimated glomerular filtration rate and albuminuria with all-cause and cardiovascular mortality in general population cohorts: A collaborative meta-analysis. Lancet 2010; 375: 2073–2081.
- 4.
Vanholder R, De Smet R, Glorieux G, Argiles A, Baurmeister U, Brunet P, et al. Review on uremic toxins: Classification, concentration, and interindividual variability. Kidney Int 2003; 63: 1934–1943.
- 5.
Lekawanvijit S. Role of gut-derived protein-bound uremic toxins in cardiorenal syndrome and potential treatment modalities. Circ J 2015; 79: 2088–2097.
- 6.
Yamazaki H, Yamaguchi K, Soeki T, Wakatsuki T, Niki T, Taketani Y, et al. Impact of indoxyl sulfate, a uremic toxin, on non-culprit coronary plaque composition assessed on integrated backscatter intravascular ultrasound. Circ J 2015; 79: 1773–1779.
- 7.
Yoshikawa D, Ishii H, Suzuki S, Takeshita K, Kumagai S, Hayashi M, et al. Plasma indoxyl sulfate and estimated glomerular filtration rate. Circ J 2014; 78: 2477–2482.
- 8.
Liabeuf S, Neirynck N, Drueke TB, Vanholder R, Massy ZA. Clinical studies and chronic kidney disease: What did we learn recently? Semin Nephrol 2014; 34: 164–179.
- 9.
Claes KJ, Bammens B, Kuypers DR, Meijers B, Naesens M, Sprangers B, et al. Time course of asymmetric dimethylarginine and symmetric dimethylarginine levels after successful renal transplantation. Neprol Dial Transplant 2014; 29: 1965–1972.
- 10.
Massy ZA. Cardiovascular risk factors in kidney transplantation. Curr Opin Urol 2001; 11: 139–142.
- 11.
Vanholder R, Schepers E, Pletinck A, Nagler EV, Glorieux G. The uremic toxicity of indoxyl sulfate and p-cresyl sulfate: A systematic review. J Am Soc Nephrol 2014; 25: 1897–1907.
- 12.
Wu IW, Hsu KH, Lee CC, Sun CY, Hsu HJ, Tsai CJ, et al. P-cresyl sulphate and indoxyl sulphate predict progression of chronic kidney disease. Neprol Dial Transplant 2011; 26: 938–947.
- 13.
Barreto FC, Barreto DV, Liabeuf S, Meert N, Glorieux G, Temmar M, et al. Serum indoxyl sulfate is associated with vascular disease and mortality in chronic kidney disease patients. Clin J Am Soc Nephrol 2009; 4: 1551–1558.
- 14.
Melamed ML, Plantinga L, Shafi T, Parekh R, Meyer TW, Hostetter THE, et al. Retained organic solutes, patient characteristics and all-cause and cardiovascular mortality in hemodialysis: Results from the retained organic solutes and clinical outcomes (rosco) investigators. BMC Nephrol 2013; 14: 134.
- 15.
Huang ST, Shu KH, Cheng CH, Wu MJ, Yu TM, Chuang YW, et al. Serum total p-cresol and indoxyl sulfate correlated with stage of chronic kidney disease in renal transplant recipients. Transplant Proc 2012; 44: 621–624.
- 16.
Liabeuf S, Barreto DV, Barreto FC, Meert N, Glorieux G, Schepers E, et al. Free p-cresylsulphate is a predictor of mortality in patients at different stages of chronic kidney disease. Neprol Dial Transplant 2010; 25: 1183–1191.
- 17.
Liabeuf S, Glorieux G, Lenglet A, Diouf M, Schepers E, Desjardins L, et al. Does p-cresylglucuronide have the same impact on mortality as other protein-bound uremic toxins? PLoS One 2013; 8: e67168, doi:10.1371/journal.pone.0067168.
- 18.
Barreto FC, Barreto DV, Liabeuf S, Meert N, Glorieux G, Temmar M, et al. Serum indoxyl sulfate is associated with vascular disease and mortality in chronic kidney disease patients. Clin J Am Soc Nephrol 2009; 4: 1551–1558.
- 19.
Lowenstein J. The anglerfish and uremic toxins. FASEB J 2011; 25: 1781–1785.
- 20.
Fricke WF, Maddox C, Song Y, Bromberg JS. Human microbiota characterization in the course of renal transplantation. Am J Transplant 2014; 14: 416–427.
- 21.
Lee JR, Muthukumar T, Dadhania D, Toussaint NC, Ling L, Pamer E, et al. Gut microbial community structure and complications after kidney transplantation: A pilot study. Transplantation 2014; 98: 697–705.
- 22.
Holler E, Butzhammer P, Schmid K, Hundsrucker C, Koestler J, Peter K, et al. Metagenomic analysis of the stool microbiome in patients receiving allogeneic stem cell transplantation: Loss of diversity is associated with use of systemic antibiotics and more pronounced in gastrointestinal graft-versus-host disease. Biol Blood Marrow Transplant 2014; 20: 640–645.
- 23.
Burchell B, Coughtrie MW. Genetic and environmental factors associated with variation of human xenobiotic glucuronidation and sulfation. Environ Health Perspect 1997; 105(Suppl 4): 739–747.
- 24.
Saigo C, Nomura Y, Yamamoto Y, Sagata M, Matsunaga R, Jono H, et al. Meclofenamate elicits a nephropreventing effect in a rat model of ischemic acute kidney injury by suppressing indoxyl sulfate production and restoring renal organic anion transporters. Drug Des Dev Ther 2014; 8: 1073–1082.
- 25.
Matsuzaki T, Watanabe H, Yoshitome K, Morisaki T, Hamada A, Nonoguchi H, et al. Downregulation of organic anion transporters in rat kidney under ischemia/reperfusion-induced acute [corrected] renal failure. Kidney Int 2007; 71: 539–547.
- 26.
Liu S, Wang BH, Kompa AR, Lekawanvijit S, Krum H. Antagonists of organic anion transporters 1 and 3 ameliorate adverse cardiac remodelling induced by uremic toxin indoxyl sulfate. Int J Cardiol 2012; 158: 457–458.
- 27.
Kusumoto M, Kamobayashi H, Sato D, Komori M, Yoshimura M, Hamada A, et al. Alleviation of cisplatin-induced acute kidney injury using phytochemical polyphenols is accompanied by reduced accumulation of indoxyl sulfate in rats. Clin Exp Nephrol 2011; 15: 820–830.
- 28.
Lekawanvijit S, Adrahtas A, Kelly DJ, Kompa AR, Wang BH, Krum H. Does indoxyl sulfate, a uraemic toxin, have direct effects on cardiac fibroblasts and myocytes? Eur Heart J 2010; 31: 1771–1779.
