Abstract
Background:
Ventricular non-compaction is characterized by a thin layer of compact ventricular myocardium and it is an important abnormality in the mouse heart. It is reminiscent of left ventricular non-compaction, a fairly common human congenital cardiomyopathy. Non-compaction in transgenic mice has been classically evaluated by measuring the thickness of the compact myocardium through histological techniques involving image analysis of 2-dimensional (D) sections. Given the 3D nature of the heart, the aim of this study was to determine whether a technique for the non-destructive, 3D assessment of the mouse embryonic compact myocardium could be developed.
Methods and Results:
Micro-computed tomography (micro-CT), in combination with iodine staining, enabled the differentiation of the trabecular from the compact myocardium in wild-type mice. The 3D and digital nature of the micro-CT data allowed computation anatomical techniques to be readily applied, which were demonstrated via construction of group atlases and atlas-based descriptive statistics. Finally, micro-CT was used to identify the presence of non-compaction in mice with a deletion of the cell cycle inhibitor protein, p27Kip1.
Conclusions:
Iodine staining-enhanced micro-CT with computational anatomical analysis represents a valid addition to classical histology for the delineation of compact myocardial wall thickness in the mouse embryo. Given the quantitative 3D resolution of micro-CT, these approaches might provide helpful information for the analysis of non-compaction.
The mammalian embryonic cardiac ventricles are composed of an outer layer of compact myocardium and an inner layer of trabecular myocardium.1,2
During development, compact myocardium increases in thickness while trabeculations almost completely disappear. The persistence of a thin compact myocardium with deep intertrabecular recesses is termed ventricular non-compaction in mice, and left ventricular non-compaction (LVNC) in humans.3–6
LVNC is a relatively common and severe genetic cardiomyopathy,7–10
in which approximately 50% of patients show biventricular involvement.4,11,12
Often, transgenic mice have been utilized to study LVNC.13,14
Detailed and accurate quantification of compaction in these mice is essential to define the phenotype.
Morphological analyses of the compact myocardium have been traditionally performed through histological techniques involving image analysis of cardiac sections stained with hematoxylin and eosin (H&E).15–25
As histological sections are inherently 2 dimensional (D), whereas the heart is a 3D structure, 3D morphology could represent an additional valid source of information for ventricular non-compaction in transgenic mice. Although it is possible to use computation techniques including image registration and distortion correction to reconstruct the 3D cardiac morphology from stacked 2D sections,26
the processes are technically demanding, laborious and time-consuming. Moreover, the 3D reconstructions still rely on 2D sections, whose destructive nature precludes their use for in vivo or in situ assessment.
Non-invasive, non-destructive 3D imaging of myocardial compaction in the embryonic mouse heart is faced with two technical challenges. First, an imaging modality with the appropriate combination of tissue penetration, contrast and spatial resolution needs to be identified. The spatial resolution of magnetic resonance imaging (MRI) and computed tomography (CT) has reached microscopic scales (1 s and 10 s of µm), and the use of exogenous contrast agents has allowed once undetectable organs to be clearly delineated. Micro-CT, in conjunction with iodine-staining, has been successfully used for the qualitative evaluation of the overall structure of the embryonic mouse heart.27–29
Although its spatial resolution does not compare to conventional histology and the latest optical techniques such as confocal microscopy30
and optical projection tomography,31
micro-CT provides a reasonable trade-off between accessibility, speed of image acquisition, anatomical details that can be captured, and the potential for non-invasive in utero imaging. The second challenge relates to post-imaging analysis, especially quantitative measurements suitable for consistent group analysis, due to the shear size of 3D image data (typically hundreds of thousands of voxels) and the difficulty of defining anatomically equivalent voxels. Recently, several mathematical frameworks have been developed for image warping, cross-registration and the construction of “atlases”,32,33
which are essentially the average size and shape of the group. Atlas-based group analysis in turn utilizes atlases as common coordinate systems for performing descriptive statistics within or between image groups. Image atlases have been used for the brain and heart in both humans34
and animals,35
but to the best of our knowledge, they have not yet been applied to quantitative studies of the embryonic mouse heart.
Here, we show that micro-CT can quantify compact myocardium thickness during cardiac development while also offering 3D measurements. We also find that micro-CT can identify non-compaction in mice with germline deletion of the cell cycle inhibitor protein, p27Kip1
(Cdkn1b
gene, but for simplicity henceforth, p27 identifies the protein and
p27
the gene). This model was chosen because although deletion of
p27
has been shown to increase post-natal heart size and total number of cardiomyocytes,36
the embryonic cardiac ventricular phenotype of these mice is unknown, and we have previously shown that p27 might be mediating some of the roles of the scaffold adapter protein, 14-3-3ε (Ywhae
gene), in myocardial compaction.25
Methods
Animal Model
All animal protocols and handlings were approved by the University of Utah Institutional Animal Care and Use Committee.
p27–/–
mice (B6.129S4-
Cdkn1btm1Mlf/J; stock number 002781) were obtained from The Jackson Laboratory and maintained in a C57BL/6 inbred background (The Jackson Laboratory, Bar Harbor, ME, USA). Genotyping was performed by polymerase chain reaction (PCR) using the following primers: mgk3: TGG AAC CCT GTG CCA TCT CTA T and Neo1: CCT TCT ATC GCC TTC TTG ACG for 700 bp mutant allele; mgk3 and p27Rev: CCA GTC TCA GTT CAT GAG AAC C for 930 bp wild-type allele. Whole e12.5 embryos for both wild-type (WT, N=6) and knockout (KO, N=7) mice, and e18.5 dissected intact hearts (WT, N=7) were collected by cesarean section. For comparative purposes, additional e12.5 embryos (N=3 WT and N=3 KO) were obtained for histological analysis.
H&E Staining and Measurement of Compact Myocardium Thickness
H&E staining was performed, as previously described, except for using 4% paraformaldehyde (PFA)-phosphate buffer saline (PBS) instead of 10% buffered formalin as a fixative.25
Representative sections for each genotype (N=3 WT and N=3 KO) were collected from multiple litters. ImageJ (U.S. National Institutes of Health, Bethesda, MD, USA) was used to measure the thickness of the compact myocardium, as previously described.25
Specimen Preparation for Micro-CT
In preparation for imaging, the specimens were fixed with freshly prepared 4% PFA in PBS at 4℃ overnight. Subsequently, to achieve the soft tissue contrast required for imaging the embryonic ventricular wall, the specimens were soaked in 25% Lugol’s iodine solution (Electron Microscopy Sciences, Hatfield, PA, USA) at room temperature for 3 days, with periodic gentle agitation to ensure even staining. To minimize motion that could cause pronounced artifact in high-resolution imaging, the stained specimens were individually embedded in paraffin and stored at room temperature until use.
Micro-CT and Post-Processing
For efficiency, the prepared specimens were imaged in batches, 6–8 specimens at a time, on a Siemens Inveon micro-CT instrument (Siemens Medical Solutions, Knoxville, TN, USA), using the following scan parameters: 80 KVp X-ray source voltage, 100 µA current, 3 s exposure time, 801 evenly spaced projections spanning 360°, 19.6×25.3 mm (radial and axial) field-of-view. The total imaging time for each scan was approximately 2 h. Following acquisition, the data was reconstructed to yield 3D image volumes of 2016×2016×2592 matrix size, equivalent to a 9.7-µm isotropic voxel size.
Post-processing and analyses of the image data were performed using Amira (version 5.4.3; VSG, Konrad-Zuse-Zentrum, Berlin, Germany), and custom scripts were written in MATLAB (release R2012b; The MathWorks, Inc, Natick, MA, USA).
3D Thickness Measurements
For each heart, the compact myocardium, which appeared hyperintense in the myocardial wall, was digitally segmented based on objective criteria to avoid potential bias. To this end, the compact myocardium was defined as a myocardial region that had at least 50% of the maximum intensity of the overall ventricular myocardial region. The inner and outer surfaces of the compact myocardium were delineated. Using Amira’s ‘SurfaceThickness’ module, the compact wall thickness, specifically the distances between the outer and inner wall surfaces, was then automatically obtained at approximately 1,000 uniformly distributed locations for each of the free walls of the cardiac right and left ventricles (RV and LV), excluding the septal wall.
2D vs. 3D Morphological Analysis
Simulating 2D Slices
The availability of 3D image data provided a unique opportunity to evaluate the adequacy of morphological quantifications from 2D slices, as was done in conventional histology. Sources of concern in the latter have been the accurate placement and orientation of the section in the absence of
a priori
3D whole heart morphology, and in inferring information of the whole heart from limited measurements. Therefore, to assess the effects of non-ideal slice placement and orientation, three 2D bi-ventricular slices were generated from the 3D image of each heart, as described in
Figure S1.
Figure S1A
represents the “ideal” section obtained parallel to the cardiac long axis at the mid-point of the septum that bisected both LV and RV, whereas (Figure S1B) depicts an “off-center” section obtained parallel to the ideal section offset randomly by 10% of the cardiac short-axis diameter anteriorly or posteriorly, and (Figure S1C) represents an “oblique” section passing through the septal mid-point at the equatorial plane but randomly tilted by 10°.
Cardiac Morphological Quantification Using 2D Slices
Similar to traditional histological measurements, for each simulated section, the widths of the ventricular-free walls (for both LV and RV) were measured at 4 equally spaced locations between the base and apex. As shown in
Figure S2, the combined RV and LV cavity volume was estimated by computing the volume of the hemi-ellipsoid that had the same depth and cross-section width as the distances between the equatorial short-axis plane and the inner surface of the cardiac apex, and between the inner surfaces of the LV and RV, respectively.
Atlas-Based Group Analysis
Atlases (‘atlas’ here and thereafter implies the average morphological shape) were constructed for each e12.5 WT, e12.5 KO and e18.5 WT heart group using AtlasWerks (SCI Institute, UT, USA), as described previously,37
based on unbiased large deformations diffeomorphic metric mapping (LDDMM), which uniquely allowed infinite degrees of freedom of deformation and hence bi-directional or reversible (source-to-target as well as target-to-source) registration. The atlas generation process involved the following 3 major steps:
1) Binary templates of the compact myocardium were obtained via intensity thresholding, as described above from the constituent 3D image volumes of each group;
2) An energy cost (ie, penalty) function, specifically summed Sobelov norm of the deformation fields and the L2 norm of the difference between the image and the atlas, was used to quantify the amount of coordinate transformation (or warping) required to match the binary template to the initial and subsequent estimates of the atlas; and
3) The atlas was obtained by iteratively finding the solution that required the minimum combined energy to warp all binary images onto the atlas.
Because the warping to and from the individual constituent images has been completely determined, the atlas serves as a convenient coordinate system for reporting intra-group statistics as well as performing inter-group comparisons. To demonstrate the utility of atlas-based image analysis, the following steps were undertaken:
1) Atlases for each e12.5 wild-type and knockout groups were generated, and the compact wall thickness of each heart was mapped onto the corresponding location in the corresponding atlas;
2) For each ventricular location, numerical means and standard deviations of the wall thickness were then computed and displayed as false color intensity on the atlas coordinate system; and
3) Finally, to provide the common spatial coordinates necessary for proper inter-group comparison, the atlas of the e12.5 knockout group was warped onto that of the wild type group, and the difference of the compact myocardial thickness between the group means was determined and displayed on the latter coordinate system for visualization.
Statistical Analysis
The micro-CT-based RV and LV wall thicknesses (ie, the 3D wall thickness measurements) within each e12.5 and e18.5 WT group were compared using 2-tailed paired Student’s
t-tests. In order to assess the efficacy of 3D measurements to distinguish compaction from non-compaction, group means of morphological measurements (compact myocardial wall thicknesses and bi-ventricular volume), and atlas-based location-by-location means of wall thicknesses, between e12.5 WT and KO hearts were compared by using 2-tailed Student’s t-tests. Differences of means with P-values of less than 0.05 were considered statistically significant. The wall thicknesses in different locations were assumed to behave independently of one another, thus no multiple-comparison correction was applied.
Results
Iodine-Enhanced Micro-CT Can Differentiate Compact From Trabecular Myocardium
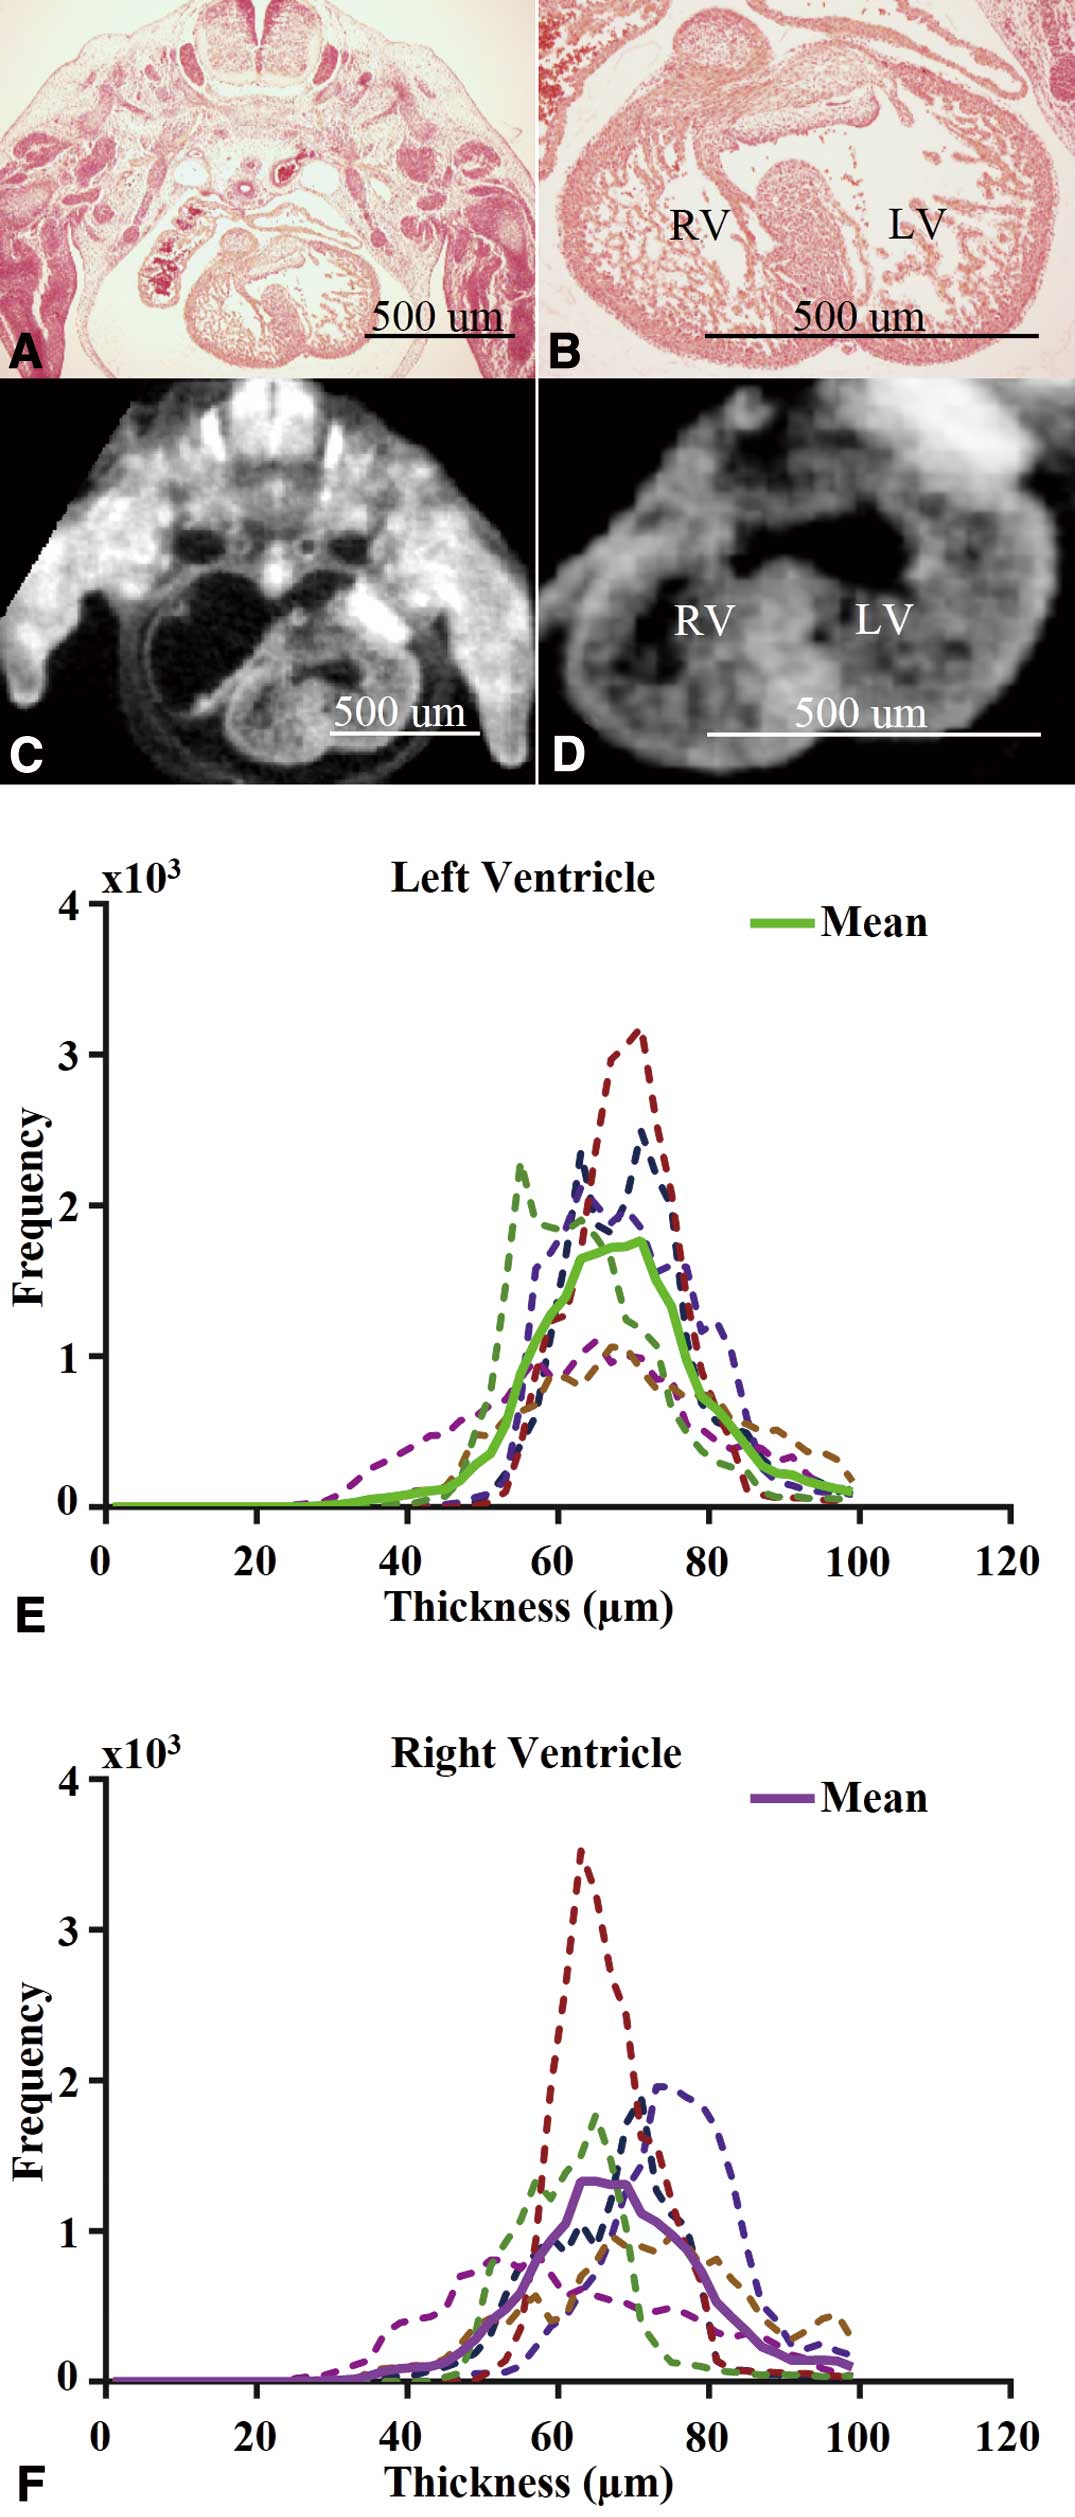
In agreement with histological analysis, iodine-enhanced micro-CT allowed the spatial differentiation of trabecular and compact myocardium in wild-type mouse hearts at e12.5 (Figures 1A–D). Specifically, the trabecular and compact myocardial layers were differentiable as semi- and hyper-intense regions, respectively. Although micro-CT had lower spatial resolution, the delineable gross morphology of the heart was relatively similar to histology and sufficient for quantification of specific features, especially the compact myocardial thickness, while the semi-intense regional trabecular myocardium was difficult to delineate precisely.
Quantitative 3D Characterization of the Compact Myocardium
The steps involved in the post-imaging analysis include short-axis slice extraction (Figures S3A,B), digital contrast adjustment (Figures S3C,D) and segmentation (Figures S3E,F); while quantification included 3D surface rendering of the segmented compact myocardium (Figure S3G) and wall thickness determination (Figure S3H). Wall thickness histograms indicated that even with the frequency of distribution being higher for the LV, the thicknesses of LV and RV compact myocardium have similar means (‘mean’ here and elsewhere implies arithmetic mean) and variability.
To compare the thickness of the RV and LV compact myocardium, we analyzed 6 wild-type hearts at e12.5. The overall compact myocardium thickness distributions of both ventricles appeared relatively Gaussian (Figures 1E,F). The intra-specimen and inter-specimen variability in terms of wall thickness, as represented by the ratio of the standard deviation and mean of the measurement, were both approximately 15% (Figures 1E,F). Specifically, the group mean and standard deviation was 67.6 µm and 12 µm for the RV wall thickness, and 67.1 µm and 11 µm for the LV wall thickness. The difference in group means of compact myocardium thickness between the RV and LV was not significant (P>0.05). We also reported measurements using different 2D methods (see
Figure S1
for details) to compare them to 3D measurements (Table S1). The compact myocardium thickness exhibited wide variation of the group mean error measurements compared to 3D measurements, ranging from less than 1% (0.71%) for the LV using the “oblique” method, to 10.42% for the RV via the “offset” approach. In contrast, the root mean square (RMS) error was relatively constant between 10% (10.12%) to 17% (17.26%), which is comparable to the standard deviation observed for the 3D compact myocardium thickness histograms in
Figure 1. The fact that the RMS error of 2D measurements is comparable to the standard deviation of our 3D measurements suggests that accurate 2D measurements are dependent on the ability to make slices at the correct location and orientation. For estimates of the bi-ventricular volume, both the variation in the group mean error and the RMS error were considerably larger, with RMS at approximately 36% (36.35%) of the true 3D volume, which is not unexpected because it is based on the assumption of a simplified geometry of the ventricle (ellipsoid shape).
Generation of a 3D Morphological Atlas for the Analysis of Regional Compaction Differences
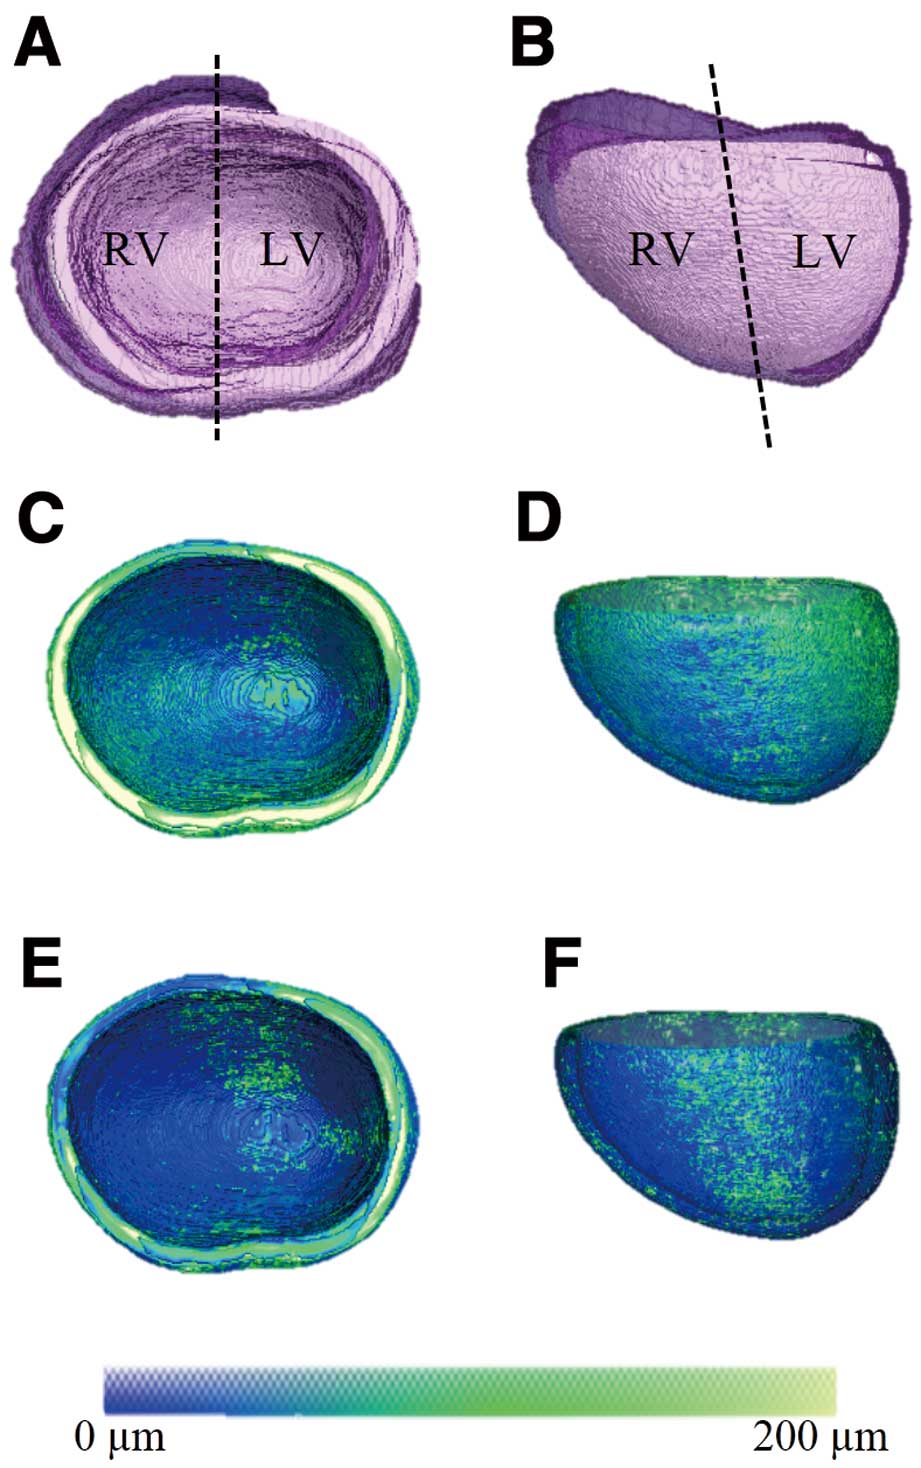
To test whether 3D atlases could be used for performing descriptive statistics within or between groups of mice with different compact myocardium thicknesses, we started by computing the atlas for the compact myocardium in e12.5 wild-type hearts (Figure 2). The morphological atlas computed for the compact myocardium was overlaid on semi-transparent renderings of individual hearts (Figures 2A,B). The fact that the atlas lied well within the span of individual hearts supported the validity of the atlas construction methodology. We also computed the means of the compact myocardial thickness obtained for each matching location displayed in false color on the atlas coordinate system (Figures 2C,D), as well as the standard deviation representing the variability of the compact myocardial thickness at each location (Figures 2E,F). These atlas-based group statistics indicated that, except for a few isolated regions (eg, the apex), the compact wall thickness and its variability among specimens in the group are relatively uniform throughout the myocardium.
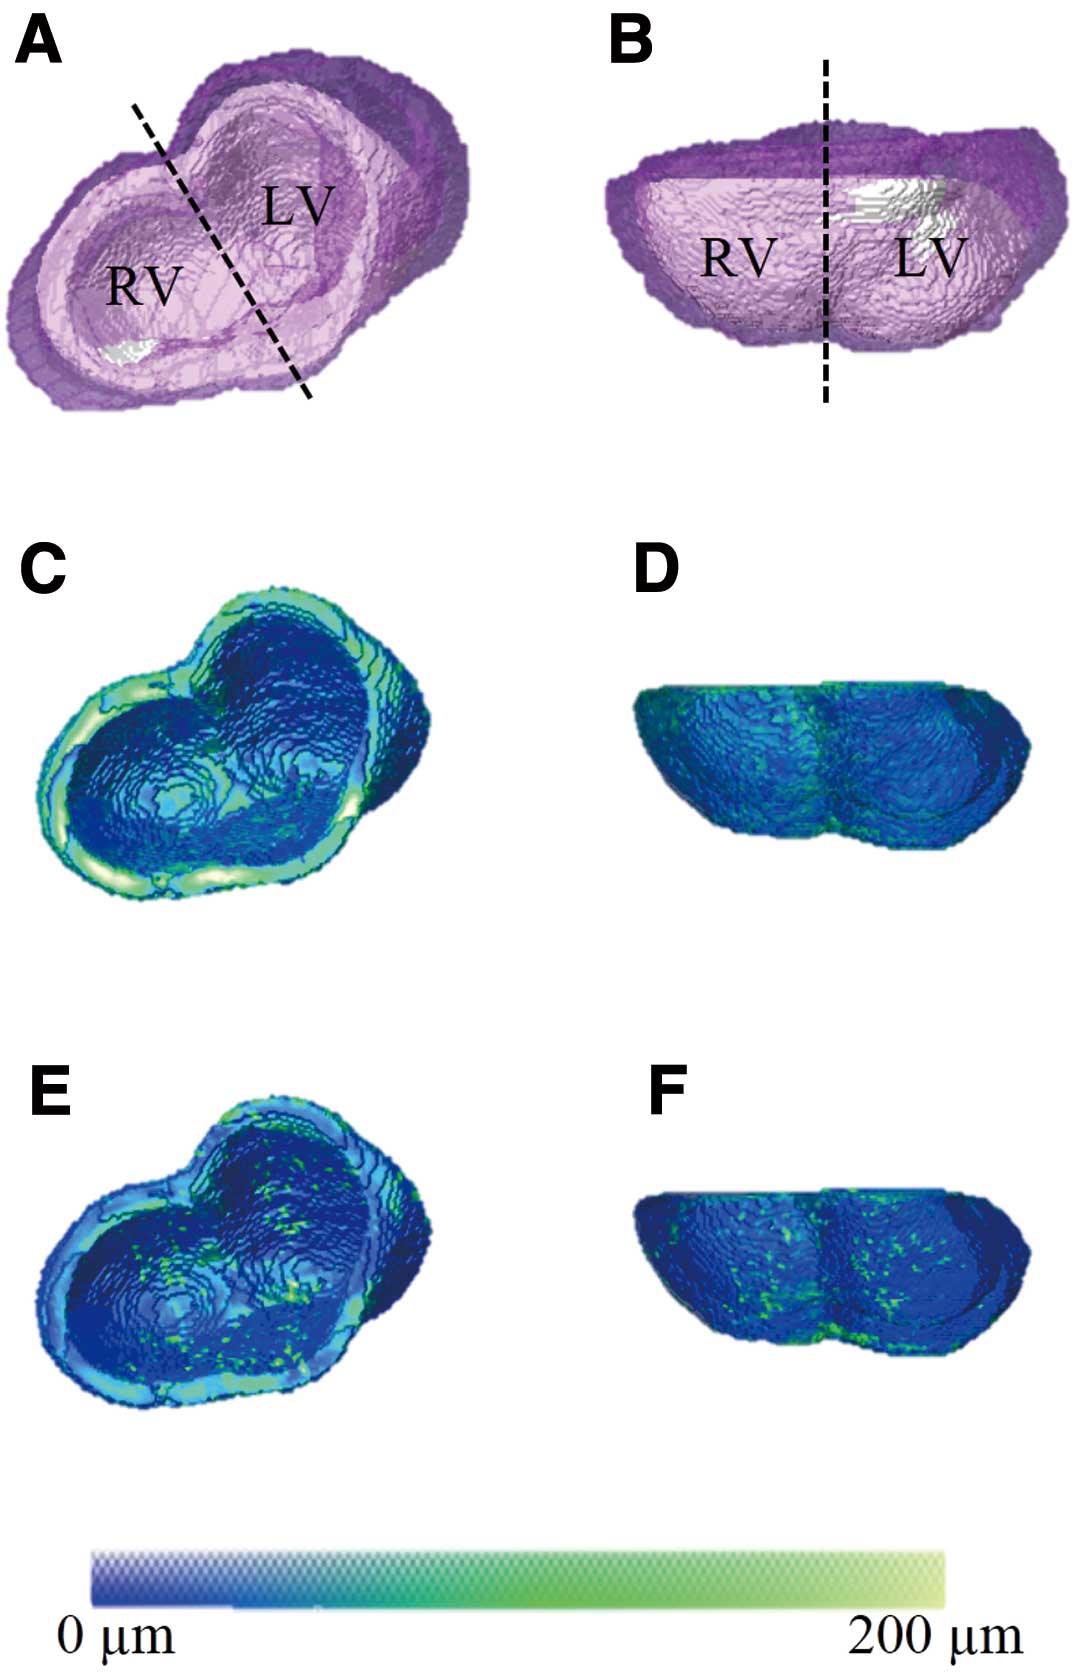
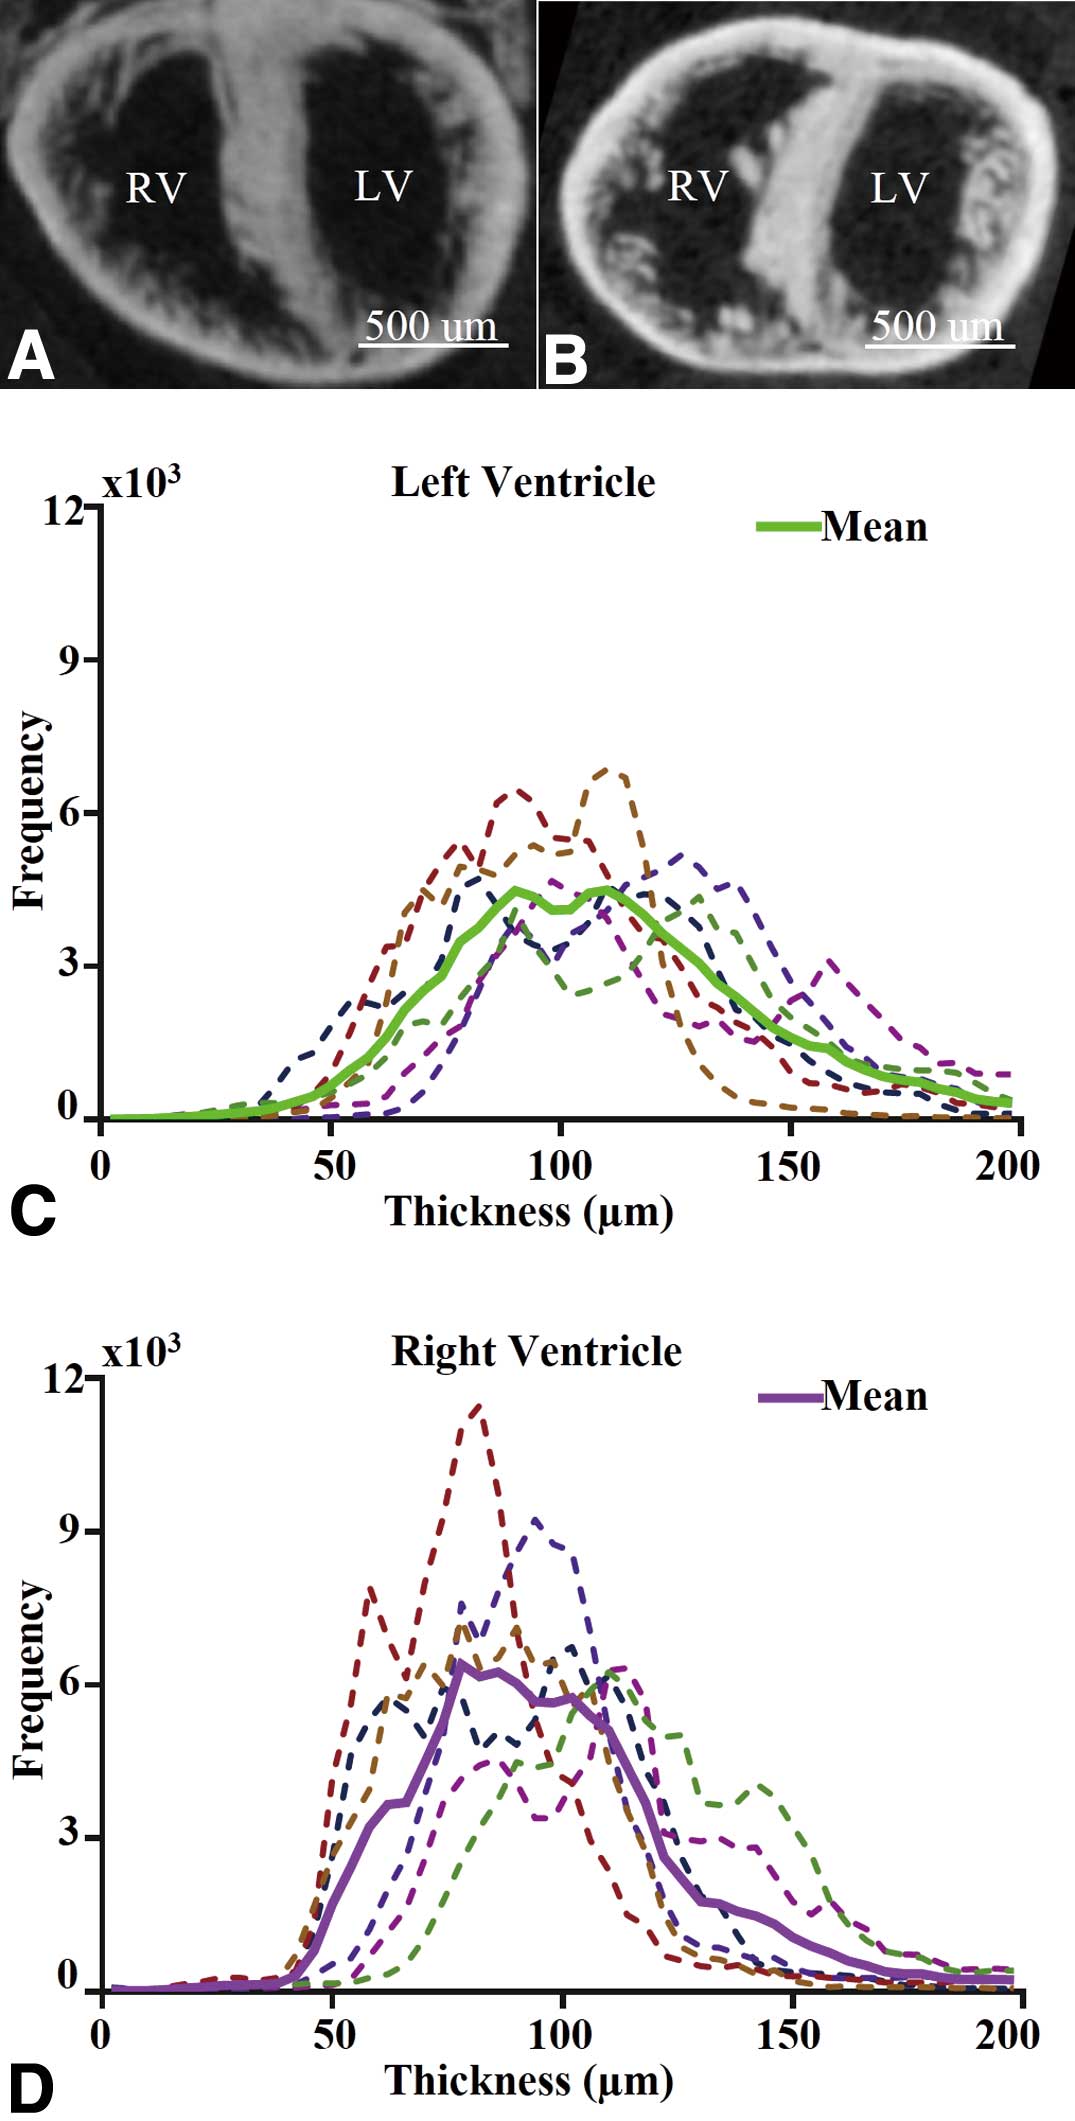
To assess whether micro-CT can capture the known morphological changes associated with development, we analyzed e18.5 wild-type hearts (Figures 3A,B). We compared micro-CT-based RV vs. LV compact wall thickness measurements (Figures 3C,D), and constructed the morphological atlas for the group (Figure 4). We also compared 2D with 3D measurements of compact myocardium thickness and bi-ventricular volume (Table S2). Except for the expected larger wall thickness and heart size, the findings from the group (eg, intra-specimen variability, uniformity of the compact wall thickness) were generally comparable to those aforementioned at e12.5. However, the difference in group means of ventricular myocardial thickness between RV and LV at e18.5 was statistically significant (P=0.04), with the LV being slightly thicker than the RV.
Micro-CT Allows the Quantification of Non-Compaction in
p27–/–
Hearts
To determine whether micro-CT might allow for the analysis of genetically modified mice, we tested e12.5
p27–/–
hearts. In addition to comparing histological analysis with iodine-enhanced micro-CT and showing that micro-CT again allowed the spatial differentiation of trabecular and compact myocardium (Figures 5A–D), we analyzed the compact myocardium thickness distributions of both ventricles (Figures 5E,F), and built an atlas to facilitate the quantitative 3D comparison of compact myocardium thickness in different ventricular regions (Figure 6). Moreover, the quantified RV and LV compact myocardial wall thicknesses and bi-ventricular volumes were tabulated and compared to e12.5 wild-type hearts (Table;
Figure S4). This analysis showed that, although the difference in the bi-ventricular volumes is not significant, the thicknesses of the compact RV and LV myocardium in e12.5
p27–/–
are significantly decreased compared to wild types. To better understand differences, we compared 3D atlases between
p27–/–
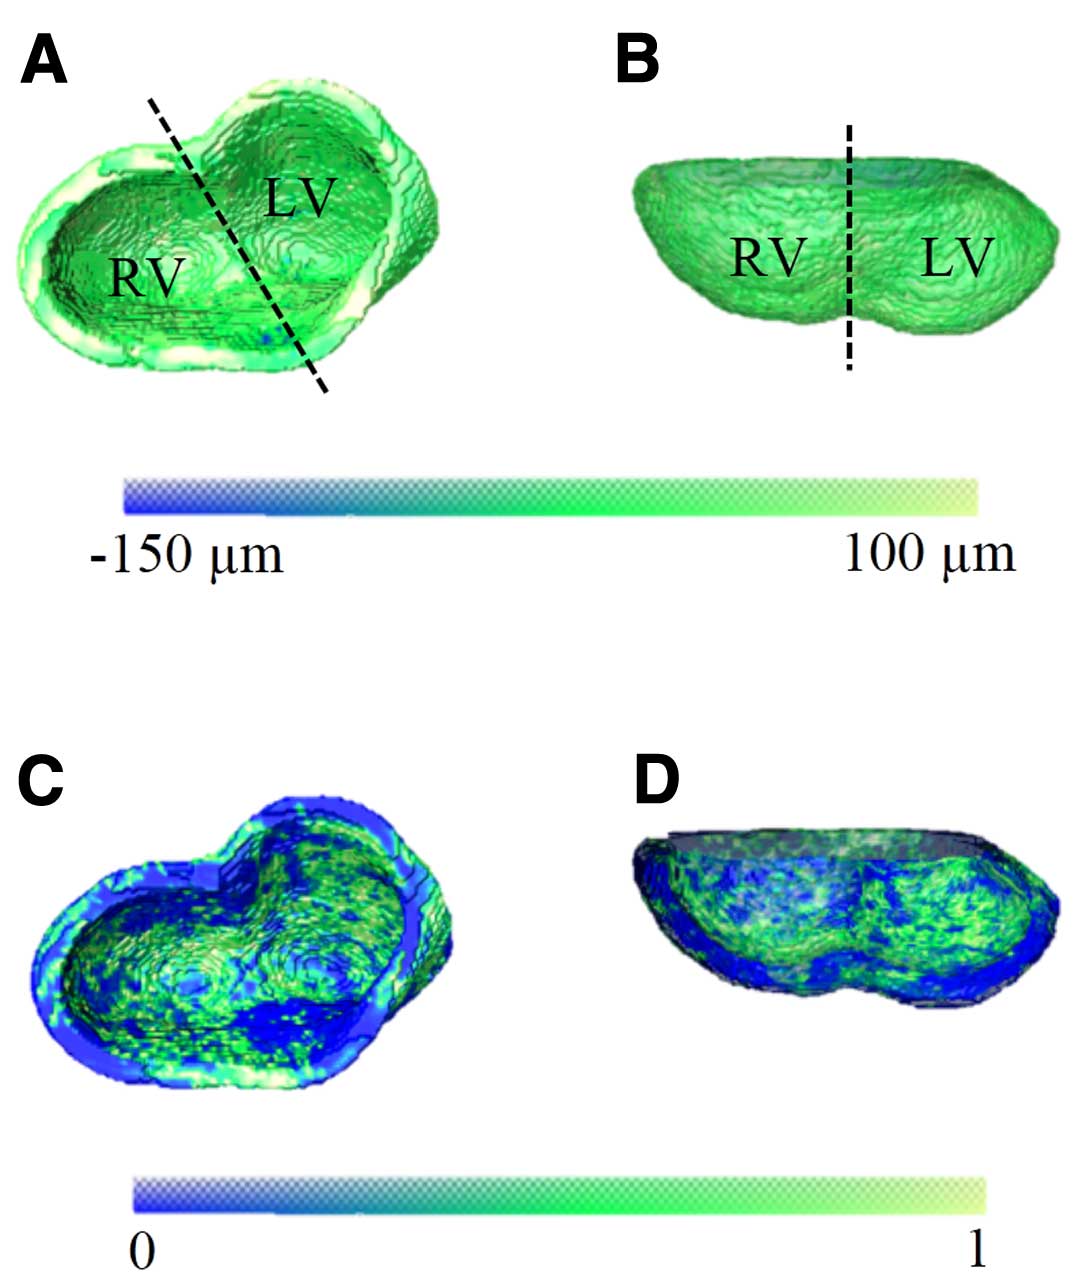
and wild-type hearts. This comparison revealed that the ventricular compact myocardium thickness differences are concentrated in the far free walls and near the septal regions of the RV and LV (Figure 7), suggesting that atlas-based analysis might provide a useful tool for the accurate regional analysis of the developing compact myocardium.
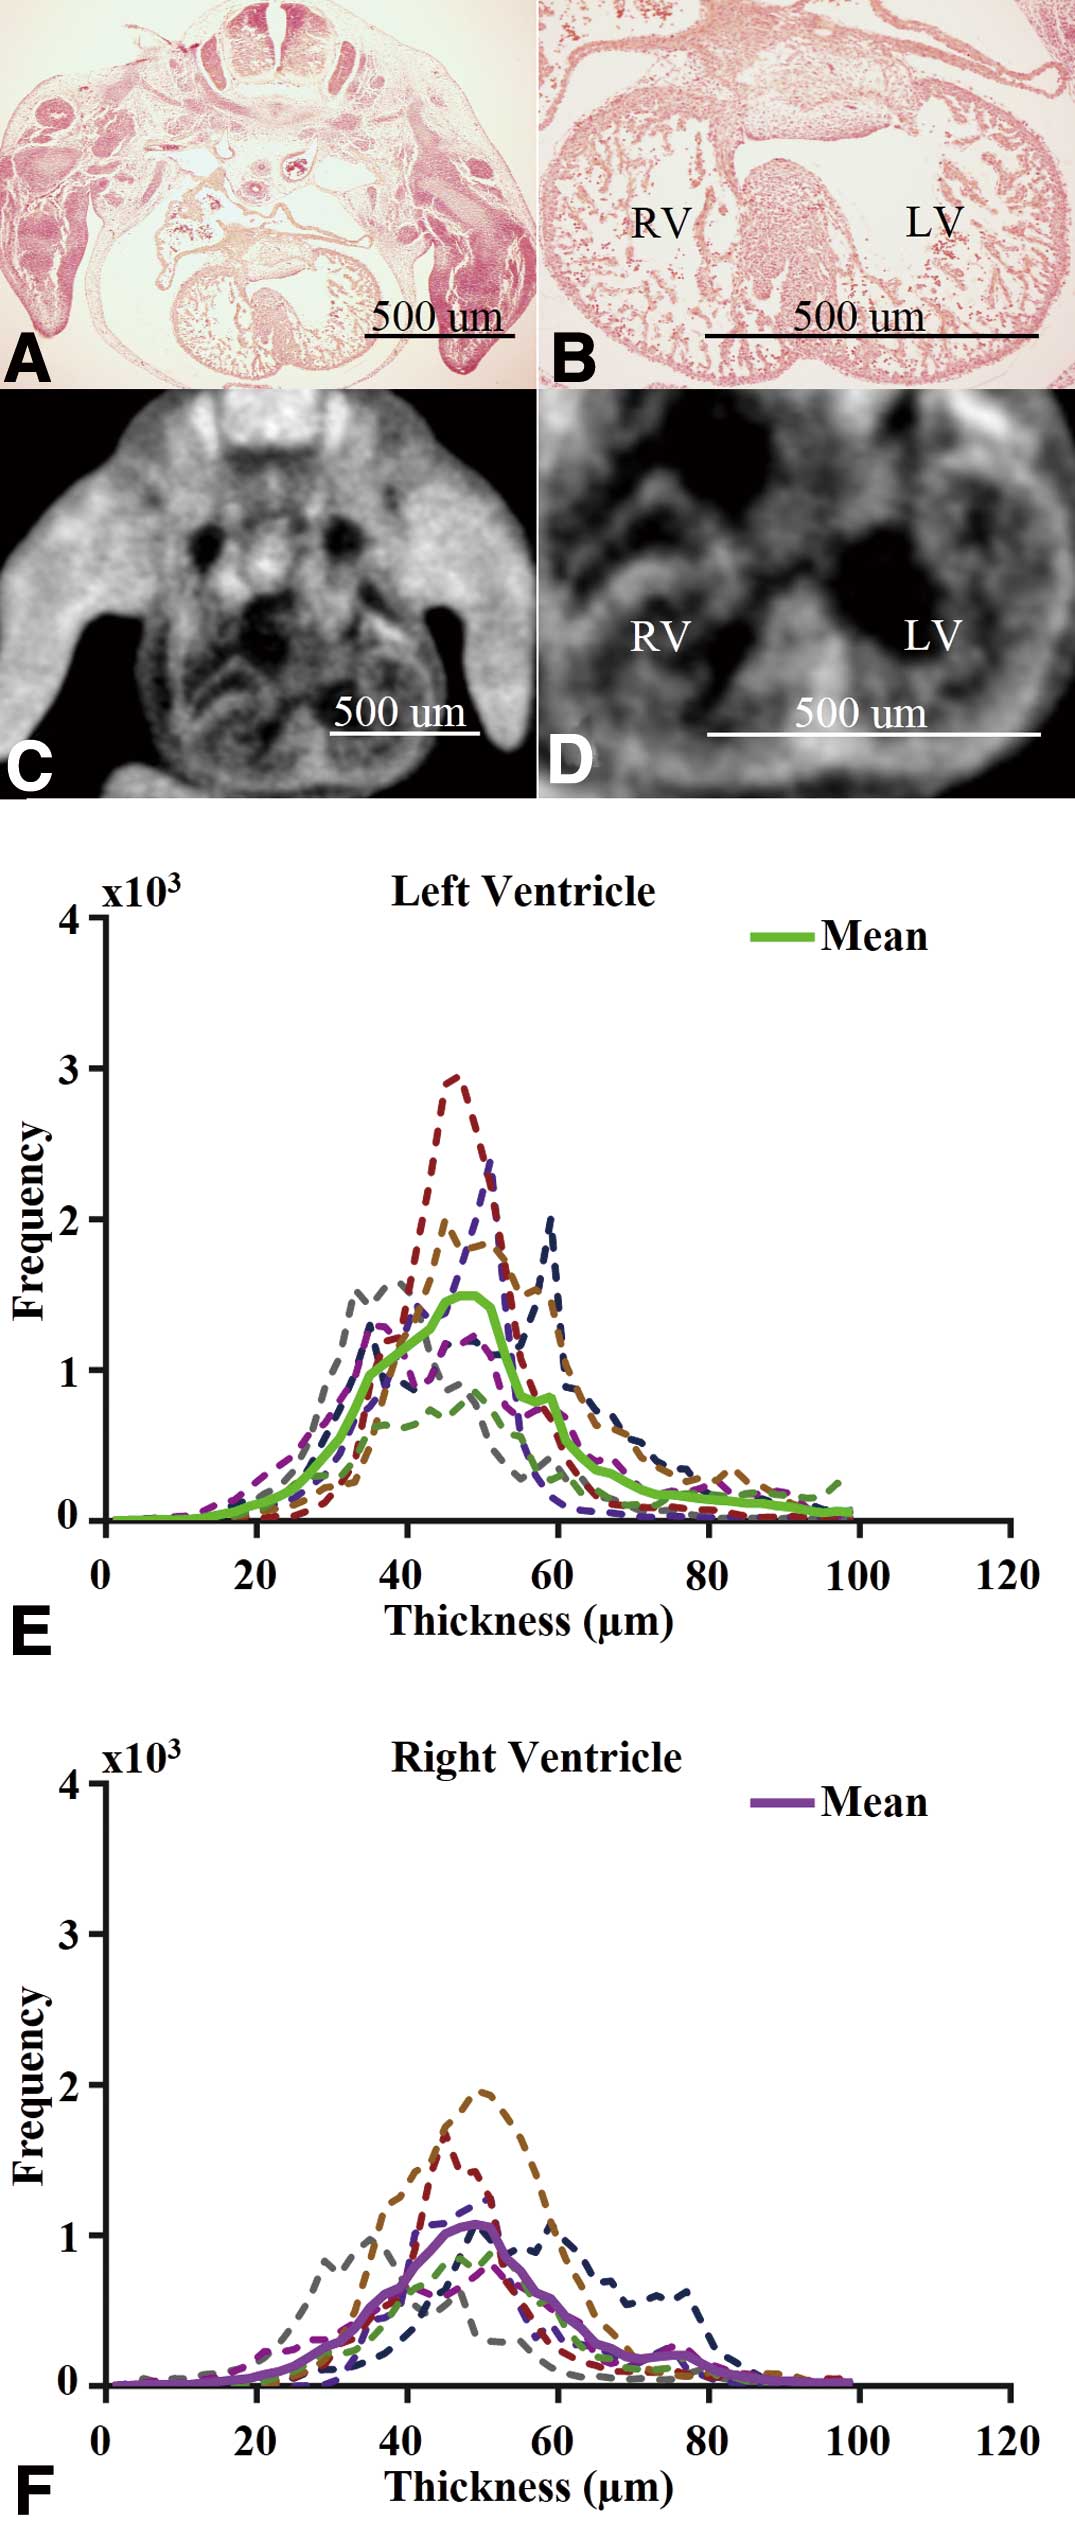

Table.
3D Micro-Computed Tomgraphy-Based Analysis Reveals That e12.5
p27−/− Knockout Hearts Display Thinner Compact Myocardium Compared to Wild Types
| |
e12.5 Knockout |
e12.5 Wild type |
RV thickness
(μm) |
LV thickness
(μm) |
Volume
(μl) |
RV thickness
(μm) |
LV thickness
(μm) |
Volume
(μl) |
| Heart # |
| 1 |
50.00 |
52.30 |
70.00 |
71.40 |
69.80 |
99.00 |
| 2 |
49.90 |
53.20 |
188.00 |
69.00 |
63.60 |
112.00 |
| 3 |
48.50 |
47.40 |
115.00 |
65.50 |
70.00 |
107.00 |
| 4 |
57.40 |
51.50 |
74.00 |
62.20 |
63.40 |
88.00 |
| 5 |
48.50 |
47.60 |
120.00 |
69.20 |
66.70 |
161.00 |
| 6 |
50.50 |
44.90 |
80.00 |
75.50 |
69.40 |
137.00 |
| 7 |
39.50 |
41.30 |
102.00 |
|
|
|
| Group |
| Mean±SD |
49±5 |
48±4 |
107±38 |
68±4 |
67±3 |
117±25 |
| P-value |
2E-05 |
2E-06 |
0.61 |
|
|
|
D, dimensional; LV, left ventricle; RV, right ventricle; SD, standard deviation. Ventricular thickness entries represent the average over the entire chamber. Individual thickness entries represent whole bi-ventricle means from 3D micro-computed tomography data.
Discussion
This study demonstrates that micro-CT, in combination with iodine-staining, allows sufficient spatial resolution for the quantitative 3D assessment of compact myocardium thickness in the mouse embryonic heart. Our analysis was sufficient to differentiate the 2 components of the ventricular wall; that is, trabecular and compact myocardium, at e12.5 in wild-type (Figure 1) and
p27–/–
hearts (Figure 5), revealing the presence of non-compaction in mutant mice. Our study shows the utility of image analysis, including complete and reliable morphological quantifications (Figures 1,3,5;
Tables S1,S2), as well as atlas-based characterization of the morphology in 3D (Figures 2,4,6). In particular, atlas-based analysis appears to be a very useful and novel approach for the accurate spatiotemporal analysis during compact myocardium development.
Findings of the present study are both expected and surprising. On the one hand, wall thickness analysis (Figure 1) reveals that e12.5 RV and LV compact myocardium have similar compact wall thickness, both approximately 67µm. The thicknesses increase to ~100 µm at e18.5 (Figure 3). The observed thickness and the similarities at the 2 embryonic stages are consistent with previous studies,24,25
which supports the validity of the current methodological approach. In contrast, we surprisingly found that
p27–/–
hearts display non-compaction at e12.5 (Figure 5;
Table). Because cardio-specific overexpression of
p27
is known to lead to non-compaction in mouse embryos,38
our data suggest that maintaining normal levels of p27, that is, normal cell cycle regulation is critical for the normal progression of the compaction process. Notably, these data are in agreement with work showing that both increased and decreased proliferation can lead to non-compaction.25,39
Despite the demonstrated promises of the proposed methodology, this work could be improved in several ways, including the analysis of earlier embryonic stages. Although the feasibility of quantifying e9.5 or e10.5 hearts was not precluded, the ventricular wall at these stages is composed of only 1–2 cell layers with a 10–15µm thickness, which is the nominal resolution of the instrument. In addition, the characteristics of non-compaction are not only a thinner compact myocardium, but also abnormal trabecular development; that is, deep intertrabecular recesses. Regardless of the analysis being limited to ventricular wall thickness, our current study was sufficient to detect non-compaction in mutant hearts. However, the additional analysis of the trabecular myocardium with higher-resolution instruments would provide additional benefits for the investigation of non-compaction in mouse models. Another concern is the known tissue shrinkage due to soaking in Lugol’s solution. The effects of tissue distortion could be minimized by using a combination of lower concentration, shorter exposure time, or alternate contrast agent. Although our data suggest that shrinkage was not a major factor for e12.5 wild-type hearts, it remains unclear whether this is true for other time-points or groups. Another limitation is the time needed during post-processing to delineate the myocardium in 3D, in this study done semi-automatically slice-by-slice. However, image segmentation is an area that is being actively investigated, including iterative atlas-based approaches that promise faster and more automatic deployment.31
Despite these limitations, the need to study and develop new and more accurate imaging techniques is underscored by recent human studies suggesting that the commonly used definition of LVNC as a trabeculated to compact myocardium ratio >2.3 needs to be reconsidered.40–42
Overall, the data and methodology presented in this study represent the proof-of-principle that the mouse ventricular wall can be structurally resolved and evaluated in 3D with micro-CT, providing a valid addition to the traditional 2D histological assessment of compact myocardial thickness in mouse embryos. Although the present study was performed on iodine-stained fixed specimens, it demonstrates what is methodologically achievable, including spatial resolution, using current imaging and image analysis techniques. These findings represent the essential foundation for future in vivo and in utero studies to analyze non-compaction in the live developing mouse when the appropriate in vivo radiopaque contrast agents become available.
Acknowledgments
Financial support for this work was provided to L.B. by the Division of Neonatology, University of Utah School of Medicine.
Supplementary Files
Supplementary File 1
Figure S1.
Schematics of simulated 2D section planes.
Figure S2.
Schematics of estimating 3D bi-ventricular volume using simulated 2D sections.
Figure S3.
Digital image analysis steps for visualization and morphological 3D quantification of the compact myocardium.
Figure S4.
Mean thickness distribution of the compact myocardium for the left ventricle (LV, A) and right ventricle (RV, B) highlights the difference between e12.5 wild-type and
p27–/–
hearts.
Table S1.
2D morphological characterization of e12.5 wild-type hearts compared to 3D measurements
Table S2.
2D morphological characterization of e18.5 wild-type hearts compared to 3D measurements
Please find supplementary file(s);
http://dx.doi.org/10.1253/circj.CJ-16-0180
References
- 1.
Manasek FJ. Embryonic development of the heart. I: A light and electron microscopic study of myocardial development in the early chick embryo. J Morphol 1968; 125: 329–365.
- 2.
Jeter JR Jr, Cameron IL. Cell proliferation patterns during cytodifferentiation in embryonic chick tissues: Liver, heart and erythrocytes. J Embryol Exp Morphol 1971; 25: 405–422.
- 3.
Towbin JA. Inherited cardiomyopathies. Circ J 2014; 78: 2347–2356.
- 4.
Weiford BC, Subbarao VD, Mulhern KM. Noncompaction of the ventricular myocardium. Circulation 2004; 109: 2965–2971.
- 5.
Ikeda U, Minamisawa M, Koyama J. Isolated left ventricular non-compaction cardiomyopathy in adults. J Cardiol 2015; 65: 91–97.
- 6.
Paterick TE, Tajik AJ. Left ventricular noncompaction: A diagnostically challenging cardiomyopathy. Circ J 2012; 76: 1556–1562.
- 7.
Vatta M, Mohapatra B, Jimenez S, Sanchez X, Faulkner G, Perles Z, et al. Mutations in Cypher/ZASP in patients with dilated cardiomyopathy and left ventricular non-compaction. J Am Coll Cardiol 2003; 42: 2014–2027.
- 8.
Luxan G, Casanova JC, Martinez-Poveda B, Prados B, D’Amato G, MacGrogan D, et al. Mutations in the NOTCH pathway regulator MIB1 cause left ventricular noncompaction cardiomyopathy. Nat Med 2013; 19: 193–201.
- 9.
Ichida F. Left ventricular noncompaction. Circ J 2009; 73: 19–26.
- 10.
McNally EM, Puckelwartz MJ. Genetic variation in cardiomyopathy and cardiovascular disorders. Circ J 2015; 79: 1409–1415.
- 11.
Limongelli G, Pacileo G, Calabro P, Rea A, Masarone D, Di Salvo G, et al. Right ventricular hypertrabeculation associated with double-outlet left ventricle: Exaggeration of a normal pattern or right ventricular cardiomyopathy? J Cardiovasc Med (Hagerstown) 2010; 11: 193–195.
- 12.
Zambrano E, Marshalko SJ, Jaffe CC, Hui P. Isolated noncompaction of the ventricular myocardium: Clinical and molecular aspects of a rare cardiomyopathy. Lab Invest 2002; 82: 117–122.
- 13.
Xi Y, Ai T, De Lange E, Li Z, Wu G, Brunelli L, et al. Loss of function of hNav1.5 by a ZASP1 mutation associated with intraventricular conduction disturbances in left ventricular noncompaction. Circ Arrhythm Electrophysiol 2012; 5: 1017–1026.
- 14.
Chang B, Gorbea C, Lezin G, Li L, Shan L, Sakai N, et al. 14-3-3epsilon Gene variants in a Japanese patient with left ventricular noncompaction and hypoplasia of the corpus callosum. Gene 2013; 515: 173–180.
- 15.
Kastner P, Grondona JM, Mark M, Gansmuller A, LeMeur M, Decimo D, et al. Genetic analysis of RXR alpha developmental function: Convergence of RXR and RAR signaling pathways in heart and eye morphogenesis. Cell 1994; 78: 987–1003.
- 16.
Shou W, Aghdasi B, Armstrong DL, Guo Q, Bao S, Charng MJ, et al. Cardiac defects and altered ryanodine receptor function in mice lacking FKBP12. Nature 1998; 391: 489–492.
- 17.
Pashmforoush M, Lu JT, Chen H, Amand TS, Kondo R, Pradervand S, et al. Nkx2-5 pathways and congenital heart disease; loss of ventricular myocyte lineage specification leads to progressive cardiomyopathy and complete heart block. Cell 2004; 117: 373–386.
- 18.
Lavine KJ, Yu K, White AC, Zhang X, Smith C, Partanen J, et al. Endocardial and epicardial derived FGF signals regulate myocardial proliferation and differentiation in vivo. Dev Cell 2005; 8: 85–95.
- 19.
Sucov HM, Dyson E, Gumeringer CL, Price J, Chien KR, Evans RM. RXR alpha mutant mice establish a genetic basis for vitamin A signaling in heart morphogenesis. Genes Dev 1994; 8: 1007–1018.
- 20.
Heallen T, Zhang M, Wang J, Bonilla-Claudio M, Klysik E, Johnson RL, et al. Hippo pathway inhibits Wnt signaling to restrain cardiomyocyte proliferation and heart size. Science 2011; 332: 458–461.
- 21.
Li P, Cavallero S, Gu Y, Chen TH, Hughes J, Hassan AB, et al. IGF signaling directs ventricular cardiomyocyte proliferation during embryonic heart development. Development 2011; 138: 1795–1805.
- 22.
Xin M, Kim Y, Sutherland LB, Qi X, McAnally J, Schwartz RJ, et al. Regulation of insulin-like growth factor signaling by Yap governs cardiomyocyte proliferation and embryonic heart size. Sci Signal 2011; 4: ra70.
- 23.
Momoi N, Chang B, Takeda I, Aoyagi Y, Endo K, Ichida F. Differing clinical courses and outcomes in two siblings with Barth syndrome and left ventricular noncompaction. Eur J Pediatr 2012; 171: 515–520.
- 24.
Stankunas K, Hang CT, Tsun ZY, Chen H, Lee NV, Wu JI, et al. Endocardial Brg1 represses ADAMTS1 to maintain the microenvironment for myocardial morphogenesis. Dev Cell 2008; 14: 298–311.
- 25.
Kosaka Y, Cieslik KA, Li L, Lezin G, Maguire CT, Saijoh Y, et al. 14-3-3epsilon plays a role in cardiac ventricular compaction by regulating the cardiomyocyte cell cycle. Mol Cell Biol 2012; 32: 5089–5102.
- 26.
Roberts N, Magee D, Song Y, Brabazon K, Shires M, Crellin D, et al. Toward routine use of 3D histopathology as a research tool. Am J Pathol 2012; 180: 1835–1842.
- 27.
Degenhardt K, Wright AC, Horng D, Padmanabhan A, Epstein JA. Rapid 3D phenotyping of cardiovascular development in mouse embryos by micro-CT with iodine staining. Circ Cardiovasc Imaging 2010; 3: 314–322.
- 28.
Kim AJ, Francis R, Liu X, Devine WA, Ramirez R, Anderton SJ, et al. Microcomputed tomography provides high accuracy congenital heart disease diagnosis in neonatal and fetal mice. Circ Cardiovasc Imaging 2013; 6: 551–559.
- 29.
Vandoorne K, Vandsburger MH, Weisinger K, Brumfeld V, Hemmings BA, Harmelin A, et al. Multimodal imaging reveals a role for Akt1 in fetal cardiac development. Physiol Rep 2013; 1: e00143, doi:10.1002/phy2.143.
- 30.
Lee S, Vinegoni C, Feruglio PF, Fexon L, Gorbatov R, Pivoravov M, et al. Real-time in vivo imaging of the beating mouse heart at microscopic resolution. Nat Commun 2012; 3: 1054.
- 31.
Zhao X, Wu J, Gray CD, McGregor K, Rossi AG, Morrison H, et al. Optical projection tomography permits efficient assessment of infarct volume in the murine heart postmyocardial infarction. Am J Physiol Heart Circ Physiol 2015; 309: H702–H710.
- 32.
Lorenzen P, Prastawa M, Davis B, Gerig G, Bullitt E, Joshi S. Multi-modal image set registration and atlas formation. Med Image Anal 2006; 10: 440–451.
- 33.
Norris FC, Modat M, Cleary JO, Price AN, McCue K, Scambler PJ, et al. Segmentation propagation using a 3D embryo atlas for high-throughput MRI phenotyping: Comparison and validation with manual segmentation. Magn Reson Med 2013; 69: 877–883.
- 34.
Lombaert H, Peyrat JM, Croisille P, Rapacchi S, Fanton L, Cheriet F, et al. Human atlas of the cardiac fiber architecture: Study on a healthy population. IEEE Trans Med Imaging 2012; 31: 1436–1447.
- 35.
Peyrat JM, Sermesant M, Pennec X, Delingette H, Xu C, McVeigh ER, et al. A computational framework for the statistical analysis of cardiac diffusion tensors: Application to a small database of canine hearts. IEEE Trans Med Imaging 2007; 26: 1500–1514.
- 36.
Poolman RA, Li JM, Durand B, Brooks G. Altered expression of cell cycle proteins and prolonged duration of cardiac myocyte hyperplasia in p27KIP1 knockout mice. Circ Res 1999; 85: 117–127.
- 37.
Lorenzen P, Davis B, Joshi S. Unbiased atlas formation via large deformations metric mapping. Med Image Comput Comput Assist Interv 2005; 8: 411–418.
- 38.
Lavine KJ, Schmid GJ, Smith CS, Ornitz DM. Novel tool to suppress cell proliferation in vivo demonstrates that myocardial and coronary vascular growth represent distinct developmental programs. Dev Dyn 2008; 237: 713–724.
- 39.
Wang B, Weidenfeld J, Lu MM, Maika S, Kuziel WA, Morrisey EE, et al. Foxp1 regulates cardiac outflow tract, endocardial cushion morphogenesis and myocyte proliferation and maturation. Development 2004; 131: 4477–4487.
- 40.
Kawel N, Nacif M, Arai AE, Gomes AS, Hundley WG, Johnson WC, et al. Trabeculated (noncompacted) and compact myocardium in adults: The multi-ethnic study of atherosclerosis. Circ Cardiovasc Imaging 2012; 5: 357–366.
- 41.
Shemisa K, Li J, Tam M, Barcena J. Left ventricular noncompaction cardiomyopathy. Cardiovasc Diagn Ther 2013; 3: 170–175.
- 42.
Zhou H, Lin X, Fang L, Zhao X, Ding H, Chen W, et al. Characterization of compacted myocardial abnormalities by cardiac magnetic resonance with native T1 mapping in left ventricular mon-compaction patients: A comparison with late gadolinium enhancement. Circ J 2016; 80: 1210–1216.