Abstract
Background:
Anemia portends a poor clinical outcome in patients with chronic heart failure (CHF). However, its mechanism remains unknown. We sought to elucidate the effect of anemia on patients with HF with reduced ejection fraction (HFrEF) who receive carvedilol therapy.
Methods and Results:
J-CHF study was a prospective, randomized, multicenter trial that assigned 360 HFrEF patients to 2.5 mg/5 mg/20 mg carvedilol groups according to the target dose. At baseline 70 patients (19%) had anemia ([A]) defined as hemoglobin level (Hb) <13 g/dL (male) or <12 g/dL (female) and the remaining 290 did not ([N]). Allocated and achieved doses of carvedilol were similar. Left ventricular ejection fraction (LVEF) and plasma B-type natriuretic peptide (BNP) level significantly improved in both groups over 56 weeks, but they were smaller in [A] than in [N] (LVEF, P=0.046; BNP, P<0.0001 by ANOVA). Baseline Hb was an independent predictor of absolute change in LVEF (β=0.13, P=0.047) and BNP (β=−0.10, P=0.01). Presence of chronic kidney disease defined as estimated glomerular filtration rate (eGFR) <60 mL/min/1.73 m2
at baseline was not associated with differential response to carvedilol therapy. During 3.8±1.4 years follow-up, group [A] had a higher incidence of the composite endpoint of death, hospitalization for cardiovascular causes including HF compared with [N] (P=0.006). Baseline Hb was an independent predictor of the composite endpoint (hazard ratio 0.86, P=0.04), whereas baseline eGFR was not.
Conclusions:
Our data suggested that anemia was associated with a blunted response to carvedilol in HFrEF patients.
Anemia is a common morbidity of chronic heart failure (CHF).1,2
Although it often emerges as a comorbid disorder of renal dysfunction in CHF, referred to as cardiorenal-anemia syndrome,3
various factors can contribute to the emergence of anemia in the setting of CHF.4–6
A lot of studies have demonstrated that anemia portends a poor clinical outcome in CHF patients.1,2,7–9
However, the underlying mechanism is still unknown. The J-CHF (Japanese Chronic Heart Failure) study10
was a prospective randomized study conducted in order to determine the optimal dose of carvedilol by comparing the efficacy and safety of 3 doses of carvedilol and the best predictive parameter for effective outcomes in Japanese patients with HF with reduced ejection fraction (HFrEF). In this substudy, we sought to elucidate the effect of anemia on HFrEF patients who received carvedilol therapy.
Editorial p ????
Methods
Study Population
The J-CHF study was conducted as a prospective, randomized, multicenter trial that enrolled Japanese stable HFrEF patients. The study patients had stable CHF (NYHA class II/III) with reduced EF (LVEF ≤40%), were not currently taking carvedilol, were between 20 and 80 years of age, and could be an inpatient or outpatient. Key exclusion criteria were cardiogenic shock, systolic blood pressure <80 mmHg, severe arrhythmia (e.g., sustained ventricular tachycardia, ventricular fibrillation), bradycardia (<50 beats/min), 2nd-degree or advanced atrioventricular block, recent myocardial infarction, and coronary artery bypass graft or percutaneous coronary intervention. This study was originally designed to clarify the optimal dose of carvedilol and the study subjects were randomly assigned to 2.5 mg/5 mg/20 mg carvedilol groups according to the target dose (Figure 1). Using centralized computer-generated randomization with an algorithm based on the underlying disease, severity, age, and sex, the patients were randomly allocated using a 1:1:1 ratio to 1 of 3 carvedilol groups (2.5 mg, 5 mg, or 20 mg daily). Other β-blockers were prohibited, as were α-blockers, αβ-blockers, and inotropic agents other than digitalis. A total of 237 clinical institutes all over Japan took part in this study and study subjects were enrolled in these institutes. Carvedilol was introduced for all patients and uptitrated to each target dose over 8 weeks. In this substudy anemia was defined as hemoglobin (Hb) level <13 g/dL for males and <12 g/dL for females according to the definition by the World Health Organization.11
The study population was divided into 2 groups by presence (“anemia” group, [A]) or absence (“non-anemia” group, [N]) of anemia at baseline.
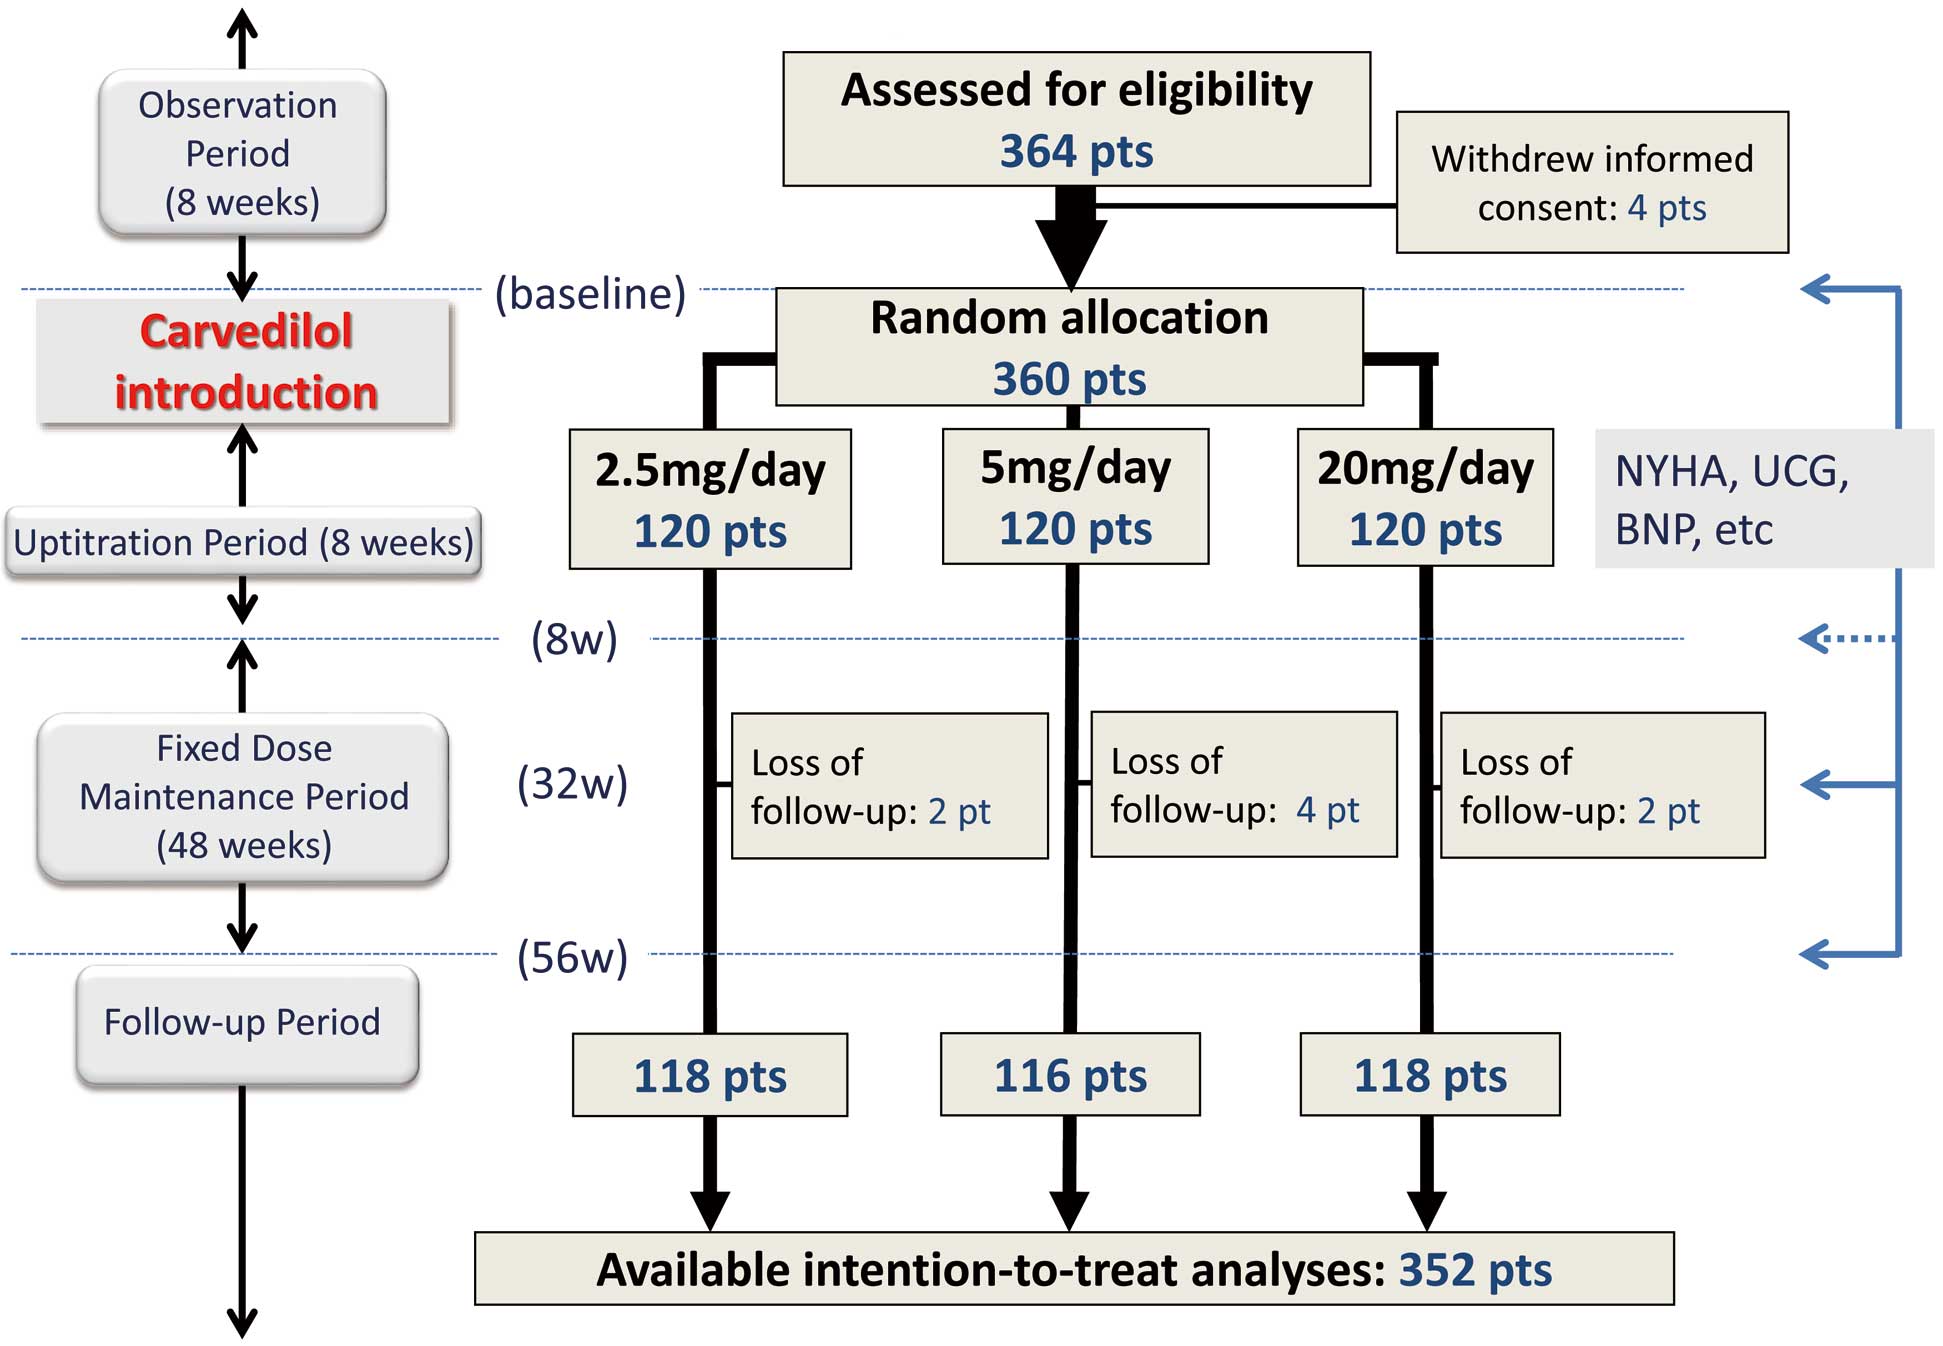
The study design is outlined in
Figure 1. Following an 8-week observation period, carvedilol was titrated upward over 8 weeks (“uptitration period”) from 1.25 mg twice daily to the target dose of 10 mg twice daily based on tolerability. Thereafter, patients were seen every 2–8 weeks for a 3-year follow-up. At weeks 8, 32, and 56, patients were evaluated for NYHA class. In addition, ECG, chest X-ray, echocardiography, and laboratory tests including plasma B-type natriuretic peptide (BNP) were conducted (“fixed dose maintenance period”). Left ventricular EF (LVEF) was measured using a modified Simpson method by echocardiography or radionuclide ventriculography. The primary endpoint was a composite of all-cause death and hospitalization for cardiovascular (CV) causes including exacerbation of HF.10
Statistical Analysis
All values are expressed as the mean value±SD. Differences between groups were compared by non-paired t-test or Mann-Whitney U rank-sum test for unpaired data and by the chi-square test for discrete variables. Repeated measures analysis of variance (ANOVA) was performed to determine the difference in the time-related changes in LVEF and BNP between [N] and [A] groups. Multiple regression analysis was performed to estimate the independent determinants of the absolute change in LVEF (∆LVEF) or BNP (∆BNP) over 56 weeks. The variables of age, sex, body mass index (BMI), ischemic etiology, diabetes mellitus, atrial fibrillation, achieved dose of carvedilol, LVEF, BNP, estimated glomerular filtration rate (eGFR), heart rate at baseline, and baseline Hb levels were included in the univariate model. Age, sex and the variables that achieved a P-value <0.05 in univariate analysis were included in multivariate model. eGFR was calculated using the Modification of Diet in Renal Disease formula.12
Chronic kidney disease (CKD) was defined as eGFR at baseline <60 mL/min/1.73 m2
and the study population was also divided by the presence or absence of CKD. Kaplan-Meier survival curves for the primary endpoint were calculated according to the presence or absence of anemia and the presence or absence of CKD, and the difference was analyzed by log-rank test. Cox proportional hazard model analysis was conducted to determine the independent predictors of the primary endpoint by including the independent variables selected from among those that showed significant differences between [N] and [A] in addition to age, sex, and Hb at baseline. In addition, the mean corpuscular volume (MCV) was calculated and anemia was categorized as microcytic (MCV <80fL), normocytic (80fL ≤MCV≤100 fL) or macrocytic (MCV >100 fL).13
The baseline characteristics and temporal changes in the various measures were compared among the 3 anemia types. P<0.05 was considered statistically significant.
Results
As shown in
Figure 1, 360 study subjects were randomly and equally allocated to 3 groups according to the target dose. Finally, 352 patients were followed up and available for intension-to-treat analyses. At baseline 70 patients (19%) had anemia ([A]) and the remaining 290 did not ([N]). Baseline characteristics of the study subjects based on the presence or absence of anemia are shown in
Table 1. The [A] group were older and had a lower BMI, lower eGFR, and higher proportion of ischemic etiology at baseline. There were no significant differences in carvedilol dose allocation or achieved dose between the [N] and [A] groups (Table 1).
Table 1.
Baseline Characteristics of the Study Group Divided by the Presence ([A]) or Absence ([N]) of Anemia
| |
[N]
(n=290) |
[A]
(n=70) |
P value |
| Age |
59±12 |
67±11 |
<0.0001 |
| Sex (male) |
219 (76%) |
48 (69%) |
0.23 |
| BMI |
23.9±4.3 |
22.2±3.0 |
0.002 |
| Ischemic HF etiology |
58 (20%) |
31 (44%) |
<0.0001 |
| NYHA (II/III) |
242/48 |
57/13 |
0.69 |
| SBP |
120±18 |
120±23 |
0.87 |
| HR |
80±15 |
77±13 |
0.27 |
| Comorbidities |
| AF |
680 (23%) |
5 (7%) |
0.0008 |
| CVD |
14/270 (5%) |
4/63 (6%) |
0.953 |
| HT |
170 (59%) |
36 (51%) |
0.28 |
| HL |
172 (59%) |
38 (54%) |
0.45 |
| DM |
228 (79%) |
41 (59%) |
0.001 |
| Echocardiography |
| LVEF |
30±7 |
30±7 |
0.45 |
| FS |
16±6 |
15±6 |
0.23 |
| LVEDD |
63±8 |
62±7 |
0.53 |
| LVESD |
53±9 |
52±8 |
0.78 |
| LAD |
43±8 |
42±8 |
0.32 |
| Laboratory data |
| BNP |
375±441 |
444±465 |
0.11 |
| Cr |
0.9±0.3 |
1.1±0.4 |
0.0002 |
| eGFR |
67±19 |
54±18 |
<0.0001 |
| Na |
141±3 |
140±3 |
0.80 |
| K |
4.3±0.4 |
4.3±0.5 |
0.76 |
| FBG |
107±30 |
104±24 |
0.74 |
| Medications |
| ACEI |
117 (40%) |
21 (30%) |
0.11 |
| ARB |
148 (51%) |
39 (56%) |
0.48 |
| Aldosterone antagonist |
19 (7%) |
2 (3%) |
0.24 |
| CCB |
43 (15%) |
12 (17%) |
0.63 |
| Digitalis |
84 (29%) |
17 (24%) |
0.43 |
| Diuretics |
223 (77%) |
54 (77%) |
0.97 |
| Pacemaker |
0 (0%) |
0 (0%) |
NA |
| ICD |
2 (1%) |
1 (1%) |
0.54 |
| Randomization (2.5/5/20) |
101/93/96 (35%/32%/33%) |
18/28/24 (26%/40%/34%) |
0.33 |
| Achieved dose of carvedilol (mg) |
8.3±7.2 |
8.7±7.0 |
0.31 |
ACEI, angiotensin-converting enzyme inhibitor; AF, atrial fibrillation; ARB, angiotensin-receptor blocker; BMI, body mass index; BNP, B-type natriuretic peptide; CCB, calcium-channel blocker; Cr, serum creatinine; CVD, cerebrovascular disease; DM, diabetes mellitus; eGFR, estimated glomerular filtration rate; FBG, fasting blood glucose; FS, fractional shortening; HL, hyperlipidemia; HR, heart rate; HT, hypertension; ICD, implantable cardiac defibrillator; LAD, left atrial diameter; LVEDD, left ventricular end-diastolic dimension; LVEF, left ventricular ejection fraction; LVESD, left ventricular end-systolic dimension; NA, not applicable; NYHA, New York Heart Association; SBP, systolic blood pressure.
During the 56 weeks from baseline, LVEF significantly increased in both groups ([N]: 30±7% to 43±14%, P<0.0001; [A]: 30±7% to 40±14%, P<0.0001,
Figure 2A). However, the improvement in LVEF was greater in the [N] group compared with the [A] group (P=0.046 by ANOVA,
Figure 2A). At 56 weeks, LVEF tended to be lower in the [A] group compared with the [N] group (P=0.09). There was no significant difference in the absolute change in LVEF over 56 weeks (∆LVEF: [N] vs. [A], +13±14% vs. +11±16%, P=0.35). Plasma BNP significantly decreased in both the [N] and [A] groups over 56 weeks ([N]: 375±441 to 128±195 pg/mL, P<0.001; [A]: 444±465 to 289±588 pg/mL, P<0.01,
Figure 2B). The improvement in BNP was greater in the [N] group compared with the [A] group (P<0.001 by ANOVA,
Figure 2B). BNP was significantly lower in the [N] group compared with the [A] group at 8, 32 and 56 weeks ([N] vs. [A], 8 weeks, 192±214 vs. 327±338 pg/mL, P<0.001; 32 weeks, 141±203 vs. 308±498 pg/mL, P<0.001; 56 weeks, 128±195 vs. 289±588 pg/mL, P<0.01,
Figure 2B). There was no significant difference in the absolute change in BNP (∆BNP; [N] vs. [A], −250±450 vs. −156±685 pg/mL, P=0.32). The time course of change in eGFR is shown in
Figure S1. eGFR was significantly higher in the [N] group compared with the [A] group throughout the study period. Although eGFR showed no significant changes in the [N] group during the 56 weeks (67±19 to 67±19 mL/min/1.73 m2, P=0.99), it significantly decreased in the [A] group (54±18 to 50±20 mL/min/1.73 m2, P=0.004). The absolute change in eGFR was significantly higher in the [N] group compared with the [A] group ([N] vs. [A], −0.2±12.8 vs. −5.6±13.3 mL/min/1.73 m2, P=0.006).

Multiple regression analysis was performed to determine the independent predictors of ∆LVEF or ∆BNP over the 56 weeks. The baseline Hb level was an independent predictor for ∆LVEF and ∆BNP (Tables 2,3) even after adjusting for various confounding factors.
Table 2.
Multiple Regression Analysis for ΔLVEF in Substudy of J-CHF Study
| |
Univariate |
Multivariate |
| β |
95% CI |
t value |
P value |
β |
95% CI |
t value |
P value |
| Age |
−0.20 |
−0.38~−0.10 |
−3.37 |
0.0009 |
−0.10 |
−0.26~0.03 |
−1.62 |
0.11 |
| Sex |
−0.089 |
−3.27~0.49 |
−1.46 |
0.15 |
−0.13 |
−4.01~−0.23 |
−2.21 |
0.03 |
| BMI at baseline |
0.070 |
−0.17~0.66 |
1.15 |
0.25 |
|
|
|
|
| Etiology (ischemic) |
−0.22 |
−5.62~−1.72 |
−3.70 |
0.0003 |
−0.14 |
−4.25~−0.33 |
−2.30 |
0.02 |
| DM |
−0.002 |
−1.95~1.90 |
−0.03 |
0.98 |
|
|
|
|
| AF |
0.015 |
−1.91~2.44 |
0.24 |
0.81 |
|
|
|
|
| Achieved dose |
0.081 |
−0.08~0.40 |
1.32 |
0.19 |
|
|
|
|
| LVEF at baseline |
−0.28 |
−0.81~−0.34 |
−4.85 |
<0.0001 |
−0.26 |
−0.76~−0.30 |
−4.59 |
<0.0001 |
| BNP at baseline |
0.15 |
0.001~0.009 |
2.50 |
0.013 |
0.08 |
−0.001~0.006 |
1.33 |
0.18 |
| HR at baseline |
0.18 |
0.06~0.30 |
3.01 |
0.003 |
0.11 |
−0.002~0.22 |
1.94 |
0.053 |
| eGFR |
0.075 |
−0.03~0.14 |
1.24 |
0.22 |
|
|
|
|
| Baseline Hb |
0.15 |
0.25~2.05 |
2.52 |
0.012 |
0.13 |
0.01~1.99 |
1.99 |
0.047 |
Hb, hemoglobin level; J-CHF, Japanese Chronic Heart Failure; ΔLVEF, absolute change in LVEF over 56 weeks. Other abbreviations as in Table 1.
Table 3.
Multiple Regression Analysis for ΔBNP in Substudy of J-CHF Study
| |
Univariate |
Multivariate |
| β |
95% CI |
t value |
P value |
β |
95% CI |
t value |
P value |
| Age |
0.259 |
6.1~14.9 |
4.64 |
<0.0001 |
0.10 |
1.11~6.98 |
2.71 |
0.007 |
| Sex |
0.06 |
−31.0~98.0 |
1.02 |
0.31 |
0.08 |
2.87~82.73 |
2.11 |
0.04 |
| BMI at baseline |
−0.05 |
−19.2~7.5 |
−0.87 |
0.39 |
|
|
|
|
| Etiology (ischemic) |
0.234 |
72.5~202.1 |
4.17 |
<0.0001 |
0.11 |
21.5~103.3 |
3.00 |
0.003 |
| DM |
−0.02 |
−73.5~56.3 |
−0.26 |
0.79 |
|
|
|
|
| AF |
0.04 |
−45.0~94.1 |
0.70 |
0.49 |
|
|
|
|
| Achieved dose |
−0.11 |
−15.1~0.4 |
−1.86 |
0.064 |
|
|
|
|
| LVEF at baseline |
0.195 |
6.0~22.1 |
3.44 |
0.0007 |
0.02 |
−3.41~6.25 |
0.58 |
0.56 |
| BNP at baseline |
−0.79 |
−0.95~−0.80 |
−22.72 |
<0.0001 |
−0.76 |
−0.91~−0.77 |
−22.4 |
<0.0001 |
| HR at baseline |
−0.069 |
−6.3~1.5 |
−1.20 |
0.23 |
−0.01 |
−2.71~1.84 |
−0.38 |
0.71 |
| eGFR |
−0.02 |
−3.4~2.4 |
−0.35 |
0.72 |
|
|
|
|
| Baseline Hb |
−0.165 |
−71.4~−13.6 |
−2.90 |
0.004 |
−0.10 |
−45.9~−6.3 |
−2.59 |
0.01 |
ΔBNP, absolute change in BNP over 56 weeks. Other abbreviations as in Tables 1,2.
During both the uptitration period and fixed dose maintenance period, Hb level significantly increased in the [A] group over 56 weeks from baseline (11.3±1.2 to 11.9±1.8 g/dL, P=0.01,
Figure 3), whereas it significantly decreased in the [N] group (14.8±1.5 to 14.0±1.5 g/dL, P<0.0001,
Figure 3). The absolute change in Hb level was significantly lower in the [N] group compared with the [A] group ([N] vs. [A], −0.8±1.2 vs. +0.5±1.3 g/dL, P<0.0001). ∆LVEF and ∆BNP showed a modest correlation (ρ=−0.39, P<0.0001), but ∆Hb barely correlated with ∆LVEF (ρ=−0.14, P=0.02) or ∆BNP (ρ=0.17, P=0.003).
Association of CKD With Reverse Remodeling
When the study population was divided into 2 groups according to the presence (CKD group) or absence (non-CKD group) of CKD defined as eGFR <60 mL/min/1.73 m2
at baseline, 148 subjects (41%) had CKD. There was no significant difference in the change in LVEF between the CKD and non-CKD groups (Figure S2A). At baseline, plasma BNP level was significantly higher in CKD than non-CKD group. And then this difference persisted throughout the dose maintenance period (Figure S2B).
Clinical Follow-up
During 3.8±1.4 years of follow-up, 3 patients died and 16 patients were hospitalized for CV causes including HF in the [A] group, compared with 2 deaths and 45 patients hospitalized in the [N] group. The presence of anemia was associated with a higher incidence of the primary endpoint consisting of all-cause death and hospitalization for CV causes (P=0.006 by log-rank test,
Figure 4A). Group [A] had a higher rate of all-cause death compared with group [N] (P=0.002 by log-rank test,
Figure 4B). Hospitalization for CV causes tended to be more common in [A] group compared with [N] group (P=0.07 by log-rank test,
Figure 4C). Also, the presence of CKD was associated with a higher incidence of the primary endpoint (P=0.001 by log-rank test,
Figure S3). Cox proportional hazard model analysis revealed that baseline Hb level was an independent predictor of the primary endpoint, but baseline eGFR was not (Table 4).

Table 4.
Cox Proportional Hazard Model Analysis for Primary Endpoint
| |
Hazard ratio |
Lower 95% |
Higher 95% |
P value |
| Age |
1.01 |
0.98 |
1.03 |
0.53 |
| Sex (male) |
1.87 |
1.05 |
3.49 |
0.03 |
| BMI at baseline |
0.097 |
0.01 |
0.68 |
0.02 |
| Etiology (ischemic) |
1.68 |
1.02 |
2.74 |
0.04 |
| AF |
1.32 |
0.72 |
2.33 |
0.36 |
| eGFR |
0.996 |
0.98 |
1.01 |
0.52 |
| Hb at baseline |
0.86 |
0.74 |
0.99 |
0.04 |
Abbreviations as in Table 1.
Based on the MCV value for each patient, in [A] group there were 7 patients (10%) classified as microcytic, 50 (71%) were normocytic and the remaining 13 (19%) had macrocytic anemia. We compared the baseline clinical characteristics, the time course of the change in Hb level, renal function (eGFR), and the various measures associated with reverse remodeling (e.g., LVEF, BNP, ∆LVEF, ∆BNP etc.). Age was significantly younger among those with microcytic anemia compared with the other groups (microcytic, 56±7; normocytic, 68±10; macrocytic, 68±12 years, P=0.02). However, there were no significant differences in any other baseline characteristic or measures of reverse remodeling among the 3 groups (data not shown).
Discussion
In the present study our main findings were: (1) improvement in LVEF and BNP during carvedilol therapy was smaller in [A] group compared with [N] group; (2) baseline Hb level was an independent predictor for ∆LVEF and ∆BNP; (3) CKD, defined as eGFR <60 mL/min/1.73 m2, was not associated with the differential response to carvedilol therapy in terms of the improvement in LVEF or BNP; (4) Hb level significantly increased in 56 weeks in [A] group, but decreased in [N] group; and (5) both anemia and CKD were associated with a higher incidence of primary endpoint, but baseline Hb level, not eGFR, was an independent predictor. We concluded, from these findings, that anemia, but not CKD, was associated with the blunted response to carvedilol therapy. To our knowledge, this is the first study to demonstrate an association of anemia with a differential response to a particular HF therapy, although many studies have reported that anemia is associated with higher incidence of adverse clinical events in CHF.2,7–9,14
Anemia in CHF
Anemia is commonly found in patients with CHF1,2
and a wide range of prevalence has been reported (7% to >50%), possibly because of multiple factors, including the use of multiple definitions of anemia.2
The prevalence of anemia in the present study (19%) was in agreement with those previous findings. Anemia is associated with worse clinical outcomes in patients with CHF.1,2,7–9
Although anemia often emerges from renal failure concomitant with CHF,3
it can be also attributable to other factors such as iron deficiency, poor utilization of iron storage because of inflammation,4,5
and hemodilution.6
Anemia induces a hyperhemodynamic state and increased work load through increased heart rate and stroke volume,15
leading to pathologically raised sympathetic nerve activity,16
which can contribute to advanced LV remodeling.
Proposed Mechanisms of Anemia Mediating the Differential Response to Carvedilol
Anemia has the potential to adversely affect the pathology of CHF possibly through increased work load15
and decreased oxygen supply to multiple organs, leading to accelerated myocardial ischemia. Furthermore, altered autonomic balance is common in HF, but can be further promoted by anemia. Although the spectral index related to sympathetic activity shows a tendency to increase,17
a significant decrease in the parameters related to parasympathetic control, on the other hand, has been noted in analyses of heart rate variability (HRV).17,18
Depressed parasympathetic nerve activity should be deleterious in CHF, because vagal stimulation is shown to have a beneficial effect in CHF in terms of improved symptoms and exercise capacity.19
Theoretically, the effect of β-blockers, including carvedilol, for reversal of depressed parasympathetic nerve activity should be limited. Although a previous study showed that long-term treatment by carvedilol resulted in increased parasympathetic nerve activity in CHF, no information on the comorbidities (anemia, CKD etc.) in those study participants was provided and it is unclear whether it was direct or indirect effect.20
Taken together, the data suggest that the deleterious effects induced by HF-related anemia might lead to persistent LV remodeling refractory to carvedilol therapy.
Involvement of CKD
CKD is also an important comorbidity of CHF and can be a marker of advanced disease progression.21
CKD confers a clinically significant risk for higher mortality in patients with CHF.22–24
In this context CKD is also suspected to be a factor influencing the response to carvedilol therapy. However, from a basic point of view, CKD induces activation of sympathetic nerve activity, but, unlike anemia, has no influence on cardiac parasympathetic nerve activity as examined by HRV.25
Clinically, in the previous studies similar or even better efficacy of β-blockers has been demonstrated in patients with CKD compared with those without CKD in terms of reduced CV events,23,24
although data on reverse remodeling during β-blocker therapy have not been available. In the present study, the subgroups divided by baseline eGFR showed a similar response to carvedilol therapy (Figure S2). And, unlike the Hb level, baseline eGFR did not predict ∆LVEF or ∆BNP by regression analysis (Tables 2,3). Furthermore, baseline eGFR was not an independent predictor of the primary endpoint (Table 4). This is reasonable because our findings suggested that carvedilol was equally effective in alleviating LV systolic dysfunction, irrespective of baseline eGFR, but it may also be explained in part by the fact that most of the patients in the CKD group (137/148 patients [93%]) had relatively mild disease (30≤eGFR<60 mL/min/1.73 m2), whereas previous studies.23,24
including a meta-analysis,22
have demonstrated that CKD confers excess risk of adverse clinical outcomes in patients with CHF. Based on these and our findings, the efficacy of carvedilol therapy, including reverse remodeling, was not affected by baseline eGFR.
Change in Hb Level During Carvedilol Therapy
In the present study, the Hb level increased significantly in [A] group, which was in agreement with a previous study that found patients with anemia showed an increase in Hb level during 12 months of β-blocker treatment, whereas those who did not receive β-blocker showed a significant reduction in Hb level.26
In the present study this favorable outcome was not accompanied by improvement in renal function (Figure S1), which was in agreement with our previous findings.27
As mentioned before, anemia in the setting of CHF is not caused by 1 mechanism, rather by multiple mechanisms, such as inflammation-induced impairment of iron utilization4,5
or hemodilution.6
Therefore, the improvement in LV systolic function by carvedilol, or its distinctive antioxidant property,28
might result in the amelioration of this uncertain pathology that leads to HF-related anemia. On the other hand, the Hb level significantly decreased in [N] group. A similar finding was reported in the COMET study,29
in which carvedilol administration led to a decrease in Hb level by 0.4 g/dL, but metoprolol did not show such an effect. Because erythropoietin is secreted in the kidneys after stimulation of β2-adrenergic receptors,30
carvedilol (non-selective β-blocker), but not metoprolol (β1
selective) may adversely affect the production of erythropoietin. Furthermore, the Val-HeFT study showed that administration of valsartan also induced a reduction in Hb level.14
Although the mechanism is not yet fully understood, angiotensin-converting enzyme inhibitors31
or angiotensin-receptor blockers32
might impair the response to erythropoietin. Although in the present study modification of HF treatment was prohibited during the 8-week observation period, we cannot exclude the possibility that certain medications might have affected these findings.
Study Limitations
This study was conducted as a substudy of J-CHF study in order to elucidate the clinical effect of anemia on HFrEF patients who received carvedilol therapy. We cannot exclude the possibility that some confounding factors (e.g., ischemic etiology, older age, or lower BMI) might have affected the findings presented, although multivariate analyses were used to exclude those influences. It is also uncertain whether the presence of these comorbidities was coincidence or related to anemia. Cardiac cachexia is a strong predictor of poor clinical outcome,33
but we did not have data on the nutritional status, physical activity or frailty of the study participants. Because the enrolled patients were determined to be eligible for this randomized study of carvedilol introduction, which required the participants to visit outpatient clinics frequently (every 1–2 weeks) for clinical examination for uptitration of carvedilol, the patients’ general condition should have been relatively stable and the majority of patients seemed to be non-cachexic. The present study does not provide any clues on the mechanistic link or causal relationship between anemia and the response to carvedilol therapy in terms of the amelioration of LV systolic dysfunction. Therefore, the efficacy of intervention for anemia in the setting of CHF still remains uncertain. Finally, we could not explore the etiologies causing anemia in individual patients, although we tried to analyze it by classifying anemia into microcytic, normocytic, and macrocytic according to patients’ MCV values. We did not collect data on measures related to the etiologies of anemia such as serum levels of iron, ferritin or erythropoietin etc., because this study was conducted as a substudy of the J-CHF study, which originally sought to determine the optimal dose of carvedilol for HFrEF patients.
Conclusions
Our data suggested that anemia was associated with a blunted response to carvedilol in HFrEF patients, whereas CKD was not. Further investigation is warranted to elucidate the detailed mechanism.
Sources of Funding
The J-CHF study was funded by a Research Grant for Cardiovascular Diseases (14C-2) from the Ministry of Health, Labor, and Welfare of Japan, and the Japan Heart Foundation.
Supplementary Files
Supplementary File 1
Appendix S1. The J-CHF Program Committees and Members
Appendix S2. The J-CHF Trial Study Group: Total 237 Sites
Figure S1.
Time course of estimated glomerular filtration rate (eGFR) in the [N] and [A] groups over 56 weeks.
Figure S2.
Time course of change in LVEF (A) and BNP (B) in groups divided by presence of CKD.
Figure S3.
Kaplan-Meier curves of primary endpoint in groups divided by presence or absence of chronic kidney disease (CKD).
Please find supplementary file(s);
http://dx.doi.org/10.1253/circj.CJ-17-0442
References
- 1.
Anand I, McMurray JJ, Whitmore J, Warren M, Pham A, McCamish MA, et al. Anemia and its relationship to clinical outcome in heart failure. Circulation 2004; 110: 149–154.
- 2.
Groenveld HF, Januzzi JL, Damman K, van Wijngaarden J, Hillege HL, van Veldhuisen DJ, et al. Anemia and mortality in heart failure patients: A systematic review and meta-analysis. J Am Coll Cardiol 2008; 52: 818–827.
- 3.
Silverberg DS, Wexler D, Iaina A. The importance of anemia and its correction in the management of severe congestive heart failure. Eur J Heart Fail 2002; 4: 681–686.
- 4.
Opasich C, Cazzola M, Scelsi L, De Feo S, Bosimini E, Lagioia R, et al. Blunted erythropoietin production and defective iron supply for erythropoiesis as major causes of anaemia in patients with chronic heart failure. Eur Heart J 2005; 26: 2232–2237.
- 5.
Kleijn L, Belonje AM, Voors AA, De Boer RA, Jaarsma T, Ghosh S, et al. Inflammation and anaemia in a broad spectrum of patients with heart failure. Heart 2012; 98: 1237–1241.
- 6.
Androne AS, Katz SD, Lund L, LaManca J, Hudaihed A, Hryniewicz K, et al. Hemodilution is common in patients with advanced heart failure. Circulation 2003; 107: 226–229.
- 7.
Horwich TB, Fonarow GC, Hamilton MA, MacLellan WR, Borenstein J. Anemia is associated with worse symptoms, greater impairment in functional capacity and a significant increase in mortality in patients with advanced heart failure. J Am Coll Cardiol 2002; 39: 1780–1786.
- 8.
Berry C, Norrie J, Hogg K, Brett M, Stevenson K, McMurray JJ. The prevalence, nature, and importance of hematologic abnormalities in heart failure. Am Heart J 2006; 151: 1313–1321.
- 9.
Hamaguchi S, Tsuchihashi-Makaya M, Kinugawa S, Yokota T, Takeshita A, Yokoshiki H, et al. Anemia is an independent predictor of long-term adverse outcomes in patients hospitalized with heart failure in Japan: A report from the Japanese Cardiac Registry of Heart Failure in Cardiology (JCARE-CARD). Circ J 2009; 73: 1901–1908.
- 10.
Okamoto H, Hori M, Matsuzaki M, Tsutsui H, Yamazaki T, Nagai R, et al. Minimal dose for effective clinical outcome and predictive factors for responsiveness to carvedilol: Japanese chronic heart failure (J-CHF) study. Int J Cardiol 2013; 164: 238–244.
- 11. 11. World Health Organization. Dept. of Nutrition for Health and Development. Iron deficiency anaemia: Assessment, prevention and control: A guide for programme managers. Geneva: WHO, 2001.
- 12.
Imai E, Horio M, Nitta K, Yamagata K, Iseki K, Hara S, et al. Estimation of glomerular filtration rate by the MDRD study equation modified for Japanese patients with chronic kidney disease. Clin Exp Nephrol 2007; 11: 41–50.
- 13. 13. Porwit A, McCullough J, Erber WN. Blood and Bone Marrow Pathology. 2nd edn. Churchill Livingstone, 2011.
- 14.
Anand IS, Kuskowski MA, Rector TS, Florea VG, Glazer RD, Hester A, et al. Anemia and change in hemoglobin over time related to mortality and morbidity in patients with chronic heart failure: Results from Val-HeFT. Circulation 2005; 112: 1121–1127.
- 15.
Varat MA, Adolph RJ, Fowler NO. Cardiovascular effects of anemia. Am Heart J 1972; 83: 415–426.
- 16.
Franchitto N, Despas F, Labrunee M, Roncalli J, Boveda S, Galinier M, et al. Tonic chemoreflex activation contributes to increased sympathetic nerve activity in heart failure-related anemia. Hypertension 2010; 55: 1012–1017.
- 17.
Sangkatumvong S, Coates TD, Khoo MC. Abnormal autonomic cardiac response to transient hypoxia in sickle cell anemia. Physiol Meas 2008; 29: 655–668.
- 18.
Yokusoglu M, Nevruz O, Baysan O, Uzun M, Demirkol S, Avcu F, et al. The altered autonomic nervous system activity in iron deficiency anemia. Tohoku J Exp Med 2007; 212: 397–402.
- 19.
Gold MR, Van Veldhuisen DJ, Hauptman PJ, Borggrefe M, Kubo SH, Lieberman RA, et al. Vagus nerve stimulation for the treatment of heart failure: The INOVATE-HF Trial. J Am Coll Cardiol 2016; 68: 149–158.
- 20.
Goldsmith RL, Bigger JT, Bloomfield DM, Krum H, Steinman RC, Sackner-Bernstein J, et al. Long-term carvedilol therapy increases parasympathetic nervous system activity in chronic congestive heart failure. Am J Cardiol 1997; 80: 1101–1104.
- 21.
Inohara T, Kohsaka S, Sato N, Kajimoto K, Keida T, Mizuno M, et al. Prognostic impact of renal dysfunction does not differ according to the clinical profiles of patients: Insight from the acute decompensated heart failure syndromes (ATTEND) registry. PLoS One 2014; 9: e105596.
- 22.
Smith GL, Lichtman JH, Bracken MB, Shlipak MG, Phillips CO, DiCapua P, et al. Renal impairment and outcomes in heart failure: Systematic review and meta-analysis. J Am Coll Cardiol 2006; 47: 1987–1996.
- 23.
Ghali JK, Wikstrand J, Van Veldhuisen DJ, Fagerberg B, Goldstein S, Hjalmarson A, et al. The influence of renal function on clinical outcome and response to beta-blockade in systolic heart failure: Insights from Metoprolol CR/XL Randomized Intervention Trial in Chronic HF (MERIT-HF). J Card Fail 2009; 15: 310–318.
- 24.
Castagno D, Jhund PS, McMurray JJ, Lewsey JD, Erdmann E, Zannad F, et al. Improved survival with bisoprolol in patients with heart failure and renal impairment: An analysis of the cardiac insufficiency bisoprolol study II (CIBIS-II) trial. Eur J Heart Fail 2010; 12: 607–616.
- 25.
Clyne N, Hellberg M, Kouidi E, Deligiannis A, Hoglund P. Relationship between declining glomerular filtration rate and measures of cardiac and vascular autonomic neuropathy. Nephrology (Carlton) 2016; 21: 1047–1055.
- 26.
Khan W, Deepak SM, Coppinger T, Waywell C, Borg A, Harper L, et al. Beta blocker treatment is associated with improvement in renal function and anaemia in patients with heart failure. Heart 2006; 92: 1856–1857.
- 27.
Ito H, Nagatomo Y, Kohno T, Anzai T, Meguro T, Ogawa S, et al. Differential effects of carvedilol and metoprolol on renal function in patients with heart failure. Circ J 2010; 74: 1578–1583.
- 28.
Yue TL, Cheng HY, Lysko PG, McKenna PJ, Feuerstein R, Gu JL, et al. Carvedilol, a new vasodilator and beta adrenoceptor antagonist, is an antioxidant and free radical scavenger. J Pharmacol Exp Ther 1992; 263: 92–98.
- 29.
Komajda M, Anker SD, Charlesworth A, Okonko D, Metra M, Di Lenarda A, et al. The impact of new onset anaemia on morbidity and mortality in chronic heart failure: Results from COMET. Eur Heart J 2006; 27: 1440–1446.
- 30.
Mladenovic J, Adamson JW. Adrenergic modulation of erythropoiesis: In vitro studies of colony-forming cells in normal and polycythaemic man. Br J Haematol 1984; 56: 323–332.
- 31.
Albitar S, Genin R, Fen-Chong M, Serveaux MO, Bourgeon B. High dose enalapril impairs the response to erythropoietin treatment in haemodialysis patients. Nephrol Dial Transplant 1998; 13: 1206–1210.
- 32.
Odabas AR, Cetinkaya R, Selcuk Y, Keles S, Bilen H. The effect of high dose losartan on erythropoietin resistance in patients undergoing haemodialysis. Panminerva Med 2003; 45: 59–62.
- 33.
Anker SD, Negassa A, Coats AJ, Afzal R, Poole-Wilson PA, Cohn JN, et al. Prognostic importance of weight loss in chronic heart failure and the effect of treatment with angiotensin-converting-enzyme inhibitors: An observational study. Lancet 2003; 361: 1077–1083.

