Abstract
Background:
Reference values and the characteristics of the electrocardiographic (ECG) findings using a large number of subjects are lacking for children and adolescents.
Methods and Results:
A total of 56,753 digitally stored ECGs of participants in a school-based ECG screening system were obtained between 2006 and 2009 in Kagoshima, Japan. Each ECG was manually reviewed by 2 pediatric cardiologists and only ECGs with sinus rhythm were included. A final total of 48,401 ECGs from 16,773 1st (6 years old, 50% girls), 18,126 7th (12 years old, 51% girls), and 13,502 10th graders (15 years old, 52% girls) were selected. ECG variables showed differences in age and sex. However, the effects of age and sex on ECG variables such as the PQ interval, QRS voltage, and STJ segment were also different. The 98th percentile values of well-known surrogate parameters for ventricular hypertrophy in the present study were much higher than the conventional criteria.
Conclusions:
The present study of a large number of pediatric subjects showed that the effects of age and sex on ECG parameters are different, and that criteria for ventricular hypertrophy should be newly determined by age and sex. We have developed reference data for STJ segment elevation for children and adolescents. These findings are useful for creating guidelines and recommendations for interpretation of pediatric ECG.
Sudden cardiac death (SCD) in infants, children, and adolescents is always tragic and is devastating for family members, the local community, and the whole society. Consequently, there is considerable interest in screening for early identification of cardiovascular disease at risk of SCD in the young. However, the strategies for SCD screening and cost-effectiveness are still controversial.1,2
There are alternative approaches to screening the young population with cardiovascular disease at risk for SCD: pre-participation screening of young competitive athletes2
and mass screening of the general population of young people.3
A recent study showed that SCD was more common in non-athletes compared with athletes.4
However, performing either pre-participation screening or general screening suggests the necessity of having standard values of electrocardiographic (ECG) findings. Additionally, interpretation of the 12-lead ECG of subjects of different ages is recommended.1,2,5–11
To establish the standard values of ECG parameters, a large number of ECGs need to be obtained and ECGs with abnormal findings need to be excluded. However, there are limitations in the current literature concerning normal or reference values for pediatric ECGs.7,10
These limitations include measurements that were performed manually and lead by lead in early studies; a limited set of ECG parameters; and values based on a small number of ECGs. These limitations can be overcome by using computer-assisted analysis of digitized multichannel ECGs and reviewing of all ECGs by experienced pediatric cardiologists.
Therefore, the present study aimed to determine the standard values and characteristics of ECGs in children and adolescents based on ECG data from a large-scale general population who participated in a screening program in Japan.
Methods
Study Population
The ECGs included in the present study came from a total of 56,753 participants in a screening system in Kagoshima City in Japan from 2006 to 2009. The participants included 19,367 1st graders (9,849 boys and 9,518 girls), 21,807 7th graders (10,401 boys and 10,686 girls), and 16,299 10th graders (8,096 boys and 8,203 girls). The reason for the relatively small number of 10th graders was that some private high schools carried out their own systems of screening; the remaining public high schools in Kagoshima City joined the screening system.
The process of identifying cardiovascular disease in the school-based screening program in Kagoshima is described elsewhere in detail.3
In brief, the process consisted of 3 steps of examination: the 1st screening, and 2nd and 3rd examinations. In the 1st screening, students underwent a 12-lead resting ECG and their parents were asked to fill out questionnaires, including written informed consent to participate.3
ECGs in the Present Study
In the present study, the ECGs from the 1st screening were used. ECGs were recorded at the schools using a portable PC-based system (Fukuda Denshi Co., Ltd., Tokyo, Japan) at a speed of 25 mm/s, a sampling rate of 500 Hz, and with a bandwidth of 0.5–35 Hz. ECGs were recorded by authorized technicians with supervisors at each recording. ECGs were processed by a 12-lead ECG analysis program (S2 Version, Fukuda Denshi Co.), based on an international standard from the International Electrotechnical Commission (IEC 60601-2-25).12
We understand that all medical electrical equipment in Japan is based on this international standard. All ECGs were manually checked before analysis by at least 2 of the authors who were experienced with pediatric ECGs. ECGs that were included were those in sinus rhythm, namely the presence of positive P waves in leads I and II.
Excluded ECGs
The following ECGs were excluded (Supplementary File 1, Table S1).
1. ECGs of subjects with underlying cardiovascular disease or a family history of SCD.3
The questionnaire asked parents about the presence or absence of a past and/or present history of underlying cardiovascular disease and family history of SCD before 40 years of age and the cause of SCD. The content of these questionnaires has been described in detail.3
ECGs of subjects with dextrocardia or funnel chest were also excluded.
2. ECGs that were recorded incorrectly or unclearly. ECGs with inappropriate attachment of electrical leads (e.g., right hand instead of left hand) and those with artifacts and/or drifts were excluded.
3. ECGs showing arrhythmia. ECGs showing rhythm disturbance of the P wave (wandering pacemaker and junctional rhythm), 2nd- and 3rd-degree atrioventricular block, intraventricular conduction disturbance (complete bundle branch block and WPW syndrome), and premature beats (atrial or ventricular) were excluded.
4. Other abnormal findings. ECGs showing the presence of Q waves in lead V1 and that of ST depression and/or an inverted T wave in leads V5 and V6 were excluded.
Definition of Each Segment of the ECG
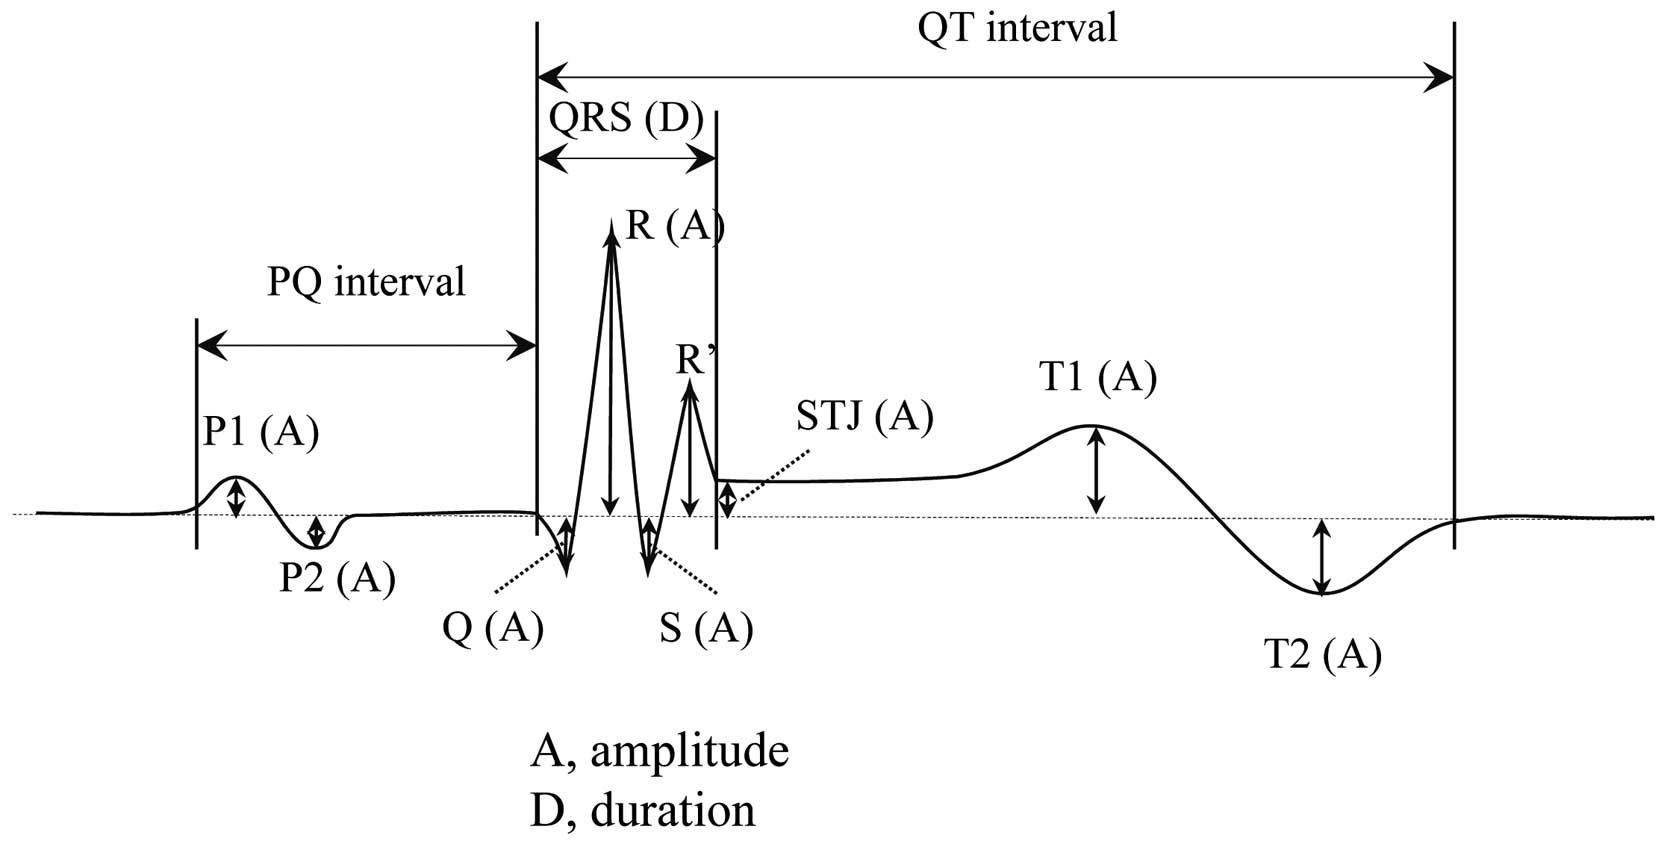
Figure 1
is a diagram of a typical ECG. Definitions of each segment were as follows.
P wave
In the P wave analysis in this study, the first peak was defined as P1 and the second peak with opposite polarity to the first wave was defined as P2 in each lead. If there were 2 peaks with the same polarity, the higher peak was selected as P1 and the other peak was not measured as a peak.
QRS Complex
The Q wave was the first negative deflection during ventricular depolarization. The R wave was defined as the first positive deflection, and the S wave was defined as the first negative deflection that followed the first positive deflection (R wave). The R’ wave was the second positive deflection during ventricular depolarization. An amplitude ≥10 μV in each lead was detected by computer analysis.
Combined Calculated QRS Voltages
Several combined QRS voltages have been used as the amplitude criteria for ventricular hypertrophy. The Sokolow-Lyon criterion13
(SV1+RV5 or SV1+RV6 >35 mm), Cornell criterion14
(RaVL+SV3 >28 mm in men, 20 mm in women), Cornell product15
[(RaVL+SV3)×(QRS duration) >2,440 mm×ms], and pediatric-specific criteria for hypertrophic cardiomyopathy (HCM)16
(RaVL+SV2 >23 mm) were included in the present study.
STJ Segment
We measured the deviation from the isometric line at the end of the QRS complex (J point).
T-Wave Amplitude
The T-wave amplitude was measured in the same manner as the P wave. Throughout the T wave, the first peak was defined as T1, and the second peak with opposite polarity to the first wave across the baseline was defined as T2 in each lead. If the T wave was monophasic and existed in only one side of baseline, the T1 value was positive or negative according to the polarity of the T wave. The T2 value was then measured as zero. If the T wave was biphasic and existed on both sides of the baseline, the T1 and T2 values were measured according to their amplitudes. If there were 2 peaks with the same polarity, the higher peak was selected as the T1 or T2 value, and the other peak was not measured. Therefore, T-wave polarity could be determined based on the values of T1 and T2. Monophasic positive, monophasic negative, and biphasic T waves were defined as T1 >0 and T2=0, T1 <0 and T2=0, and T1≠0 and T2≠0, respectively, in the present study.
QT Interval
The present study was based on automatically measured data. Automatic measurement of the uncorrected QT interval was based on the differentiation method, not on the tangent line method, and automatically measured uncorrected QT intervals were more than 20 ms longer than manually measured QT intervals.17
The QT interval was not analyzed in the present study. Instead, manually measured data from a prior study18
were analyzed and the data are shown in
Table S2.
Statistical Analysis
Statistical data for standard ECG values are shown in the Tables and Figures. Variables are shown as the mean, standard deviation, and 2nd and 98th percentile values for all 12 ECG leads for boys and girls in 1st, 7th, and 10th grades. The data are shown as the median, and 2nd and 98th percentile values when they are skewed in distribution.
Results
A final total of 48,401 ECGs was used in the present study: 16,773 1st graders (8,350 boys and 8,423 girls), 18,126 7th graders (8,943 boys and 9,183 girls), and 13,502 10th graders (6,477 boys and 7,025 girls). The selection process of normal ECGs is described in detail in
Supplementary File 1.
Mean Values of the 12 ECG Leads
The mean values of the PQ interval and QRS duration from the data of all 12 leads are shown in
Table 1. The PQ interval increased with age with little effect of sex (Figure 2A). The QRS duration showed prominent age and sex differences (Figure 2B). The mean values of ventricular activation time are shown in the
Table S2.
Table 1.
Standard Values of Representative ECG Variables in a Screening Study of Japanese Schoolchildren
| Variable / Lead |
1 st graders (6 years old) |
7th graders (12 years old) |
10th graders (15 years old) |
| Male |
Female |
Male |
Female |
Male |
Female |
| Mean* |
2nd/98th† |
Mean* |
2nd/98th |
Mean* |
2nd/98th |
Mean* |
2nd/98th |
Mean* |
2nd/98th |
Mean* |
2nd/98th |
| Heart rate (beats/min) |
81 (10) |
63/104 |
83 (10) |
65/108 |
76 (11) |
56/103 |
80 (12) |
59/109 |
67 (12) |
46/98 |
72 (12) |
50/101 |
| PQ interval (ms) |
124 (15) |
96/159 |
123 (15) |
96/158 |
134 (17) |
103/173 |
135 (18) |
103/177 |
142 (19) |
107/186 |
141 (19) |
106/186 |
| QRS duration (ms) |
85 (6) |
73/100 |
82 (6) |
71/95 |
94 (7) |
80/109 |
89 (7) |
76/103 |
99 (7) |
85/115 |
90 (7) |
77/105 |
| QRS axis (degrees) |
65 (23) |
5/98 |
68 (20) |
14/98 |
65 (22) |
5/96 |
69 (19) |
17/97 |
68 (22) |
8/98 |
69 (20) |
6/99 |
| P1 amplitude (mV) |
| II |
0.07 (0.04) |
0.02/0.15 |
0.08 (0.04) |
0.02/0.16 |
0.09 (0.04) |
0.02/0.18 |
0.09 (0.04) |
0.02/0.19 |
0.09 (0.05) |
0.02/0.20 |
0.09 (0.04) |
0.02/0.18 |
| P2 amplitude (mV) |
| V1 |
−0.01 |
−0.06/0 |
−0.01 |
−0.06/0 |
−0.01 |
−0.07/0 |
−0.01 |
−0.06/0 |
−0.01 |
−0.07/0 |
−0.01 |
−0.05/0 |
| P1 duration (ms) |
| II |
77 (12) |
48/98 |
79 (12) |
50/100 |
87 (12) |
58/110 |
89 (13) |
60/114 |
91 (13) |
61/116 |
90 (13) |
62/116 |
| Q amplitude (mV) |
| V5 |
−0.07 |
−0.39/0 |
−0.05 |
−0.33/0 |
−0.05 |
−0.33/0 |
0 |
−0.17/0 |
−0.04 |
−0.28/0 |
0 |
−0.13/0 |
| V6 |
−0.09 |
−0.33/0 |
−0.06 |
−0.29/0 |
−0.06 |
−0.29/0 |
−0.03 |
−0.20/0 |
−0.06 |
−0.26/0 |
−0.02 |
−0.17/0 |
| Q duration (ms) |
| V5 |
18 |
0/26 |
16 |
0/26 |
18 |
0/28 |
0 |
0/26 |
18 |
0/30 |
0 |
0/26 |
| V6 |
20 |
0/28 |
18 |
0/26 |
20 |
0/30 |
18 |
0/28 |
20 |
0/30 |
16 |
0/28 |
| R amplitude (mV) |
| V1 |
0.61 |
0.14/1.43 |
0.52 |
0.09/1.21 |
0.49 |
0.09/1.27 |
0.35 |
0.05/0.99 |
0.46 |
0.08/1.17 |
0.28 |
0.04/0.83 |
| V4 |
2.27 |
1.00/3.86 |
2.16 |
0.91/3.65 |
2.25 |
0.96/3.94 |
1.50 |
0.62/2.86 |
2.11 |
0.79/3.86 |
1.21 |
0.43/2.30 |
| V5 |
1.84 |
0.93/3.22 |
1.80 |
0.91/3.09 |
1.93 |
1.02/3.43 |
1.43 |
0.74/2.52 |
1.86 |
0.89/3.36 |
1.25 |
0.58/2.16 |
| V6 |
1.27 |
0.64/2.29 |
1.27 |
0.65/2.25 |
1.40 |
0.73/2.52 |
1.20 |
0.63/2.02 |
1.39 |
0.67/2.55 |
1.10 |
0.56/1.90 |
| S amplitude (mV) |
| V1 |
−1.03 |
−2.25/−0.24 |
−1.10 |
−2.29/−0.32 |
−1.20 |
−2.57/−0.31 |
−1.03 |
−2.22/−0.30 |
−1.28 |
−2.87/−0.40 |
−0.94 |
−1.97/−0.27 |
| V2 |
−1.77 |
−3.09/−0.6 |
−1.80 |
−3.09/−0.61 |
−2.03 |
−3.64/−0.67 |
−1.61 |
−3.02/−0.55 |
−2.21 |
−4.01/−0.75 |
−1.35 |
−2.64/−0.43 |
| V3 |
−1,140 |
−2,510/−100 |
−930 |
−2,310/0 |
−1,190 |
−2,740/−100 |
−740 |
−2,040/0 |
−1,250 |
−2,985/−80 |
−670 |
−1,765/0 |
| SV1+RV5‡
(mV) |
2.98 (0.78) |
1.56/4.78 |
3.00 (0.76) |
1.61/4.73 |
3.26 (0.85) |
1.74/5.23 |
2.56 (0.70) |
1.33/4.17 |
3.29 (0.90) |
1.64/5.39 |
2.26 (0.63) |
1.16/3.69 |
| SV1+RV6‡
(mV) |
2.40 (0.68) |
1.19/3.94 |
2.46 (0.67) |
1.19/3.94 |
2.71 (0.74) |
1.35/4.46 |
2.31 (0.63) |
1.22/3.78 |
2.80 (0.80) |
1.35/4.71 |
2.12 (0.59) |
1.10/3.45 |
| RaVL+SV2#
(mV) |
1.96 (0.64) |
0.70/3.34 |
1.99 (0.62) |
0.75/3.29 |
2.24 (0.72) |
0.84/3.81 |
1.79 (0.61) |
0.68/3.17 |
2.39 (0.79) |
0.88/4.14 |
1.52 (0.54) |
0.55/2.77 |
| RaVL+SV3$
(mV) |
1.36 (0.61) |
0.27/2.71 |
1.14 (0.60) |
0.13/2.48 |
1.41 (0.66) |
0.25/2.91 |
0.94 (0.51) |
0.10/2.18 |
1.47 (0.72) |
0.21/3.12 |
0.84 (0.45) |
0.09/1.94 |
| Cornell product (mm×ms) |
1,176 (557) |
220/2,454 |
944 (517) |
101/2,156 |
1,339 (653) |
222/2,877 |
844 (472) |
91/2,015 |
1,471 (749) |
202/3,225 |
771 (439) |
74/1,855 |
| ST Segment (mV) |
| V2 |
0.10 (0.05) |
0.01/0.02 |
0.09 (0.05) |
0.01/0.20 |
0.13 (0.06) |
0.02/0.28 |
0.09 (0.05) |
0/0.20 |
0.16 (0.08) |
0.03/0.35 |
0.07 (0.04) |
0/0.19 |
| T wave (mV) |
| II |
0.41 |
0.21/0.67 |
0.36 |
0.16/0.61 |
0.41 |
0.08/0.71 |
0.31 |
0.10/0.56 |
0.09 |
0.12/0.69 |
0.08 |
0.08/0.55 |
*Values are expressed as the mean and standard deviation (in parentheses). When the data were skewed in distribution, the median value was used. †Values are expressed as 2nd percentile value/98th percentile value. ‡Sokolow-Lyon criterion; #pediatric-specific criterion for hypertrophic cardiomyopathy; $Cornell criterion.

P-Wave Amplitude
P1 amplitude was highest in lead II in all graders of both sexes (Figure 3A). P1 was positive in leads I and II (this was an inclusion criterion in this study) and V3–V6, either positive or negative in leads III, aVL, aVF, V1, and V2, and exclusively negative in lead aVR in all groups (Table S2). P2 peaks were recognized only in leads III, V1, and V2 in both sexes, and most of them had a negative polarity.
P-Wave Duration
P wave duration was the longest in 10th graders, with a sex difference, especially in the right precordial leads, and the shortest in 1st graders with similar values for the sexes in all leads (Table S2). The 7th and 10th grade girls showed a similar P wave duration. The P wave duration was longest in lead II among the 12 leads in 7th and 10th graders, while the duration of V1 was longest in 1st graders.
QRS Complexes
Q Wave
The median value of the Q wave amplitude was deeper in the order of leads aVR, V6, V5, and III in boys of all grades, and in leads aVR, III, V6, and aVF in 7th and 10th grade girls (Table S2). The median Q wave duration was wide in leads aVR, III, and V6 in both sexes.
R-Wave Amplitude
Among the 12 leads, the median R wave amplitudes in leads V4–V6 were similar among boys (Table 1, Figure 3B). The median R wave amplitude in all precordial leads decreased with age in girls. The percentile curves of the RV1 and RV5 amplitudes clearly showed sex differences (Figure 4A,B). The RV1 amplitudes were similar in 1st and 7th graders and these amplitudes were higher than those in 10th grade boys (Table 1). RV5 amplitudes were similar among boys. However, in girls, R wave amplitudes decreased with age in RV1 and RV5.
S-Wave Amplitude
The median S wave amplitude was highest in lead V2. Median S wave amplitude in V1, V2, and V3 increased with age in boys and decreased with age in girls (Table 1, Figure 5A).
Combined Calculated QRS Voltages
The 98th percentile values of {SV1+RV5 (or RV6)} in the present study were >35 mm, except in 10th grade girls (Table 1). The 98th percentile values of (RaVL+SV3) were greater than the Cornell criterion,14
except in 1st grade boys and 10th grade girls, and those of (RaVL+SV3)×(QRS duration) were greater in all grade boys than the criterion of Cornell product.15
The 98th percentile values of (RaVL+SV2) was also much greater in all grades of both sexes than the pediatric-specific criteria for HCM.16
QRS-Wave Duration
The mean QRS wave duration was the longest in 10th grade boys and the shortest in 1st grade girls in all leads (Table S2). The QRS wave duration in 7th and 10th grade girls showed similar values. The QRS wave duration was longest in lead V2 among all 12 leads.
STJ Segment
The STJ segment showed elevation in the mid-precordial leads, especially leads V2 and V3 (Figure 5B). ST segment elevation ranged from 0.05 to 0.5 mV. We identified ≥0.2 mV STJ segment elevation in lead V2 in 3.6%, 16.1%, and 34.1% of boys in 1st, 7th, and 10th grades, respectively, and in 2.1%, 2.1%, and 1.0% of girls in 1st, 7th, and 10th grades, respectively. ST segment elevation was more marked with age in boys, than in girls.
T-Wave Amplitude
The median T1 peak amplitude was higher in boys than in girls in all grades, except for leads aVL and V2 in 1st graders. In the precordial leads, the median T1 amplitude was maximum in V4 and minimum in V1 leads in all grades. A monophasic negative T wave was prevalent in 1st graders (Table 2). However, approximately 1% of 1st graders showed monophasic positive T waves. Monophasic negative T waves were less prevalent from right to left precordial leads and by age. No 10th grade males showed monophasic negative T waves in lead V4 (Table 2).
Table 2.
Prevalence of Negative, Biphasic, and Positive T Waves in Precordial Leads by Sex and Age Groups
| Precordial lead |
V1 |
V2 |
V3 |
V4 |
V5 |
V6 |
| Monophasic negative T wave |
| Male |
| 1 st graders |
71.1 |
15.7 |
2.57 |
0.12 |
0 |
0 |
| 7th graders |
59.8 |
5.1 |
0.86 |
0.10 |
0 |
0 |
| 10th graders |
45.4 |
1.4 |
0.08 |
0 |
0 |
0 |
| Female |
| 1 st graders |
79.1 |
18.1 |
2.59 |
0.15 |
0 |
0 |
| 7th graders |
70.9 |
5.3 |
1.68 |
0.13 |
0 |
0 |
| 10th graders |
67.8 |
2.9 |
0.88 |
0.04 |
0 |
0 |
| Biphasic T wave (Negative to positive in appearance) |
| Male |
| 1 st graders |
13.5 |
13.4 |
0.93 |
0.06 |
0 |
0 |
| 7th graders |
8.5 |
3.3 |
0.15 |
0.01 |
0 |
0 |
| 10th graders |
2.2 |
0.4 |
0.02 |
0 |
0 |
0 |
| Female |
| Primary |
6.5 |
8.8 |
0.81 |
0.02 |
0 |
0 |
| 7th graders |
4.2 |
2.1 |
0.19 |
0.01 |
0 |
0 |
| 10th graders |
1.4 |
0.7 |
0.06 |
0 |
0 |
0 |
| Biphasic T wave (Positive to negative in appearance) |
| Male |
| 1 st graders |
14.2 |
39.6 |
21.0 |
2.16 |
0.57 |
0.22 |
| 7th graders |
17.6 |
14.1 |
7.8 |
0.79 |
0.16 |
0.04 |
| 10th graders |
16.9 |
6.6 |
4.0 |
1.05 |
0.52 |
0.12 |
| Female |
| 1 st graders |
14.7 |
45.8 |
24.3 |
2.45 |
0.11 |
0.18 |
| 7th graders |
17.1 |
16.3 |
9.7 |
1.06 |
0.47 |
0.03 |
| 10th graders |
18.3 |
8.5 |
4.1 |
0.41 |
0.09 |
0.03 |
| Monophasic positive T wave |
| Male |
| 1 st graders |
1.3 |
31.3 |
75.5 |
97.6 |
99.43 |
99.78 |
| 7th graders |
14.2 |
77.5 |
91.2 |
99.1 |
99.84 |
99.96 |
| 10th graders |
35.4 |
91.6 |
96.0 |
99.0 |
99.48 |
99.88 |
| Female |
| 1 st graders |
0.7 |
27.3 |
72.3 |
97.4 |
99.88 |
99.82 |
| 7th graders |
7.8 |
76.3 |
88.4 |
98.8 |
99.53 |
99.97 |
| 10th graders |
12.5 |
88.0 |
95.0 |
99.5 |
99.91 |
99.97 |
Values are expressed as %. The prevalence in some leads is expressed with a second decimal place to show a very low (near 0%) or very high (near 100%) value. 1 st, 7th and 10th graders were 6, 7 and 15 years old, respectively.
Discussion
The present study determined standard values of pediatric ECG findings using data from a large number of subjects. Our study showed that the effects of age and sex were different among the ECG parameters, and that the criteria for ventricular hypertrophy should be newly determined by age and sex. The present study is the first to present reference data for STJ segment elevation in children and adolescents. These findings may be useful for creating guidelines and recommendations for the interpretation of pediatric ECGs.
PQ Interval
The present study showed an increase in the PQ interval with age and it was similar between sexes in both children and adolescents; the difference in the mean value between sexes was 1 ms. In adults, a sex difference in the PQ interval has been reported, with a difference in mean value between sexes of 10 ms in Whites and 6 ms in Asians.19
ECG studies in the Netherlands showed an approximately 5-ms sex difference in the mean PQ interval,7
suggesting that racial differences are also present in childhood.
P Wave
P-Wave Amplitude
A P wave amplitude greater than 0.25 mV20
or 0.30 mV21
in lead II is used for diagnosing right atrial hypertrophy. Normal upper limits for P wave amplitude in leads other than II have been rarely reported. The mean and 98th percentile values were highest in lead II in all groups in the present study, which suggests that the P wave amplitude in lead II is the most important for diagnosing right atrial hypertrophy. However, the upper limit of the P wave amplitude in lead II in our study was slightly lower than in previous studies.7,9
One of the reasons for the differences in voltage criteria between studies may be that a lower bandwidth was used in the present study.
P wave amplitude (depth) in lead V1 is used for diagnosing left atrial hypertrophy. Lower limits of a negative P wave in each lead have not been established in children. Our study showed that the lower limits (2nd percentile) ranged from −0.05 to −0.06 mV.
P-Wave Duration
In our study, the P wave duration increased as male participants became older and was similar in 7th and 10th grade girls. P wave duration might depend on the size of the atria and differences in the rate of growth to adolescence. The P wave duration in the present study was shorter than that found by Rijinbeek et al7
and longer than that found by Semizel et al.9
The reasons for these differences among studies are unclear, but might be related to differences in race, age range, number of subjects, or a combination of these because the sampling rate was the same (500 Hz) in the 3 studies.7,9
QRS Complexes
Q Wave
A normal Q wave, produced primarily by depolarization of the ventricular septum, is observed in leads II, III, aVR, aVL, aVF, V5, and V6. Q waves simulating coronary artery disease can be related to altered ventricular conduction, such as left bundle branch block or Wolf-Parkinson-White syndrome.22
A Q wave also appears in cases of right/left ventricular hypertrophy, HCM, myocarditis, amyloidosis, myocardial tumor, and sarcoidosis.22
The amplitude of the Q wave is normally less than one-quarter of the R wave (Q/R <0.25), less than 0.2 mV in lead III, and the duration of the Q wave is less than 0.04 s.23
The median Q wave amplitude was within 0.1 mV and the median Q wave duration was within 0.2 ms, except in lead aVR, in the present study.
R-Wave Amplitude
R wave amplitude is an important parameter of ventricular hypertrophy, but is probably affected by extracardiac factors (e.g., age, sex, and physique).5
The median and 98th percentile values of the R wave amplitude in V6 in the present 10th graders (15 years old) were similar to those in children aged 12–16 years, as shown by Davignon et al,5
and lower than those reported by Rijnbeek et al.7
In girls, the R amplitude in the left precordial leads was greatly decreased from the 7th grade (12 years old) in the present study. A large change in amplitude occurred at 12–16 years, but not at 8–12 years, in another study.7
These findings suggest that considerable changes in extracardiac factors associated with puberty may occur at approximately 12 years in girls.
S-Wave Amplitude
S waves are inversely related to R waves, and the S wave amplitude is an important parameter of ventricular hypertrophy, similar to R waves. In the present study, S waves were most frequently observed in the right precordial leads, and were highest in V2 among the 12 leads. The incidence of S waves gradually decreased from V1 or V2 to V6. The S wave amplitudes in V1 to V3 increased with age for boys and decreased with age for girls. Therefore, differences in amplitudes between boys and girls increased with age.
Combined QRS Voltages
Several combined QRS voltages have been used as amplitude criteria for ventricular hypertrophy. In the present study, the 98th percentile values of the combined QRS voltages for hypertrophy were much higher in many groups than the Sokolow-Lyon criterion,13
the Cornell criterion,14
the Cornell product,15
or the pediatric-specific criteria for HCM.16
The values of (RaVL+SV3)14
gradually increased with age for boys and decreased with age for girls. The differences in values between boys and girls increased with age because of the effect of the S wave amplitude in V3. These criteria should be determined for children and adolescents by age and by sex.
QRS-Wave Duration
In the boys in our study, the QRS duration in the 12 leads increased as they became older. In girls, the QRS duration did not differ between 7th and 10th graders. Growth of girls is faster than that of boys, and 7th and 10th grade girls are considered to grow to the same extent. These findings show that QRS wave duration might depend on the size of the ventricle and that differences in sexes are considered to be related to the rate of growth in adolescence.
STJ Segment
The ST segment represents part of ventricular repolarization, and corresponds to phase 2 of the myocardial transmembrane action potential. Early repolarization is one of the normal variants that represent elevated ST segments.24
There is an association between early repolarization syndrome and SCD.25
However, there are no reference data on ST segment elevation in healthy children. The present study showed that the highest ST elevation was present in lead V2 and that the amplitude increased with age in boys, with the opposite finding in girls. In adults, men also have greater ST elevation compared with women. Zarafshar et al reported that significant differences in ST amplitude in the precordial leads were present according to sex and race.26
They found that up to 3% of African American men and 1% of all other men had ≥0.2 mV ST elevation in leads V2 and V3. Tsuneoka et al reported that 3.2% of healthy Japanese men aged 40–64 years had ≥0.2 mV ST segment elevation in the right precordial leads.27
And 10th grade boys have a higher prevalence of ST elevation than in adults, possibly associated with sex hormones,28
left ventricular hypertrophy,29
or sporting activity.30
The present study provides important data for creating guidelines for early repolarization syndrome in the pediatric field.
T-Wave Amplitude
Throughout childhood, the T-wave pattern, particularly in the precordial leads, is different to that of adults.8
In the right precordial leads, the T wave is often inverted in early childhood and there is a progression of the T wave becoming upright in the sequence of V3, V2, and V1.8
The T wave in V5 and V6 should be upright at all ages except for newborns of 1–3 days of life.8
The present study showed the correct prevalence of a negative T wave in V4, and that was 0% in the 10th grade boys. The prevalence of a monophasic negative T wave in V1 was lower in all age groups in our study compared with that in the study by Davignon et al.5
The exact reason for this difference between studies is unknown, but part of the biphasic T wave might have been judged as negative in the other study.5
Clinical Implications
The present data were based on a final total of 48,401 ECGs, the largest database among published reference data5–10
for children and adolescents. Our study showed that the effects of age and sex were different among ECG parameters, and that the criteria for ventricular hypertrophy should be newly determined by age and sex. Another implication is that these are the first reference data for STJ segment elevation in children and adolescents. The present data can be used as the standard for pediatric ECG findings, although differences in race might have been present, as reported in adults.19
Study Limitations
First, the present study did not obtain ECG findings for continuous age groups, but only for 1st, 7th, and 10th graders. These grades correspond to the 1st year of elementary, junior high, and high school years, respectively, in Japan. These grades are also consistent with the start of group, competitive, and highly or professional competitive sports, respectively, suggesting that these are appropriate times for participation of screening for cardiovascular disease. Second, the voltage standards in the present study are for those with a low bandwidth that are frequently used in the school-based screening system in Japan and may show slightly lower amplitudes of waves. Preliminary conversion equations for use in the clinical setting are shown in
Supplementary File 1. However, the use of ECGs at 3 different age points and the use of a large number of subjects allowed us to obtain important and new findings regarding the parameters of pediatric ECGs.
Conclusions
The present study has reported standard values of pediatric ECG findings using data from a large number of subjects. Our study showed that the effects of age and sex are different among ECG parameters, and that the criteria for ventricular hypertrophy should be newly determined by age and sex. We present the first reference data for STJ segment elevation in children and adolescents. These findings may be useful for creating guidelines and recommendations for interpreting pediatric ECGs.
Name of the Grant
This work was partly supported by a Health and Labour Sciences Research Grant from the Ministry of Health, Labour and Welfare of Japan (H27-019).
Conflicts of Interest
M.Y., M.I., H.H., N.S., H.U., N.I, N.T., and K.A. declare no conflicts of interest. M.N. received research grants from Fukuda Denshi, Co., Ltd. T.Y. is employed by Fukuda Denshi, Co., Ltd.
Supplementary Files
Supplementary File 1
Selection of Normal ECGs
Conversion Equations for Voltage Standards
Table S1.
Number of ECGs excluded in the selection process
Table S2.
Standard values for pediatric electrocardiographic findings
Please find supplementary file(s);
http://dx.doi.org/10.1253/circj.CJ-17-0735
References
- 1.
Maron BJ, Friedman RA, Kligfield P, Levine BD, Viskin S, Chaitman BR, et al. Assessment of the 12-lead electrocardiogram as a screening test for detection of cardiovascular disease in healthy general populations of young people (12–25 years of age). J Am Coll Cardiol 2014; 64: 1479–1514.
- 2.
Mont L, Pelliccia A, Sharma S, Biffi A, Borjesson M, Brugada Terradellas J, et al. Pre-participation cardiovascular evaluation for athletic participants to prevent sudden death. Eur J Prev Cardiol 2017; 24: 41–69.
- 3.
Yoshinaga M, Kucho Y, Nishibatake M, Ogata H, Nomura Y. Probability of diagnosing long QT syndrome in children and adolescents according to the criteria of the HRS/EHRA/APHRS expert consensus statement. Eur Heart J 2016; 37: 2490–2497.
- 4.
Maron BJ, Haas TS, Duncanson ER, Garberich RF, Baker AM, Mackey-Bojack S. comparison of the frequency of sudden cardiovascular deaths in young competitive athletes versus nonathletes: Should we really screen only athletes? Am J Cardiol 2016; 117: 1339–1341.
- 5.
Davignon A, Rautaharju P, Boisselle E, Soumis F, Mégélas M, Choquette A. Normal ECG standards for infants and children. Pediatr Cardiol 1979/1980; 1: 123–152.
- 6.
Macfarlane PW, McLaughlin SC, Devine B, Yang TF. Effects of age, sex, and race on ECG interval measurements. J Electrocardiol 1994; 27(Suppl): 14–19.
- 7.
Rijnbeek PR, Witsenburg M, Schrama E, Hess J, Kors JA. New normal limits for the paediatric electrocardiogram. Eur Heart J 2001; 22: 702–711.
- 8.
Dickinson DF. The normal ECG in childhood and adolescence. Heart 2005; 91: 1626–1630.
- 9.
Semizel E, Oztürk B, Bostan OM, Cil E, Ediz B. The effect of age and gender on the electrocardiogram in children. Cardiol Young 2008; 18: 26–40.
- 10.
Rijnbeek PR, van Herpen G, Bots ML, Man S, Verweij N, Hofman A, et al. Normal values of the electrocardiogram for ages 16–90 years. J Electrocardiol 2014; 47: 914–921.
- 11.
Corrado D, Pelliccia A, Heidbuchel H, Sharma S, Link M, Basso C, et al. Recommendations for interpretation of 12-lead electrocardiogram in the athlete. Eur Heart J 2010; 31: 243–259.
- 12.
International Electrotechnical Commission. IEC 60601-2-25:2011: Medical electrical equipment – Part 2-25: Particular requirements for the basic safety and essential performance of electrocardiographs [International Standard]. https://webstore.iec.ch/publication/2636 (accessed September 5, 2017).
- 13.
Sokolow M, Lyon TP. The ventricular complex in left ventricular hypertrophy as obtained by unipolar precordial and limb leads. Am Heart J 1949; 37: 161–186.
- 14.
Casale PN, Devereux RB, Kligfield P, Eisenberg RR, Miller DH, Chaudhary BS, et al. Electrocadiographic detection of left ventricular hypertrophy: Development and prospective validation of improved criteria. J Am Coll Cardiol 1985; 6: 572–580.
- 15.
Molloy TJ, Okin PM, Devereux RB, Kligfield P. Electrocardiographic detection of left ventricular hypertrophy by the simple QRS voltage-duration product. J Am Coll Cardiol 1992; 20: 1180–1186.
- 16.
Brothers MB, Oster ME, Ehrlich A, Strieper MJ, Mahle WT. Novel electrocardiographic screening criterion for hypertrophic cardiomyopathy in children. Am J Cardiol 2014; 113: 1246–1249.
- 17.
Yoshinaga M, Nagashima M. Difference in the QT intervals between automated and manual measurements. Jpn J Electrophysiol 2013; 32: 427–435 (in Japanese).
- 18.
Hazeki D, Yoshinaga M, Takahashi H, Tanaka Y, Haraguchi Y, Abe M, et al. Cutoffs for screening prolonged QT intervals from Fridericia’s formula in children and adolescents. Circ J 2010; 74: 1663–1669.
- 19.
Santhanakrishnan R, Wang N, Larson MG, Magnani JM, Vasan RS, Wang TJ, et al. Racial differences in electrocardiographic characteristics and prognostic significance in whites versus Asians. J Am Heart Assoc 2016; 5: e002956.
- 20.
Park MK, Guntheroth G. How to read pediatric ECGs. 4th edn. Philadelphia: Mosby, Inc.; 2006.
- 21.
Liebman J, Plonsey R, Gillette P. Pediatric cardiology. Baltimore: Williams & Wilkins, 1982.
- 22.
Mervis DM, Goldberger AL. Electrocardiology. In: Bonow RO, Mann DL, Zipes DP, Libby P, Braunwald E, editors. Braunwald’s heart disease: A text book of cardiovascular medicine, 9th edn. Philadelphia: Saunders, 2012; 126–167.
- 23.
Pardee HE. The significance of an electrocardiogram with a large Q in lead 3. Arch Int Med 1930; 46: 470.
- 24.
Surawicz B, Parikh SR. Prevalence of male and female patterns of early ventricular repolarization in the normal ECG of males and females from childhood to old age. J Am Coll Cardiol 2002; 40: 1870–1876.
- 25.
Haïssaguerre M, Derval N, Sacher F, Jesel L, Deisenhofer I, de Roy L, et al. Sudden cardiac arrest associated with early repolarization. N Engl J Med 2008; 358: 2016–2023.
- 26.
Zarafshar S, Wong M, Singh N, Aggarwal S, Adhikarla C, Froelicher VF. Resting ST amplitude: Prognosis and normal values in an ambulatory clinical population. Ann Noninvasive Electrocardiol 2013; 18: 519–529.
- 27.
Tsuneoka H, Takagi M, Murakoshi N, Yamagishi K, Yokoyama Y, Xu D, et al. Long-term prognosis of Brugada-type ECG and ECG with atypical ST-segment elevation in the right precordial leads over 20 years: Results from the circulatory risk in communities study (CIRCS). J Am Heart Assoc 2016; 5: e002899.
- 28.
Junttila MJ, Tikkanen JT, Porthan K, Oikarinen L, Jula A, Kenttä T, et al. Relationship between testosterone level and early repolarization on 12-lead electrocardiograms in men. J Am Coll Cardiol 2013; 62: 1633–1634.
- 29.
Lohrmann GM, Peters F, Srivathsan K, Essop MR, Mookadam F. Electrocardiographic abnormalities in disease-free black South Africans and correlations with echocardiographic indexes and early repolarization. Am J Cardiol 2016; 118: 765–770.
- 30.
Junttila MJ, Sager SJ, Freiser M, McGonagle S, Castellanos A, Myerburg RJ. Inferolateral early repolarization in athletes. J Interv Card Electrophysiol 2011; 31: 33–38.