Abstract
Background:
Fractional flow reserve (FFR) is widely used for the assessment of myocardial ischemia. Intravascular ultrasound (IVUS) is an intracoronary imaging method that provides information about lumen and vessel morphology. Previous studies on the expanded use of IVUS to identify functional ischemia have noted an association between anatomy and physiology, but IVUS-derived minimum lumen area (MLA) has a weak-moderate correlation with myocardial ischemia compared with FFR. We developed a method to calculate FFR using IVUS-derived anatomical information for the assessment of myocardial ischemia. The aims of this study were to investigate the relationship between wire-based FFR and IVUS-derived FFR (IVUS-FFR) and to compare the usefulness of IVUS-FFR and IVUS-derived MLA for functional assessment.
Methods and Results:
We retrospectively analyzed 50 lesions in 48 patients with coronary stenosis who underwent IVUS and FFR simultaneously. IVUS-FFR was calculated using our original algorithm and fluid dynamics. Mean percent diameter stenosis determined on quantitative coronary angiography and on FFR was 56.4±10.7 and 0.69±0.08, respectively. IVUS-FFR had a stronger linear correlation with FFR (R=0.78, P<0.001; root mean square error, 0.057 FFR units) than with IVUS-derived MLA (R=0.43, P=0.002).
Conclusions:
IVUS-FFR may be a more valuable method to identify myocardial ischemia, compared with IVUS-derived MLA.
The assessment of functional myocardial ischemia has an influence on the choice of management approach between medical therapy and revascularization.1
Previous studies have shown that fractional flow reserve (FFR)-guided percutaneous coronary intervention (PCI) reduces major adverse cardiac events in patients with coronary artery disease (CAD).2–6
Intravascular ultrasound (IVUS) is an intracoronary imaging method that can provide information about lumen area, vessel area, and plaque burden that can be used for the guidance of PCI. Previous studies have investigated the expanded use of IVUS to identify hemodynamically severe stenosis, using FFR as a standard of reference.7–13
These studies noted an association between anatomy and physiology, but they suggested that minimum lumen area (MLA) has a weak-moderate correlation with myocardial ischemia. Fluid dynamics have proven to be the method of choice for obtaining accurate readings of flow in subject-specific arterial geometries. We previously reported that optical coherence tomography (OCT)-derived FFR, which was calculated using a basic fluid dynamics equation, had a stronger correlation with FFR compared with conventional image-based measurements.14
We also developed a method to calculate IVUS-derived FFR (IVUS-FFR), which is calculated from an original fluid dynamics-based algorithm, for the assessment of myocardial ischemia. The aims of this study were to (1) investigate the relationship between wire-based FFR and IVUS-FFR; and (2) compare the usefulness of IVUS-FFR and IVUS-derived MLA for the functional assessment of CAD.
Methods
Study Design
Between April 2014 and June 2017, 57 lesions in 55 patients with stable angina pectoris were examined using both IVUS and FFR for the assessment of myocardial ischemia at Ehime University Graduate School of Medicine. Patients who had severe left ventricular (LV) hypertrophy, hypertrophic cardiomyopathy, severe systolic dysfunction, an infarct-related artery, significant valvular disease, left main trunk-left anterior descending coronary artery or left main trunk-left circumflex coronary artery true bifurcation lesion in addition to a history of PCI in the target vessel, lesion length >60 mm in the left coronary artery, target vessel implanted with ≥2 stents, or severe respiratory disease with home oxygen therapy were excluded from the present study. Seven lesions (7 patients) were excluded due to meeting the exclusion criteria. The present institutional review board approved the retrospective use of patient data for this study (Institutional Review Board of Ehime University Hospital, approval no. 1606007). The requirement for informed consent was waived due to the retrospective nature of the study. Patient records and information were anonymized and de-identified prior to analysis.
Coronary Angiography and FFR
Coronary angiography was performed using 6- or 7-Fr coronary catheters. Intracoronary isosorbide dinitrate was given before angiography, IVUS, and advancement of the pressure-monitoring guidewire (Verrata, Phillips, MA, USA, or AERIS, Abbott, CA, USA) into the distal coronary vessel past the lesion. The visual severity of coronary artery stenosis was evaluated based on the American Heart Association classification system.
FFR was performed before any intervention took place. Hyperemia was induced by i.v. adenosine triphosphate at a rate of 0.16 mg/kg/min as previously reported.15
Quantitative coronary angiography analysis was performed offline by an experienced analyst, who was blinded to the IVUS and FFR results, using CAAS II (Pie Medical Imaging BV, Netherlands). After selection of the optimal projection displaying the most severe stenosis, percent diameter stenosis (%DS) at end-diastole, minimum lumen diameter, reference vessel diameter, and lesion length were measured.
IVUS
IVUS analysis was performed with a validated quantitative IVUS analysis system (VISIATLAS, Terumo, Tokyo, Japan) by an experienced investigator, blinded to clinical information except coronary angiography data. An IVUS lesion was defined as >0.5-mm atherosclerotic plaque thickness.16
Gray-scale IVUS and ultrasound signals were acquired with a commercially available IVUS imaging system (VISIWAVE, Terumo) using a 43-MHz mechanically rotating IVUS catheter (View IT, Terumo). IVUS was performed using motorized pullback at 0.5 mm/s to include proximal and distal Luer connectors. Quantitative IVUS measurements for each frame (median interslice distance, 1.0 mm) included external elastic membrane (EEM), lumen, and plaque and media (EEM minus lumen) cross-sectional area, plaque burden (plaque and media divided by EEM), and MLA. Area stenosis was calculated by the following formula: 1−(MLA/proximal reference lumen cross-sectional area). Volumes were calculated using Simpson’s rule and reported as normalized area (volume divided by length). The plaque burden (%) was calculated as the TPV/total vessel volume×100. The percentage of lipid area and the percentage of fibrous area at each slice were automatically calculated using the integrated backscatter (IB)-IVUS system. The total lipid volume (TLV) and total fibrous volume (TFV) were also calculated using Simpson’s method. The percentage of TLV and the percentage of TFV were calculated according to the following formulas: TLV/TPV×100, TFV/TPV×100. The percent change in each volume was calculated as: (volume at follow-up−volume at baseline)/volume at baseline×100.17
IVUS-FFR
IVUS-FFR was determined using our original algorithm, which was developed with the Fluid Dynamics Laboratory at Ehime University. Gould et al have shown that the calculated pressure loss (∆P) across an area of stenosis can be described by the following simplified equation: ∆P=FV+SV2.18

where µ is absolute blood viscosity, L is stenosis length, An
is cross-sectional area of the normal artery (reference lumen area), As
is cross-sectional area of the stenosis segment, V is flow velocity, ρ is blood density, k is a constant related to entrance and exit effects here equal to 1, and F and S are the coefficients of pressure loss due to viscous friction and exit separation. Resistance was calculated from IVUS geometry for both Poiseuille resistance due to viscous friction (F), assuming laminar flow in the converging portion of the stenosis, and for resistance due to exit separation (S) due to vortex formation in the diverging portion of the stenosis. In this study, the coefficients were described as µ=4.0×10⁻³ Pa·s, and ρ=1,050 kg/m3. These were calculated using IVUS measurements L, An, and As.
The coefficients F and S were determined by the morphology of the coronary stenosis (length, axial and cross-sectional shapes, diameter of the normal artery, and minimum cross-sectional area of the stenosis).19
Longitudinal length per frame of IVUS was 1 mm. The sum of resistance of all of the frames was equivalent to the Poiseuille resistance of the entire lesion. Coefficient S was calculated using the MLA and the larger area of the proximal or distal reference area. A representative case and calculation are shown in
Figure 1.

We calculated IVUS-FFR using stenotic flow reserve (SFR). Assuming a mean arterial pressure of 100 mmHg, the coronary flow can increase to 5- or 4.2-fold its value at rest without stenosis.18,20–23
In this study, maximum SFR was determined as 4.2. Patient-specific SFR was calculated by the following equation (Figure 2): Pc=100−∆P=100−(FV+SV2), where Pc (coronary pressure distal to the stenosis) is defined as the translesional pressure. In
Figure 2, Pc is plotted on the vertical axis, and coronary artery velocity (V) is plotted on the horizontal axis as a ratio of velocity at hyperemia to velocity at normal flow at rest (Vhyperemia/Vrest=SFR). In the SFR calculation, coronary flow velocity=0.2 m/s results in SFR=1, and coronary flow velocity=0.4 m/s produces SFR=2. The dotted line plots the relationship between coronary perfusion pressure and coronary flow under conditions of maximum coronary vasodilation in the presence of a stenosis, as previously documented experimentally,21
according to the equation: 10+[(100−10)/4.2×SFR. The solid line is a plot of the relation between Pc and flow in the presence of a stenosis. This solid line is the graphic plot of the equation at the bottom of the figure derived from the equation: 100−∆P=100−(FV+SV2). The intersection of the curve with the line representing coronary perfusion pressure under hyperemia is the patient-specific SFR.
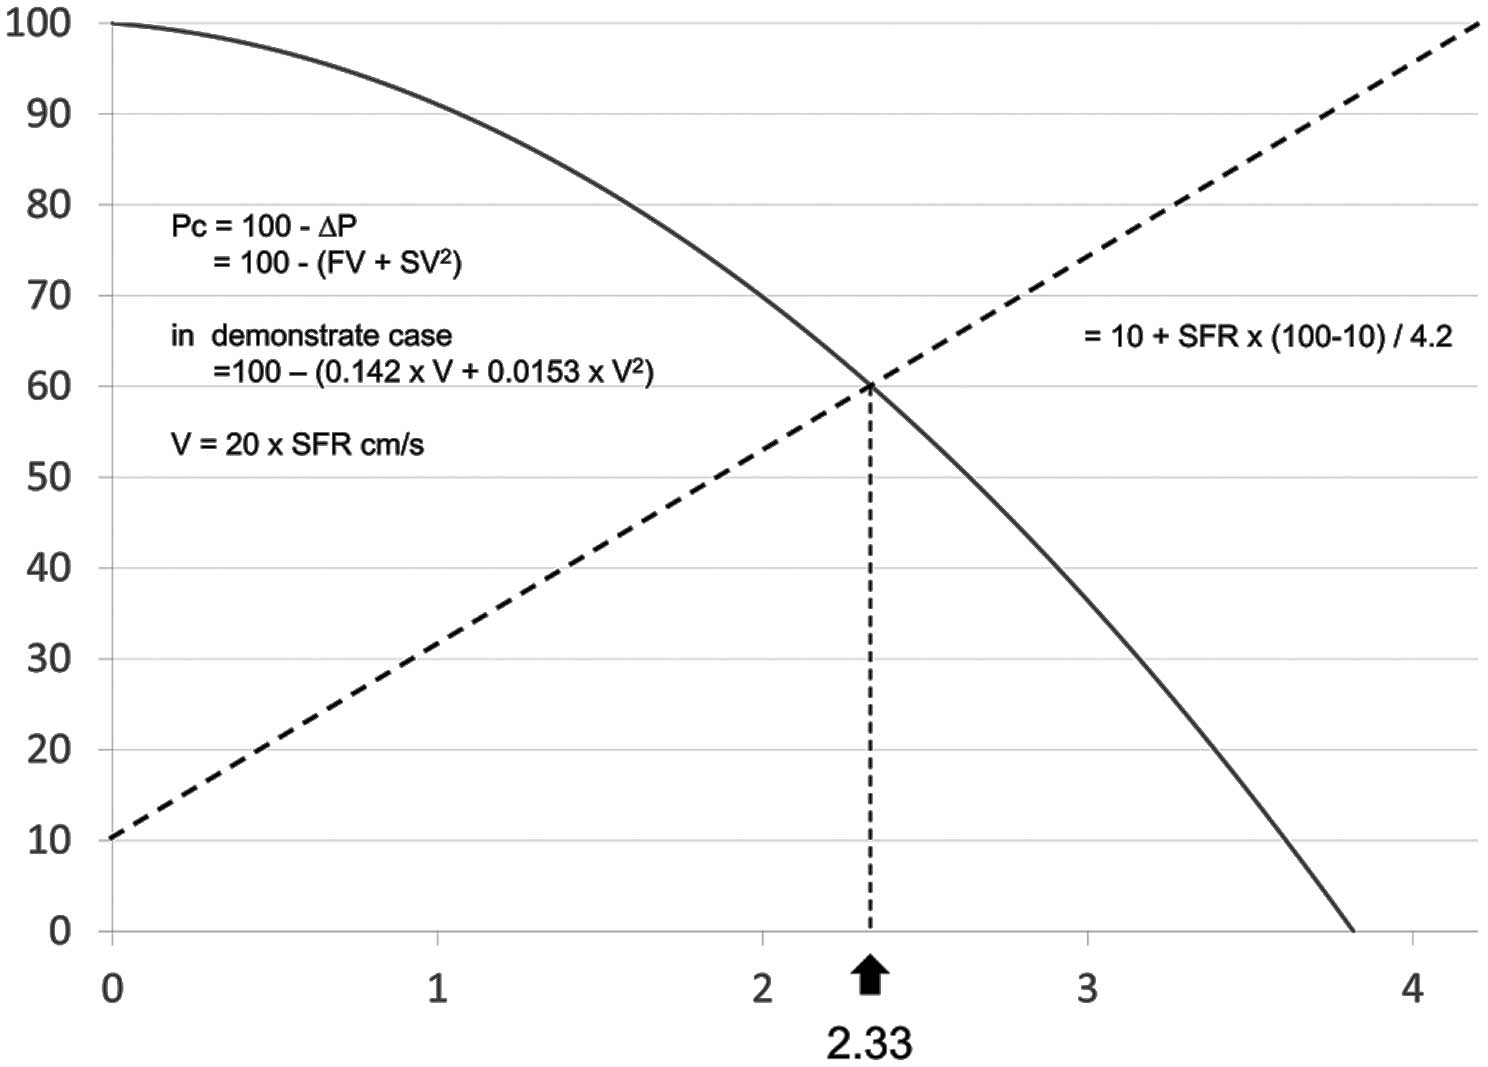
In the representative case, SFR was calculated to be 2.33 (Figure 1). It is important that we use basal coronary flow velocity (0.2 m/s) only for SFR calculation, as explained in previous studies.21,23
Details of the calculation conditions are described in the Appendix. For the next calculation, we use coronary and phase-specific velocities.
According to previous reports, basal (diastolic/systolic) left coronary artery flow was determined as (20/10) cm/s, and basal (diastolic/systolic) right coronary artery flow was determined as (15/10) cm/s using our algorithm.24
Diastolic phase pressure loss (diastolic ∆P) is calculated using the following equation: [F×(basal coronary flow velocity×SFR)]+[S×(basal coronary flow velocity×SFR)2]. Systolic-phase pressure loss (systolic ∆P) is calculated by the following equation: [F×(basal coronary flow velocity×SFR)]+[S×(basal coronary flow velocity×SFR)2].
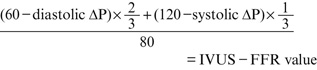
In this study, we assumed the systolic/diastolic (mean) blood pressure to be 120/60 (80) mmHg based on previous studies.15,25
Diastolic-phase pressure is calculated using the following equation: 60−(diastolic ∆P). Systolic phase pressure is calculated using the following equation: 120−(systolic ∆P). The proportion of diastolic time was determined as 2/3 of the complete cardiac cycle. Finally, IVUS-FFR was calculated using the following equation:
Statistical Analysis
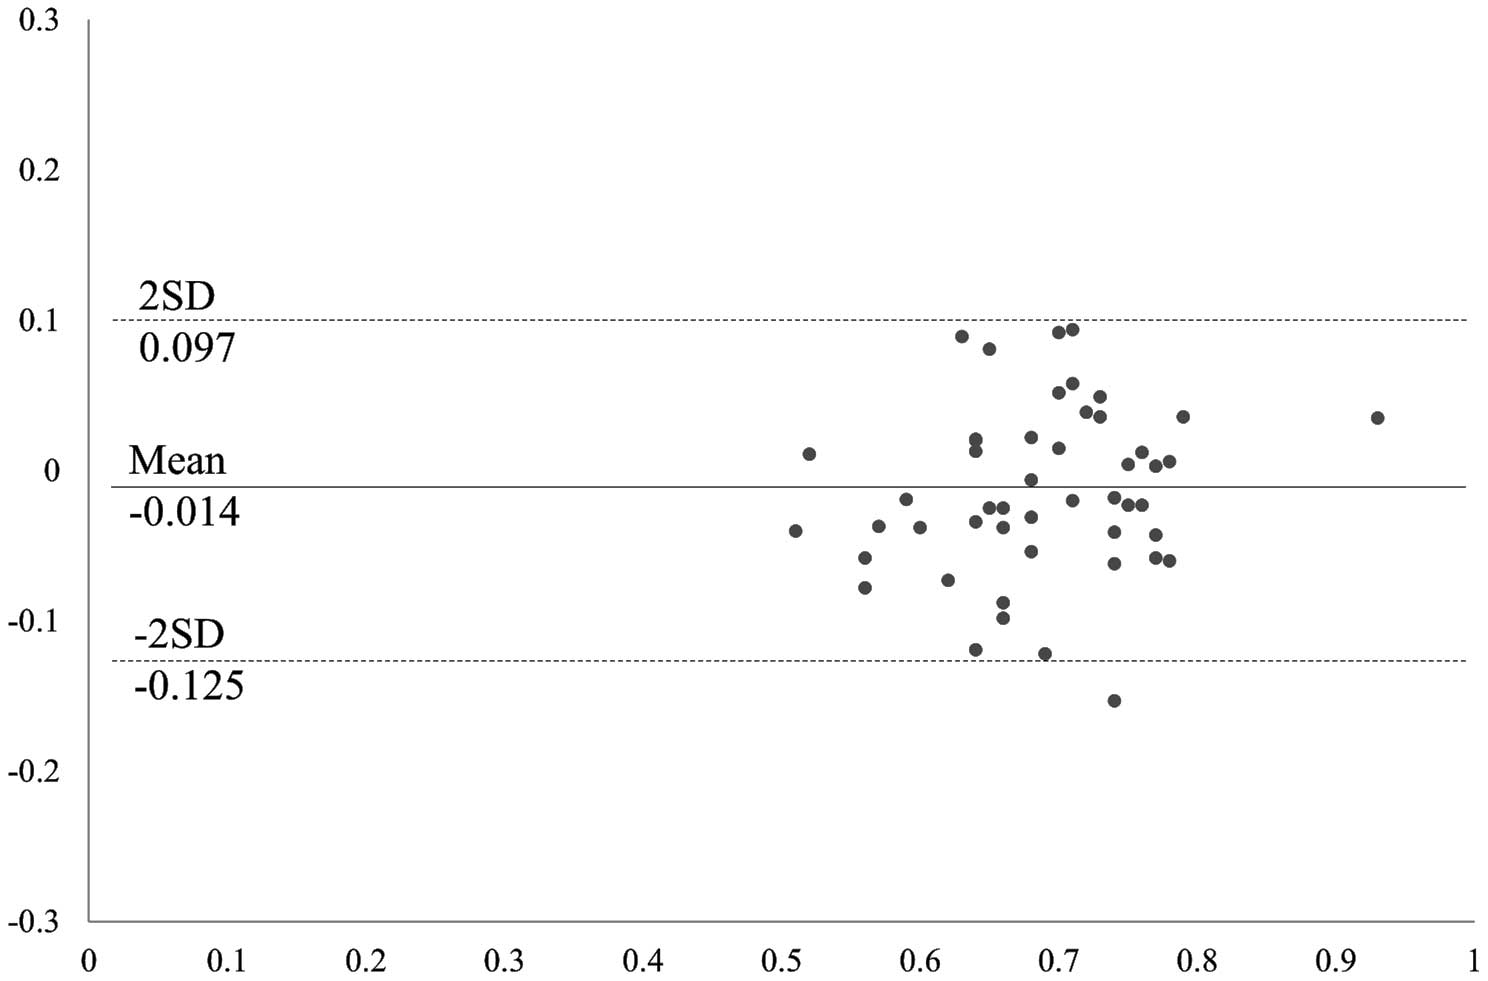
Statistical analysis was performed using SPSS version 18.0 (IBM, Armonk, NY, USA). Categorical variables are summarized as n (%). Continuous variables are presented as mean±SD. Linear regression analysis was performed to determine the correlation between wire-based FFR and IVUS-FFR. Bland-Altman analysis was performed to compare the measurements of wire-based FFR and IVUS-FFR. P<0.05 was considered to indicate statistical significance.
Results
Baseline clinical and lesion characteristics are listed in
Table 1. Mean patient age was 69.0±9.6 years, and 83% were male. The correlations of quantitative coronary angiography and IVUS parameters with wire-based FFR are listed in
Table 2. On quantitative angiographic analysis, the mean stenosis diameter and minimum lumen diameter were 56.4±10.7% and 1.10±0.33 mm, respectively. Mean IVUS-derived MLA, percent area stenosis (%AS), IVUS-FFR and wire-based FFR were 1.74±0.65 mm2, 73.9±17.7, 0.703±0.088, and 0.689±0.077, respectively. IVUS-FFR showed a stronger linear correlation with wire-based FFR (R=0.781, P<0.001; root mean square error=0.057 FFR units,
Figure 3A) than with quantitative coronary angiography −%DS (R=−0.427, P=0.002), IVUS measurements of MLA (R=0.428, P=0.002,
Figure 3B), and %AS (R=−0.470, P=0.001,
Figure 3D). Only IVUS-FFR had a strong correlation with wire-based FFR (Figure 4). There was no significant correlation between plaque characteristics and FFR (Table 2).
Table 1.
Baseline Clinical Patient and Lesion Characteristics
| Patient characteristics |
n=48 |
| Age (years) |
69.0±9.6 |
| Men |
40 (83) |
| Height (cm) |
163.2±9.5 |
| Body weight (kg) |
63.7±12.2 |
| BMI (kg/m2) |
23.8±3.4 |
| Hypertension |
36 (75) |
| Dyslipidemia |
34 (71) |
| Current smoker |
17 (35) |
| Diabetes mellitus |
26 (54) |
| Previous MI |
6 (13) |
| Previous PCI |
19 (40) |
| Previous CABG |
0 |
| Lesion characteristics |
n=50 |
| Index coronary artery |
| Left main trunk |
2 (4) |
| Left anterior descending |
32 (64) |
| Left circumflex |
7 (14) |
| Right |
9 (18) |
| AHA classification type B2+C |
24 (48) |
Data given as mean±SD or n (%). AHA, American Heart Association; BMI, body mass index; CABG, coronary artery bypass grafting; MI, myocardial infarction; PCI, percutaneous coronary intervention.
Table 2.
Correlation of Coronary Angiography and IVUS for FFR
| |
|
R |
P-value |
| QCA |
| Diameter stenosis (%) |
56.4±10.7 |
−0.427 |
0.002 |
| Minimum lumen diameter (mm) |
1.10±0.33 |
0.281 |
0.048 |
| Reference vessel diameter (mm) |
2.56±0.60 |
−0.072 |
0.621 |
| Lesion length (mm) |
26.8±18.3 |
0.027 |
0.854 |
| IVUS analysis at MLA site |
| Lumen CSA (mm2) |
1.74±0.65 |
0.428 |
0.002 |
| EEM CSA (mm2) |
11.0±4.4 |
0.122 |
0.452 |
| Area stenosis (%) |
73.9±17.7 |
−0.470 |
0.001 |
| Plaque burden (%) |
83.0±5.8 |
−0.344 |
0.015 |
| Proximal reference lumen CSA (mm2) |
8.07±3.39 |
−0.308 |
0.030 |
| IVUS volumetric analysis |
| Lesion length (mm) |
34.2±17.7 |
−0.174 |
0.228 |
| Mean EEM CSA (mm3/mm) |
12.2±4.4 |
−0.013 |
0.927 |
| Mean lumen CSA (mm3/mm) |
4.8±1.8 |
−0.013 |
0.929 |
| Plaque burden (%) |
59.9±8.7 |
−0.099 |
0.495 |
| IVUS-FFR parameters |
| Coefficient of f (s/cm×10−1) |
2.10±1.29 |
−0.382 |
0.006 |
| Coefficient of s (s2/cm2×10−3) |
9.47±8.43 |
−0.546 |
<0.001 |
| Stenotic flow reserve |
2.66±0.47 |
0.680 |
<0.001 |
| IVUS-derived pressure loss (mmHg) |
24.2±7.3 |
−0.685 |
<0.001 |
| IVUS-FFR |
0.703±0.088 |
0.781 |
<0.001 |
| FFR measurements |
| FFR |
0.689±0.077 |
|
|
| FFR ≤0.8 |
49 (98) |
|
|
| Wire-based pressure loss (mmHg) |
26.0±8.7 |
|
|
| Mean aortic pressure (mmHg) |
84.0±14.1 |
|
|
| Wire-based mean translesional pressure (mmHg) |
58.0±11.0 |
|
|
| IVUS evaluations |
| Max calcification arc (°) |
195±131 |
0.005 |
0.972 |
| Attenuated plaque |
27 (54) |
|
0.949 |
| IB-IVUS at MLA site |
| Calcium (%) |
2.9±2.9 |
0.211 |
0.141 |
| Dens fibrosis (%) |
7.0±4.0 |
0.15 |
0.298 |
| Fibrosis (%) |
34.6±9.8 |
−0.199 |
0.165 |
| Lipid (%) |
55.5±13.1 |
0.057 |
0.693 |
| IB-IVUS volumetric analysis |
| Calcium (%) |
2.5±1.9 |
0.077 |
0.593 |
| Dens fibrosis (%) |
6.7±3.5 |
0.063 |
0.666 |
| Fibrosis (%) |
39.7±8.5 |
−0.116 |
0.424 |
| Lipid (%) |
51.1±12.4 |
0.049 |
0.735 |
Data given as mean±SD or n (%). CSA, cross-sectional area; EEM, external elastic membrane; FFR, fractional flow reserve; IB, integrated backscatter; IVUS, intravascular ultrasound; MLA, minimum lumen area; QCA, quantitative coronary angiography.

Discussion
The major findings of this study are as follows: IVUS-FFR was strongly correlated with wire-based FFR, while IVUS and angiographic anatomical measurements, including IVUS-derived MLA, had weak-moderate linear correlations with FFR, consistent with previous studies. Therefore, IVUS-FFR may provide useful diagnostic information that can predict functional ischemia based on wire-based FFR.
Over the past 20 years, there has been an ongoing discussion of the differences between anatomical and functional assessment of coronary stenosis. This debate has extended to intracoronary imaging techniques. IVUS studies, however, have demonstrated mild-moderate correlations between structural severity and functional severity using MLA. Takagi et al first reported that IVUS-derived MLA ≤3.0 mm2
predicted FFR ≤0.75 in 42 patients.7
Briguori et al also evaluated 53 intermediate lesions, and suggested that IVUS-derived MLA ≤4.0 mm2
had a sensitivity of 92% and specificity of 56% for detecting FFR ≤0.75.8
Previous reports using IVUS-derived MLA to assess myocardial ischemia are summarized in
Table 3.7–13,26,27
The accuracy of IVUS-derived MLA to identify functional ischemia ranged from 66% to 79%. Thus, IVUS-derived MLA is limited in accuracy. Moreover, the MLA cut-offs for myocardial ischemia were 2.36–4.0 mm2, representing a very wide cut-off range. MLA, which is a single cross-sectional area of a vessel, is only one of many factors influencing flow, and it does not reflect the amount of myocardium. Therefore, previous studies attempted to determine the cut-off based on reference vessel diameter.11,13
Flow separation, known as Bernoulli’s principle, can be calculated using MLA and reference vessel diameter. Although this method represents an improvement over the use of MLA alone, it does not consider lesion longitudinal structure, which also affects myocardial ischemia. Therefore, we think that myocardial ischemia cannot be accurately measured using only reference vessel diameter and MLA. We previously reported that OCT-derived FFR, which was calculated using fluid dynamics, was strongly correlated with wire-based FFR.14
In the present study, IVUS-FFR, which reflects not only MLA and reference vessel diameter but also longitudinal structure, also had a good correlation with wire-based FFR. Many studies have reported the existence of lesions with anatomical and physiological mismatch.28
It is possible that there is no way to accurately evaluate anatomical severity. IVUS-FFR is a relatively simple technique that can accurately evaluate the anatomical severity of coronary lesions, and therefore it is expected to help clarify the detailed association and true frequency of mismatch between anatomy and physiology.
Table 3.
Calculation of MLA Using IVUS for Myocardial Ischemia
| Study |
Year |
n |
Against |
Imaging
modality |
Cut-off MLA
(mm2) |
R |
Sensitivity
(%) |
Specificity
(%) |
Accuracy
(%) |
| Nishioka et al26 |
J Am Coll Cardiol,
1999 |
70 |
SPECT |
IVUS |
4.0 |
– |
88 |
90 |
– |
| Takagi et al7 |
Circulation, 1999 |
51 |
0.75 |
IVUS |
3.0 |
0.786 |
83.0 |
92.3 |
– |
| Briguori et al8 |
Am J Cardiol, 2001 |
53 |
0.75 |
IVUS |
4.0 |
0.41 |
92 |
56 |
79 |
| Ben-Dor et al9 |
EuroIntervention,
2011 |
92 |
0.80 |
IVUS |
3.2 |
0.34 |
69.2 |
68.3 |
70 |
| Kang et al10 |
Circ Cardiovasc
Interv, 2011 |
236 |
0.80 |
IVUS |
2.4 |
0.507 |
90 |
60 |
68 |
| Kang et al11 |
Am J Cardiol, 2012 |
784 |
0.80 |
IVUS |
2.4 |
0.481 |
83.2 |
62.6 |
68.5 |
| Koo et al12 |
JACC Cardiovasc
Interv, 2011 |
267 |
0.80 |
IVUS |
2.75 |
– |
69 |
65 |
67 |
| Gonzalo et al27 |
J Am Coll Cardiol,
2012 |
47 |
0.80 |
IVUS |
2.36 |
0.141 |
67 |
65 |
66 |
| Waksman et al13 |
J Am Coll Cardiol,
2013 |
367 |
0.80 |
IVUS |
3.07 |
0.55 |
64.0 |
64.9 |
– |
SPECT, single-photon emission computed tomography. Other abbreviations as in Table 2.
Coronary computed tomography (CT) angiography-derived FFR, which is based on computational fluid dynamics, can predict myocardial ischemia accurately,29,30
and is an excellent method for detecting myocardial ischemia. CT angiography-derived FFR, however, has some limitations. A difference in error of 600 μm on CT greatly affects the calculation of FFR, and calcified lesions are difficult to analyze with coronary CT.23
IVUS is superior to CT in spatial resolution and can accurately measure any type of lesion. CT angiography-derived FFR also requires high computing capacity and a long calculation time. Furthermore, 3-D reconstruction of the coronary artery requires extremely high skill, knowledge, and time. In contrast, our method uses basic fluid dynamics and does not require a high-performance computer. Therefore, IVUS-FFR is easy to determine and the calculation time is short. Therefore, we believe that IVUS-FFR will be useful in daily catheter laboratory practice.
Previously published papers that calculated FFR using intravascular imaging are summarized in
Table 4.14,31–33
We were unable to find any previous studies that reported the calculation of FFR using IVUS. Compared with previous methods, IVUS-FFR produced similar results. In addition, the IVUS-FFR technique reported here is the only FFR calculation method to use IVUS. Zafar et al and Guagliumi et al reported that accurate volumetric measurement of the lumen profile with OCT correlates closely with FFR.31,32
These methods calculate the resistance of each coronary lesion. Ha et al reported that OCT-derived FFR, which depends on computational fluid dynamics, could accurately predict myocardial ischemia, and suggested that computational fluid dynamics might enable the assessment of functional information.33
Although computational fluid dynamics is a useful method to calculate FFR, it requires a high-performance computer, long calculation time, and strict 3-D reconstruction of the coronary arteries. Therefore, FFR may be difficult to calculate in catheter laboratories in daily practice using computational fluid dynamics. In the near future, the adoption of 60-MHz IVUS systems in daily practice is becoming increasingly widespread, and automated lumen tracing methods are expected to improve. Therefore, IVUS-FFR may become a routine method in catheter laboratories.
Table 4.
Calculation of FFR Using Intracoronary Imaging
| Study |
Year |
Method |
Imaging
modality |
R |
| IVUS-FFR |
Present study |
Basic fluid dynamics |
IVUS |
0.78 |
| Seike et al (our method)14 |
Am J Cardiol, 2017 |
Basic fluid dynamics |
OCT |
0.89 |
| Ha et al33 |
Circ Cardiovasc Interv, 2016 |
CFD |
OCT |
0.72 |
| Guagliumi et al32 |
Eurointervention, 2013 |
Vascular resistance ratio |
OCT |
0.81 |
| Zafar et al31 |
Int Heart J, 2014 |
Blood flow resistance model |
OCT |
0.69 |
CFD, computational fluid dynamics; OCT, optical coherence tomography. Other abbreviations as in Table 2.
This study had several limitations. First, this retrospective study included a relatively small number of discrete coronary lesions. Given, however, that almost all exclusions were made on the basis of less reliable IVUS measurements, selection bias is unlikely. Despite the small sample size, a good correlation was seen between the IVUS-FFR and FFR measurements. Second, our algorithm assumed several parameters. Third, the present study did not consider the influence of side branches. Flow rate is difficult to calculate for bifurcation lesions. Flow rate has an effect on pressure loss. Guagliumi et al reported that accurate volumetric measurement of the lumen profile with OCT correlates closely with FFR.32
It is difficult, however, to render all lumen borders in a clinical situation in daily practice. Therefore, we constructed a simple algorithm for IVUS-FFR. Fourth, IVUS-FFR could not evaluate the effect of curvature. There was no information about curvature of the coronary artery on IVUS. And fifth, this study did not include patients with severe LV hypertrophy, hypertrophic cardiomyopathy, severe systolic dysfunction, an infarct-related artery, or significant valvular disease, because these disorders might influence coronary circulation. In the present study IVUS-FFR was calculated based on normal coronary circulation. Therefore, to precisely evaluate patients with these disorders, further investigation is needed.
Conclusions
IVUS-FFR, which was calculated using an original fluid dynamics-based algorithm, was more strongly correlated with wire-based FFR than MLA. IVUS-FFR may provide useful information for the assessment of myocardial ischemia, and this novel algorithm may help to clarify the true association between anatomy and physiology in patients with CAD.
Acknowledgments
We are grateful to Motosuke Sogo for writing the IVUS-FFR calculation algorithm.
Funding Sources
This work was supported by JSPS KAKENHI Grant Number 10771561.
Disclosures
J.H. received research grants from Abbott Vascular Japan. The other authors declare no conflicts of interest.
References
- 1.
Escaned J, Banning A, Farooq V, Echavarria-Pinto M, Onuma Y, Ryan N, et al. Rationale and design of the SYNTAX II trial evaluating the short to long-term outcomes of state-of-the-art percutaneous coronary revascularisation in patients with de novo three-vessel disease. EuroIntervention 2016; 12: e224–e234.
- 2.
Tonino PA, De Bruyne B, Pijls NH, Siebert U, Ikeno F, van’t Veer M, et al. Fractional flow reserve versus angiography for guiding percutaneous coronary intervention. N Engl J Med 2009; 360: 213–224.
- 3.
De Bruyne B, Pijls NH, Kalesan B, Barbato E, Tonino PA, Piroth Z, et al. Fractional flow reserve-guided PCI versus medical therapy in stable coronary disease. N Engl J Med 2012; 367: 991–1001.
- 4.
De Backer O, Biasco L, Lonborg J, Pedersen F, Holmvang L, Kelbaek H, et al. Long-term outcome of FFR-guided PCI for stable coronary artery disease in daily clinical practice: A propensity score-matched landmark analysis. EuroIntervention 2016; 11: e1257–e1266.
- 5.
Tanaka H, Chikamori T, Tanaka N, Hida S, Igarashi Y, Yamashita J, et al. Diagnostic performance of a novel cadmium-zinc-telluride gamma camera system assessed using fractional flow reserve. Circ J 2014; 78: 2727–2734.
- 6.
Shiono Y, Kubo T, Tanaka A, Ino Y, Yamaguchi T, Tanimoto T, et al. Long-term outcome after deferral of revascularization in patients with intermediate coronary stenosis and gray-zone fractional flow reserve. Circ J 2015; 79: 91–95.
- 7.
Takagi A, Tsurumi Y, Ishii Y, Suzuki K, Kawana M, Kasanuki H. Clinical potential of intravascular ultrasound for physiological assessment of coronary stenosis: Relationship between quantitative ultrasound tomography and pressure-derived fractional flow reserve. Circulation 1999; 100: 250–255.
- 8.
Briguori C, Anzuini A, Airoldi F, Gimelli G, Nishida T, Adamian M, et al. Intravascular ultrasound criteria for the assessment of the functional significance of intermediate coronary artery stenoses and comparison with fractional flow reserve. Am J Cardiol 2001; 87: 136–141.
- 9.
Ben-Dor I, Torguson R, Gaglia MA Jr, Gonzalez MA, Maluenda G, Bui AB, et al. Correlation between fractional flow reserve and intravascular ultrasound lumen area in intermediate coronary artery stenosis. EuroIntervention 2011; 7: 225–233.
- 10.
Kang SJ, Lee JY, Ahn JM, Mintz GS, Kim WJ, Park DW, et al. Validation of intravascular ultrasound-derived parameters with fractional flow reserve for assessment of coronary stenosis severity. Circ Cardiovasc Interv 2011; 4: 65–71.
- 11.
Kang SJ, Ahn JM, Song H, Kim WJ, Lee JY, Park DW, et al. Usefulness of minimal luminal coronary area determined by intravascular ultrasound to predict functional significance in stable and unstable angina pectoris. Am J Cardiol 2012; 109: 947–953.
- 12.
Koo BK, Yang HM, Doh JH, Choe H, Lee SY, Yoon CH, et al. Optimal intravascular ultrasound criteria and their accuracy for defining the functional significance of intermediate coronary stenoses of different locations. JACC Cardiovasc Interv 2011; 4: 803–811.
- 13.
Waksman R, Legutko J, Singh J, Orlando Q, Marso S, Schloss T, et al. FIRST: Fractional flow reserve and intravascular ultrasound relationship study. J Am Coll Cardiol 2013; 61: 917–923.
- 14.
Seike F, Uetani T, Nishimura K, Kawakami H, Higashi H, Aono J, et al. Intracoronary optical coherence tomography-derived virtual fractional flow reserve for the assessment of coronary artery disease. Am J Cardiol 2017; 120: 1772–1779.
- 15.
Miyagawa M, Kumano S, Sekiya M, Watanabe K, Akutzu H, Imachi T, et al. Thallium-201 myocardial tomography with intravenous infusion of adenosine triphosphate in diagnosis of coronary artery disease. J Am Coll Cardiol 1995; 26: 1196–1201.
- 16.
Kapadia SR, Nissen SE, Ziada KM, Guetta V, Crowe TD, Hobbs RE, et al. Development of transplantation vasculopathy and progression of donor-transmitted atherosclerosis: Comparison by serial intravascular ultrasound imaging. Circulation 1998; 98: 2672–2678.
- 17.
Inaba S, Okayama H, Funada J, Higashi H, Saito M, Yoshii T, et al. Impact of type 2 diabetes on serial changes in tissue characteristics of coronary plaques: An integrated backscatter intravascular ultrasound analysis. Eur Heart J Cardiovasc Imaging 2012; 13: 717–723.
- 18.
Gould KL, Kelley KO, Bolson EL. Experimental validation of quantitative coronary arteriography for determining pressure-flow characteristics of coronary stenosis. Circulation 1982; 66: 930–937.
- 19.
Tron C, Kern MJ, Donohue TJ, Bach RG, Aguirre FV, Caracciolo EA, et al. Comparison of quantitative angiographically derived and measured translesion pressure and flow velocity in coronary artery disease. Am J Cardiol 1995; 75: 111–117.
- 20.
Seike F, Uetani T, Nishimura K, Iio C, Kawakami H, Fujimoto K, et al. Correlation between quantitative angiography-derived translesional pressure and fractional flow reserve. Am J Cardiol 2016; 118: 1158–1163.
- 21.
Kirkeeide RL, Gould KL, Parsel L. Assessment of coronary stenoses by myocardial perfusion imaging during pharmacologic coronary vasodilation. VII. Validation of coronary flow reserve as a single integrated functional measure of stenosis severity reflecting all its geometric dimensions. J Am Coll Cardiol 1986; 7: 103–113.
- 22.
Pijls NH, van Son JA, Kirkeeide RL, De Bruyne B, Gould KL. Experimental basis of determining maximum coronary, myocardial, and collateral blood flow by pressure measurements for assessing functional stenosis severity before and after percutaneous transluminal coronary angioplasty. Circulation 1993; 87: 1354–1367.
- 23.
Johnson NP, Kirkeeide RL, Gould KL. Coronary anatomy to predict physiology: Fundamental limits. Circ Cardiovasc Imaging 2013; 6: 817–832.
- 24.
Wieneke H, Haude M, Ge J, Altmann C, Kaiser S, Baumgart D, et al. Corrected coronary flow velocity reserve: A new concept for assessing coronary perfusion. J Am Coll Cardiol 2000; 35: 1713–1720.
- 25.
Leppo JA. Comparison of pharmacologic stress agents. J Nucl Cardiol 1996; 3: S22–S26.
- 26.
Nishioka T, Amanullah AM, Luo H, Berglund H, Kim CJ, Nagai T, et al. Clinical validation of intravascular ultrasound imaging for assessment of coronary stenosis severity: Comparison with stress myocardial perfusion imaging. J Am Coll Cardiol 1999; 33: 1870–1878.
- 27.
Gonzalo N, Escaned J, Alfonso F, Nolte C, Rodriguez V, Jimenez-Quevedo P, et al. Morphometric assessment of coronary stenosis relevance with optical coherence tomography: A comparison with fractional flow reserve and intravascular ultrasound. J Am Coll Cardiol 2012; 59: 1080–1089.
- 28.
Park SJ, Kang SJ, Ahn JM, Shim EB, Kim YT, Yun SC, et al. Visual-functional mismatch between coronary angiography and fractional flow reserve. JACC Cardiovasc Interv 2012; 5: 1029–1036.
- 29.
Norgaard BL, Leipsic J, Koo BK, Zarins CK, Jensen JM, Sand NP, et al. Coronary computed tomography angiography derived fractional flow reserve and plaque stress. Curr Cardiovasc Imaging Rep 2016; 9: 2.
- 30.
Min JK, Taylor CA, Achenbach S, Koo BK, Leipsic J, Norgaard BL, et al. Noninvasive fractional flow reserve derived from coronary CT angiography: Clinical data and scientific principles. JACC Cardiovasc Imaging 2015; 8: 1209–1222.
- 31.
Zafar H, Sharif F, Leahy MJ. Feasibility of intracoronary frequency domain optical coherence tomography derived fractional flow reserve for the assessment of coronary artery stenosis. Int Heart J 2014; 55: 307–311.
- 32.
Guagliumi G, Sirbu V, Petroff C, Capodanno D, Musumeci G, Yamamoto H, et al. Volumetric assessment of lesion severity with optical coherence tomography: Relationship with fractional flow. EuroIntervention 2013; 8: 1172–1181.
- 33.
Ha J, Kim JS, Lim J, Kim G, Lee S, Lee JS, et al. Assessing computational fractional flow reserve from optical coherence tomography in patients with intermediate coronary stenosis in the left anterior descending artery. Circ Cardiovasc Interv 2016; 9: e003613.

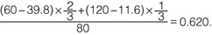 Therefore, IVUS-FFR was calculated as 0.620. The wire-based FFR was 0.56.