Abstract
Background:
The ability of cardiovascular biomarkers to predict the incidence of stroke subtypes remains ill-defined in the general population.
Methods and Results:
The blood levels of B-type natriuretic peptide (BNP) and high-sensitivity C-reactive protein (hs-CRP) and urinary albumin corrected by urinary creatinine (UACR) were determined in a general population (n=13,575). The ability to predict the incidence of ischemic stroke subtypes (lacunar, atherothrombotic, cardioembolic) for each biomarker was assessed based on the area under the receiver-operating characteristic curve (AUC-ROC) and using Cox proportional hazard modeling. The predictive abilities of UACR and hs-CRP for any subtype of ischemic event were found to be suboptimal. However, the ability of BNP to predict the incidence of cardioembolic stroke was excellent (AUC-ROC=0.81). When BNP was added to established stroke risk factors, the ability to predict cardioembolic stroke in terms of the AUC-ROC significantly improved (4-year follow-up, P=0.018; 8-year follow-up, P=0.009). Furthermore, when BNP was added to the JPHC score, the ability to predict cardioembolic stroke was significantly improved (net reclassification improvement=0.968, P<0.0001: integrated discrimination improvement=0.039, P<0.05).
Conclusions:
In the general population, plasma BNP was an excellent biomarker for predicting the incidence of cardioembolic stroke when used alone or in combination with established stroke risk factors.
Several types of scoring systems for risk stratification regarding the incidence of stroke in the general population have been reported.1–3
However, such scoring systems can be complex because various clinical factors have to be accounted for in order to ensure an accurate score calculation. Therefore, it is unlikely that these scoring systems enjoy widespread use in daily clinical and primary prevention settings.
Many studies have searched for simple markers to identify populations at high risk for stroke. Elevated levels of B-type natriuretic peptide (BNP), high-sensitivity C-reactive protein (hs-CRP), and urinary albumin corrected by urinary creatinine (UACR) have been suggested to be associated with an elevated risk of ischemic stroke in the general population.4–10
Cardioembolic stroke, in particular, is more common and disproportionately more disabling than non-embolic types of stroke.11
However, the differences in the predictive values of these cardiovascular (CV) biomarkers among ischemic stroke subtypes remain unclear.
Therefore, the present study examined the performance characteristics of these CV biomarkers for predicting the incidence of ischemic stroke subtype in the general population. In addition, the utility of these biomarkers in addition to established stroke risk factors (ESRFs) and risk scoring systems was investigated.
Methods
Study Subjects
Participants in the present study were part of the Iwate-KENCO study, and details of both recruitment and measurements in the cohort have been provided in our previous report.12
In brief, the original cohort (n=26,469) was recruited from the population living in Ninohe, Kuji, and Miyako districts of northern Iwate Prefecture, Japan, during 2002–2005. Of the original cohort living in the Ninohe and Kuji districts (n=15,927), 3 CV biomarkers (hs-CRP, UACR, BNP) were measured in 15,262 subjects (96%). Subjects were excluded from the present analysis for the following reasons: age <40 or >90 years old; a history of stroke; or missing data on serum creatinine levels, body mass index (BMI), ECG tracing, and blood pressure (BP). The final statistical analysis for the cohort was therefore performed in 13,575 subjects (men 4,595; women 8,980: mean age, 62.9 years). The study protocol was approved by the university ethics committee and by local institutional review committees. All participants gave written informed consent.
Biomarkers
The measurement of BNP, UACR, and hs-CRP was reported in our previous papers.8,12,13
In brief, for BNP and hs-CRP, blood samples were collected from the antecubital vein into vacuum tubes containing EDTA for BNP or a serum separate gel for hs-CRP. The tubes were stored immediately after sampling in an icebox and centrifuged within 8 h of collection at 1,500 g for 10 min. After separation, the serum hs-CRP was determined using a highly sensitive immunonephelometric method (N Latex CRP; Dade Behring, Tokyo, Japan). Both within- and between-assay quality control procedures were used, and the coefficient variation of the method was <5%. For BNP measurement, plasma samples were stored frozen at −20℃ until transportation to the Shionogi Central Laboratory for the assay. The plasma BNP levels were measured by a direct radioimmunoassay using monoclonal antibodies specific for human BNP (Shiono RIA BNP kit; Shionogi, Osaka, Japan). The intra- and interassay coefficient variations for BNP measurements were <5% and <6%, respectively. For UACR, a spot urine sample was collected, cooled, and transported to our laboratory. Urine albumin was assessed quantitatively by an immunonephelometric method (N-antiserum albumin; Dade Behring), and urine creatinine was measured quantitatively by an enzymatic colorimetric test. The intra- and interassay coefficient variation for both urine albumin and creatinine was <5%.
Other Measurements
All subjects used a self-reported questionnaire to confirm their medical history, including the status (yes/no) of treatment for hypertension (HT), diabetes mellitus (DM), and hyperlipidemia. Their smoking status (current, past smoker or non-smoker) was also assessed by questionnaire. BMI was calculated as the weight (kg) divided by the square of the height (m). The systolic and diastolic BP levels while sitting after at least 5 min resting were measured by experienced research staff members using an automatic digital device (BP 103i II, Nippon Colin, Komaki, Japan). The measurements were performed twice, with the mean value used for the statistical analysis. Casual blood samples were taken from upper arm veins with subjects in a seated position. Blood glucose was determined using an enzymatic method. Glycosylated hemoglobin (HbA1c) was measured quantitatively using the values established by the Japan Diabetes Society (JDS) with high-performance liquid chromatography (Tosoh, Tokyo, Japan). The value for HbA1c (%) used in this study was the National Glycohemoglobin Standardization Program equivalent value (%) calculated by the formula HbA1c=HbA1c (JDS)×1.02+0.25. The estimated glomerular filtration rate (eGFR) was calculated using the CKD-EPI equation for the Japanese population.14
The measurement methods for total cholesterol (enzymatic assay), high-density lipoprotein cholesterol (enzymatic assay), and low-density lipoprotein (homogeneous assay) were standardized by the Osaka Medical Center for Health Science and Promotion, a member of the Cholesterol Reference Method Laboratory Network.
Risk Factor Definitions
HT was defined as systolic BP ≥140 mmHg and/or diastolic BP ≥90 mmHg, and/or the use of antihypertensive medication. DM was ascertained by the detection of a non-fasting glucose concentration ≥200 mg/dL and/or HbA1c value ≥6.5% and/or the use of antidiabetic agents, including insulin. Alcohol drinkers were defined as those drinking alcohol ≥5 days per week. Regular exercisers were defined as those exercising ≥8 days per month for at least 60 min per session. The diagnosis of atrial fibrillation (AF) was established based on the ECG recorder machine-inherent algorithm and the ECG tracing was examined by laboratory technologists and confirmed by expert medical doctors. The Japan Public Health Center (JPHC) stroke score for subjects <70 years of age (n=9,663) was calculated according to the formula accounting for age, sex, current smoking, BMI, systolic BP, DM, and the use antihypertensive medication.15
Outcome
The endpoint of the present study was first stroke through December 2012 (mean follow-up period, 8.9 years). The incidence of stroke was identified by accessing the Iwate prefectural stroke registration program, which has been conducted by the Iwate Medical Association with the support of the government of Iwate Prefecture.16
The diagnostic criteria for stroke in this study were based on the criteria of the International Statistical Classification of Diseases and related health problems by the World Health Organization, with stroke being defined as the sudden onset of neurological symptoms.17,18
Patients with transient ischemic attack and traumatic hemorrhagic stroke were excluded from the registration.
Registration was initially performed by attending physicians at all general hospitals located in the present study area. In addition, to ascertain the complete identification of all cases, the research group (physicians or trained research nurses) visited the hospitals and checked the medical charts and/or discharge summaries. Furthermore, in order to identify cases of patients transferred out of the study area to other cities, we extended the survey to include several teaching hospitals within neighboring municipalities around the study area (Morioka and Hachinohe). All stroke cases were further subtyped by a study physician specializing in neurology (Y.I.) based on all available clinical information, including brain images, ECG, and echocardiography. The subtype categories were as follows: ischemic stroke (lacunar, atherothrombotic, cardioembolic, other), intracerebral hemorrhage (ICH), and subarachnoid hemorrhage (SAH).
Statistical Analysis
Continuous variables are shown as the mean±1 standard deviation. Categorical variables are expressed as percentages. Differences in the clinical characteristics of the ischemic subtypes were evaluated by 1-way analysis of variance (ANOVA), Kruskal-Wallis test, or chi-squared test as appropriate. The ability of each biomarker to predict the incidence of stroke was assessed by the area under the curve generated from the receiver-operating characteristic analysis (AUC-ROC). Subgroup analyses excluding participants with AF on ECG, those with antihypertensive/lipid-lowering medication at baseline, history of CV disease including heart disease (myocardial infarction, heart failure), reduced renal function (CKD-EPI eGFR <60 mL/min/1.73 m2), and DM were performed. In addition, analysis stratified by sex, age (65 years old), obesity (BMI ≥25 kg/m2), and HT are also presented. The cumulative survival curve (free from ischemic stroke subtypes) by quartile levels of plasma BNP was determined according to the multivariate Cox model (age, sex, BMI, DM, HT, AF, current smoking, and eGFR). In addition, the hazard ratios derived from the Cox regression models (age-sex model and multivariate model) for each biomarker quartile for ischemic stroke subtype were determined. To determine whether or not BNP improved the predictive abilities of the ESRFs (i.e., age, sex, BMI, DM, HT, AF, current smoking, and eGFR), the time-dependent AUC-ROC derived from the multivariable logistic regression model (original model) was compared with the AUC-ROC generated by adding BNP to the original model. In addition, to examine whether or not BNP testing was more useful than the JHPC risk score for predicting the incidence of cardioembolic stroke, 2 types of AUC-ROCs (JHPC stroke score vs. BNP) were compared. Furthermore, to determine the usefulness of plasma BNP as a predictor of cardioembolic events in addition to the JPHC score (for subjects <70 years old), we calculated the net reclassification improvement (NRI) and integrated discrimination improvement (IDI) indices. These statistical analyses were performed using the SPSS (ver. 22), MedCalc (ver.12.7.4.0), and R (ver. 3.4.0) software programs. A significant difference was defined as 2-tailed P<0.05.
Results
Events and Baseline Data
Over a mean follow-up period of 8.9 years, 653 first-ever strokes were recorded, 399 of which were ischemic (133 lacunar; 120 atherothrombotic, 108 cardioembolic, 38 unclassified), 57 SAH, 187 ICH, and 10 undetermined. As shown in
Table 1, although there were significant differences in the serum lipid levels and plasm BNP levels among the ischemic stroke subtypes, other baseline data, including age, sex, BMI, systolic BP, prevalence of DM, eGFR, UACR, hs-CRP, the JPHS stroke score, current smoking, exercise, and alcohol drinking, were not markedly different among the ischemic stroke subtypes. In the cardioembolic stroke group, the prevalence rate of AF was clearly higher than in the other groups (25% vs. <3%).
Table 1.
Comparison of the Clinical Characteristics and Biomarker Levels Among the Patients in the No-Event Group and the 3 Subtypes of Ischemic Stroke
| |
No event |
Ischemic stroke |
| Lacunar |
Atherothrombotic |
Cardioembolic |
P value* |
| n |
12,922 |
133 |
120 |
108 |
|
| Age, years |
62±10 |
71±7 |
69±9 |
71±8 |
0.055 |
| Women, % |
67 |
44 |
52 |
39 |
0.114 |
| BMI, kg/m2 |
24.1±3.2 |
24.1±3.4 |
24.6±3.8 |
24.0±3.1 |
0.456 |
| Systolic BP, mmHg |
127±20 |
134±19 |
138±20 |
132±20 |
0.084 |
| Diastolic BP, mmHg |
75±11 |
78±10 |
79±12 |
75±11 |
0.043 |
| Antihypertensive drugs, % |
23.6 |
40.6 |
41.7 |
43.5 |
0.900 |
| Total cholesterol, mg/dL |
202±33 |
195±30 |
206±36 |
194±32 |
0.012 |
| LDL-C, mg/dL |
120±29 |
119±27 |
124±31 |
115±32 |
0.045 |
| HDL-C, mg/dL |
60±15 |
55±13 |
58±14 |
58±15 |
0.169 |
| Lipid-lowering therapy (%) |
5.9 |
2.3 |
13.3 |
5.6 |
0.002 |
| DM, % |
6.5 |
9.8 |
11.7 |
10.2 |
0.879 |
| Current smoker, % |
12.4 |
22.6 |
25.0 |
16.7 |
0.295 |
| Former smoker, % |
10.9 |
19.5 |
11.7 |
24.1 |
0.048 |
| Regular exercise, % |
28.4 |
30.8 |
28.3 |
38.0 |
0.275 |
| Alcohol drinker, % |
27.8 |
32.3 |
35.8 |
38.0 |
0.900 |
| eGFR, mL/min/1.73 m2 |
77±10 |
71±9 |
73±11 |
70±11 |
0.232 |
| AF, % |
1.2 |
2.3 |
2.5 |
25.0 |
<0.001 |
| Median BNP, pg/mL (IQR) |
16.2 (8.0–29.9) |
24.1 (11.6–36.9) |
24.7 (12.4–51.4) |
60.6 (28.1–108.5) |
<0.001 |
| Median UACR, mg/cr (IQR) |
14.2 (8.2–27.9) |
20.3 (11.5–45.0) |
20.5 (12.4–65.0) |
23.6 (12.4–41.3) |
0.811 |
| Median CRP, mg/L (IQR) |
0.4 (0.2–0.8) |
0.7 (0.3–1.7) |
0.7 (0.3–1.7) |
0.5 (0.2–1.2) |
0.296 |
| JPHC stroke score (age <70 years) |
23±7 |
28±5 |
27±6 |
27±7 |
0.436 |
*Among ischemic stroke subtypes. AF, atrial fibrillation; BMI, body mass index; BNP, B-type natriuretic peptide; BP, blood pressure; CRP, high-sensitivity C-reactive protein; DM, diabetes mellitus; eGFR, estimated glomerular filtration rate; HDL-C, high-density lipoprotein cholesterol; IQR, interquartile range; JPHC, Japan Public Health Center; LDL-C, low-density lipoprotein cholesterol; UACR, urinary albumin corrected by urinary creatinine.
The predictive abilities of the 3 CV biomarkers for non-ischemic stroke (SAH and ICH) were initially determined. The AUC-ROC for all biomarkers was found to be suboptimal for predicting non-ischemic incidents; however, the predictive abilities were higher for ischemic stroke than for non-ischemic stroke (hs-CRP, 0.62 vs. 0.50; UACR, 0.62 vs. 0.60; BNP, 0.66 vs. 0.56). Therefore, the predictive abilities of the 3 biomarkers were further analyzed regarding the incidence of the ischemic stroke subtypes.
As shown in
Figure 1, the predictive abilities of the assessed biomarkers were suboptimal for lacunar stroke and atherothrombotic stroke, as the AUC-ROC was <0.75 (for all biomarkers). However, the predictive ability of plasma BNP for the incidence of cardioembolic stroke was found to be excellent (AUC-ROC=0.81; 95% confidence interval [CI], 0.76–0.85;
Figure 1). The sensitivity and specificity at the cutoff level of plasma BNP (29 pg/mL) was 75% and 74%, respectively. For hs-CRP and UACR, the AUC-ROCs were both suboptimal for predicting cardioembolic stroke (AUC-ROC <0.75).
In our multivariate Cox regression analysis model adjusted for ESRFs (i.e., age, sex, BMI, DM, HT, AF, current smoking, eGFR), the differences in the event-free rates among the BNP quartiles were most evident for cardioembolic stroke compared with the other ischemic stroke subtypes (Figure 2).
The hazard ratios derived from the Cox regression models (age-sex model and multivariate model) for each biomarker quartile for ischemic stroke and its subtypes (lacunar, atherothrombotic, cardioembolic, all ischemic) are shown in
Table 2. According to the trend analysis of the multivariate models, all the biomarkers’ levels were significantly associated with the incidence of ischemic stroke. However, with regard to the ischemic stroke subtypes, only the plasma BNP quartiles were significantly associated with the risk of cardioembolic stroke (Table 2).
Table 2.
HR Derived From Cox Regression Models (Age-Sex Model and Multivariate Model) for Each Biomarker Quartile for Ischemic Stroke and its Subtypes (All Ischemic, Lacunar, Atherothrombotic, Cardioembolic)
| |
CRP |
UACR |
BNP |
| HR |
95% CI |
P value |
HR |
95% CI |
P value |
HR |
95% CI |
P value |
| All ischemic |
| Age-sex adjusted model |
| Q1 |
1.00 (Ref.) |
|
|
1.00 (Ref.) |
|
|
1.00 (Ref.) |
|
|
| Q2 |
0.96 |
0.70–1.31 |
0.795 |
1.42 |
1.00–2.00 |
0.050 |
1.03 |
0.70–1.50 |
0.896 |
| Q3 |
1.09 |
0.80–1.48 |
0.600 |
1.82 |
1.31–2.53 |
0.001 |
1.54 |
1.09–2.75 |
0.015 |
| Q4 |
1.70 |
1.30–2.22 |
0.001 |
2.33 |
1.71–3.19 |
0.001 |
2.17 |
1.56–3.03 |
0.001 |
| P for trend |
|
|
0.001 |
|
|
0.001 |
|
|
0.001 |
| Multivariate model* |
| Q1 |
1.00 (Ref.) |
|
|
1.00 (Ref.) |
|
|
1.00 (Ref.) |
|
|
| Q2 |
0.88 |
0.64–1.21 |
0.434 |
1.32 |
0.93–1.86 |
0.122 |
1.03 |
0.70–1.51 |
0.872 |
| Q3 |
0.95 |
0.70–1.31 |
0.769 |
1.59 |
1.14–2.21 |
0.006 |
1.49 |
1.05–2.11 |
0.024 |
| Q4 |
1.38 |
1.04–1.84 |
0.025 |
1.78 |
1.29–2.46 |
0.001 |
1.85 |
1.32–2.60 |
0.001 |
| P for trend |
|
|
0.003 |
|
|
0.003 |
|
|
0.001 |
| Lacunar |
| Age-sex adjusted model |
| Q1 |
1.00 (Ref.) |
|
|
1.00 (Ref.) |
|
|
1.00 (Ref.) |
|
|
| Q2 |
0.71 |
0.39–1.27 |
0.246 |
1.78 |
0.96–3.30 |
0.066 |
0.75 |
0.42–1.34 |
0.334 |
| Q3 |
1.07 |
0.63–1.80 |
0.809 |
2.49 |
1.39–4.44 |
0.002 |
1.21 |
0.73–2.01 |
0.465 |
| Q4 |
1.74 |
1.11–2.75 |
0.016 |
2.33 |
1.31–4.15 |
0.004 |
0.87 |
0.51–1.48 |
0.604 |
| P for trend |
|
|
0.002 |
|
|
0.013 |
|
|
0.250 |
| Multivariate model* |
| Q1 |
1.00 (Ref.) |
|
|
1.00 (Ref.) |
|
|
1.00 (Ref.) |
|
|
| Q2 |
0.68 |
0.38–1.22 |
0.195 |
1.70 |
0.92–3.15 |
0.092 |
0.75 |
0.42–1.34 |
0.333 |
| Q3 |
0.99 |
0.58–1.70 |
0.982 |
2.24 |
1.25–4.02 |
0.007 |
1.18 |
0.71–1.97 |
0.520 |
| Q4 |
1.56 |
0.97–2.52 |
0.065 |
1.93 |
1.07–3.48 |
0.030 |
0.82 |
0.48–1.41 |
0.478 |
| P for trend |
|
|
0.100 |
|
|
0.059 |
|
|
0.239 |
| Atherothrombotic |
| Age-sex adjusted model |
| Q1 |
1.00 (Ref.) |
|
|
1.00 (Ref.) |
|
|
1.00 (Ref.) |
|
|
| Q2 |
1.49 |
0.82–2.69 |
0.189 |
2.11 |
1.12–3.99 |
0.022 |
1.75 |
0.89–3.43 |
0.104 |
| Q3 |
1.47 |
0.81–2.68 |
0.204 |
1.94 |
1.02–3.68 |
0.043 |
2.00 |
1.04–3.85 |
0.038 |
| Q4 |
2.42 |
1.42–4.11 |
0.001 |
2.72 |
1.48–4.99 |
0.001 |
2.49 |
1.31–4.74 |
0.005 |
| P for trend |
|
|
0.060 |
|
|
0.014 |
|
|
0.046 |
| Multivariate model* |
| Q1 |
1.00 (Ref.) |
|
|
1.00 (Ref.) |
|
|
1.00 (Ref.) |
|
|
| Q2 |
1.33 |
0.73–2.42 |
0.347 |
1.92 |
1.01–3.63 |
0.046 |
1.77 |
0.90–3.48 |
0.097 |
| Q3 |
1.22 |
0.66–2.25 |
0.525 |
1.58 |
0.83–3.02 |
0.166 |
1.98 |
1.03–3.82 |
0.041 |
| Q4 |
1.87 |
0.66–2.25 |
0.026 |
1.91 |
1.02–3.55 |
0.042 |
2.35 |
1.23–4.49 |
0.010 |
| P for trend |
|
|
0.097 |
|
|
0.178 |
|
|
0.080 |
| Cardioembolic |
| Age-sex adjusted model |
| Q1 |
1.00 (Ref.) |
|
|
1.00 (Ref.) |
|
|
1.00 (Ref.) |
|
|
| Q2 |
0.80 |
0.45–1.41 |
0.433 |
0.59 |
0.29–1.21 |
0.150 |
0.40 |
0.12–1.29 |
0.125 |
| Q3 |
0.77 |
0.43–1.37 |
0.374 |
1.26 |
0.71–2.23 |
0.433 |
1.43 |
0.63–3.26 |
0.388 |
| Q4 |
1.20 |
0.73–1.96 |
0.469 |
1.82 |
1.08–3.07 |
0.025 |
5.23 |
2.53–10.79 |
0.001 |
| P for trend |
|
|
0.294 |
|
|
0.003 |
|
|
0.001 |
| Multivariate model* |
| Q1 |
1.00 (Ref.) |
|
|
1.00 (Ref.) |
|
|
1.00 (Ref.) |
|
|
| Q2 |
0.68 |
0.38–1.22 |
0.194 |
0.52 |
0.26–1.07 |
0.075 |
0.40 |
0.12–1.30 |
0.128 |
| Q3 |
0.64 |
0.35–1.17 |
0.151 |
1.05 |
0.59–1.87 |
0.874 |
1.35 |
0.60–3.07 |
0.470 |
| Q4 |
0.87 |
0.51–1.48 |
0.605 |
1.30 |
0.75–2.26 |
0.354 |
3.63 |
1.74–7.57 |
0.001 |
| P for trend |
|
|
0.391 |
|
|
0.057 |
|
|
0.001 |
*Age, sex, BMI, DM, HT, AF, current smoking, eGFR. HR, hazard ratios; HT, hypertension; Q, quartile. Other abbreviations as in Table 1.
The differences in the baseline clinical data among the BNP quartiles are shown in
Table 3. The effectiveness of BNP testing for various subgroups is shown in
Table 4. The sensitivity and specificity remained significantly high in the stratified analyses (sex, age, BMI, and HT), even after excluding subjects with a history of CV events, AF, low eGFR (<60 mL/min/1.73 m2), and DM (all AUC-ROC ≥0.75).
Table 3.
Comparison of the Baseline Clinical Characteristics of the Patients in the BNP Quartiles
| |
BNP_Q1 |
BNP_Q2 |
BNP_Q3 |
BNP_Q4 |
|
| n |
3,392 |
3,392 |
3,390 |
3,401 |
|
| Age, years |
57.7±9.7 |
60.8±9.8 |
64.0±9.3 |
68.4±8.5 |
<0.001 |
| Women, % |
59 |
69 |
70 |
66 |
<0.001 |
| BMI, kg/m2 |
24.2±3.2 |
24.1±3.2 |
23.9±3.2 |
23.9±3.4 |
<0.001 |
| Systolic BP, mmHg |
124±18 |
125±19 |
127±19 |
131±21 |
<0.001 |
| Diastolic BP, mmHg |
75±11 |
75±11 |
75±11 |
75±11 |
0.748 |
| Antihypertensive drugs, % |
15.4 |
21.0 |
25.5 |
35.1 |
<0.001 |
| Total cholesterol, mg/dL |
208±34 |
203±32 |
201±31 |
196±32 |
<0.001 |
| LDL-C, mg/dL |
125±31 |
121±29 |
119±27 |
115±28 |
<0.001 |
| HDL-C, mg/dL |
59±15 |
60±15 |
60±15 |
60±15 |
0.232 |
| Lipid-lowering therapy (%) |
5.5 |
6.2 |
6.6 |
5.1 |
0.040 |
| DM, % |
7.4 |
6.0 |
6.1 |
7.1 |
0.041 |
| Current smoker, % |
18.6 |
12.1 |
10.6 |
9.6 |
<0.001 |
| Former smoker, % |
12.4 |
10.0 |
10.3 |
12.1 |
<0.01 |
| Regular exercise, % |
24.1 |
26.3 |
31.5 |
32.4 |
<0.001 |
| Alcohol drinker, % |
33.0 |
27.6 |
25.5 |
26.3 |
<0.001 |
| eGFR, mL/min/1.73 m2 |
81±9 |
79±9 |
76±9 |
73±10 |
<0.001 |
| AF, % |
0.3 |
0.1 |
0.4 |
5.2 |
<0.001 |
| Median BNP, pg/mL (IQR) |
4.1 (1.6–6.1) |
11.9 (10.1–14.0) |
22.2 (19.0–25.9) |
46.6 (37.1–66.9) |
<0.001 |
| Median UACR, mg/cr (IQR) |
12.6 (7.6–23.0) |
13.3 (7.9–26.1) |
14.3 (8.4–27.4) |
17.8 (9.8–37.4) |
<0.001 |
| Median CRP, mg/L (IQR) |
0.4 (0.2–0.8) |
0.4 (0.2–0.8) |
0.4 (0.2–0.8) |
0.4 (0.2–1.0) |
<0.01 |
| JPHS score (age <70 years) |
21±7 |
23±7 |
24±7 |
26±7 |
<0.001 |
Abbreviations as in Tables 1,2.
Table 4.
Ability of BNP Level to Predict the Incidence of Cardioembolic Stroke at the Optimum Cutoff Level in Various Subgroups
| |
AUC-ROC
(95% CI) |
Cutoff
(pg/mL) |
Sensitivity
(95% CI) |
Specificity
(95% CI) |
Positive
likelihood
ratio
(95% CI) |
Negative
likelihood
ratio
(95% CI) |
Positive
predictive
value
(95% CI) |
Negative
predictive
value
(95% CI) |
| Men (n=4,595) |
0.80
(0.75–0.86) |
29.2 |
72.7
(60.4–83.0) |
74.7
(73.4–75.9) |
2.9
(2.5–3.4) |
0.4
(0.2–0.5) |
4.0
(3.0–5.3) |
99.5
(99.2–99.7) |
| Women (n=8,980) |
0.82
(0.74–0.89) |
24.7 |
88.1
(74.4–96.0) |
66.3
(65.3–67.3) |
2.6
(2.3–2.9) |
0.2
(0.1–0.4) |
1.2
(0.9–1.7) |
99.9
(99.8–100.0) |
Age <65 years
(n=6,952) |
0.84
(0.72–0.96) |
19.4 |
85.7
(57.2–98.2) |
72.1
(71.1–73.2) |
3.1
(2.5–3.8) |
0.2
(0.05–0.7) |
0.6
(0.3–1.1) |
100.0
(99.9–100.0) |
Age ≥65 years
(n=6,623) |
0.75
(0.69–0.81) |
58.4 |
55.3
(44.7–65.6) |
86.4
(85.6–87.3) |
4.1
(3.4–4.9) |
0.5
(0.4–0.6) |
5.5
(4.2–7.2) |
99.3
(99.0–99.5) |
| BMI <25 (n=8,593) |
0.84
(0.79–0.88) |
22.7 |
89.2
(79.1–95.6) |
63.1
(62.1–64.0) |
2.4
(2.2–2.6) |
0.17
( 0.08–0.3) |
1.8
(1.4–2.3) |
99.9
(99.7–99.9) |
| BMI ≥25 (n=4,982) |
0.75
(0.66–0.85) |
34.2 |
72.1
(56.3–84.7) |
79.3
(78.1–80.4) |
3.5
(2.9–4.2) |
0.35
(0.2–0.6) |
2.9
(2.0–4.1) |
99.7
(99.5–99.8) |
| No HT (n=8,039) |
0.83
(0.76–0.89) |
19.4 |
88.9
(75.9–96.3) |
64.1
(63.1–65.2) |
2.5
(2.2–2.8) |
0.17
(0.08–0.4) |
1.4
(1.0–1.9) |
99.9
(99.8–100) |
| HT (n=5,536) |
0.77
(0.71–0.84) |
36.4 |
73.0
(60.3–83.4) |
73.9
(72.7–75.1) |
2.8
(2.4–3.3) |
0.37
(0.2–0.5) |
3.1
(2.3–4.1) |
99.6
(99.3–99.8) |
Exclude AF
(n=13,376) |
0.77
(0.71–0.82) |
29.1 |
67.9
(56.6–77.8) |
74.7
(73.9–75.4) |
2.7
(2.3–3.1) |
0.40
(0.3–0.6) |
1.6
(1.2–2.1) |
99.7
(99.6–99.8) |
Exclude
anti-HT/anti-HL
drugs (n=9,770) |
0.81
(0.74–0.87) |
19.4 |
87.7
(76.3–94.9) |
61.7
(60.7–62.7) |
2.3
(2.1–2.5) |
0.20
(0.1–0.4) |
1.3
(1.0–1.7) |
99.9
(99.8–100.0) |
Exclude CVE
history (n=13,475) |
0.80
(0.75–0.85) |
29.1 |
74.3
(64.8–82.3) |
74.1
(73.3–74.8) |
2.9
(2.6–3.2) |
0.35
(0.3–0.5) |
2.2
(1.7–2.7) |
99.7
(99.6–99.8) |
Exclude eGFR
<60 (n=12,779) |
0.80
(0.75–0.86) |
30.9 |
71.7
(61.4–80.6) |
77.3
(76.6–78.0) |
3.2
(2.8–3.6) |
0.37
(0.3–0.5) |
2.2
(1.7–2.8) |
99.7
(99.6–99.8) |
Exclude DM
(n=12,670) |
0.83
(0.79–0.88) |
29.1 |
78.3
(68.8–86.1) |
74.0
(73.2–74.8) |
3.0
(2.7–3.4) |
0.29
(0.2–0.4) |
2.3
(1.8–2.8) |
99.8
(99.7–99.9) |
CVE, cardiovascular events; HL, hyperlipidemia. Other abbreviations as in Tables 1,2.
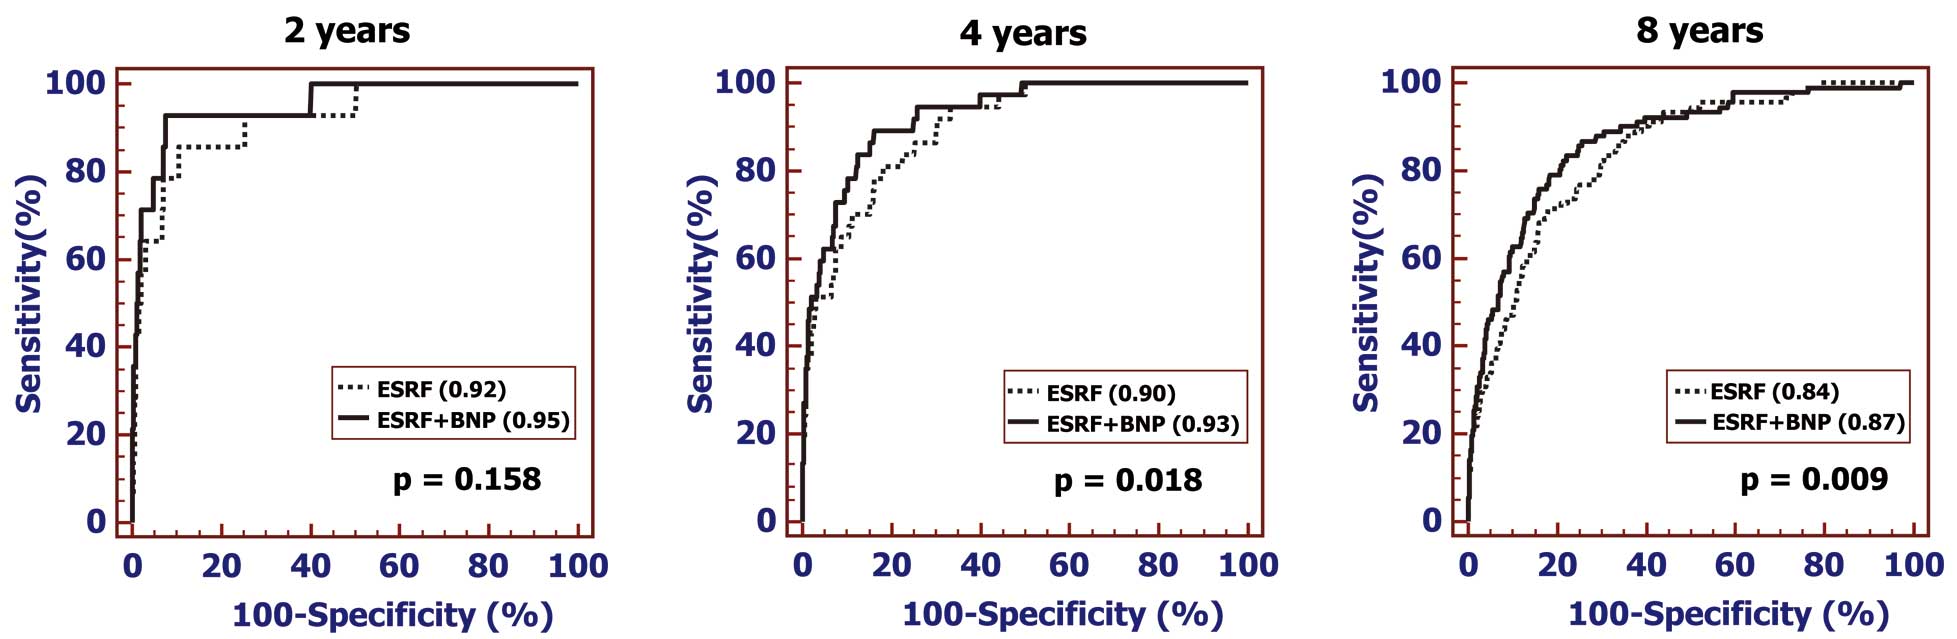
The ability of BNP testing to predict the risk of cardioembolic stroke was compared with that of the ESRFs (i.e., age, sex, BMI, DM, HT, AF, current smoking, eGFR) at a specific follow-up point. As shown in
Figure 3, the addition of plasma BNP to the ESRFs model significantly improved the ability of the original ESRFs model to predict future cardioembolic stroke (AUC-ROC) at 4-year (from 0.90 [95% CI: 0.89–0.90] to 0.93 [95% CI: 0.92–0.93]: P=0.018) and 8-year follow-up (from 0.84 [95% CI: 0.83–0.84] to 0.87 [95% CI: 0.86–0.87]: P=0.009).
A comparison of the ability to predict the incidence of cardioembolic stroke in terms of the time-dependent AUC-ROCs between the JPHC risk score and BNP values revealed significant differences between the 2 AUC-ROCs. Although the JPHC score could not be calculated for subjects >70 years of age, the AUC-ROCs derived from BNP testing were significantly larger than those created by the JPHS stroke score (2-year follow-up, 0.94 vs. 0.72; P<0.001: 4-year follow-up, 0.88 vs. 0.72; P=0.011: 8-year follow-up, 0.82 vs. 0.65; P=0.002).
The risk stratification capacity regarding the incidence of cardioembolic stroke (e.g., low risk: <5%, intermediate risk: 5–10%, high risk: >10%) in the JPHC score-only model vs. the JPHC score plus BNP model derived from the reclassification table indicated that when BNP was added to the JPHC model, the ability to predict the incidence of cardioembolic stroke significantly improved (NRI=0.968, 95% CI, 0.696–1.240; P<0.0001; IDI=0.039, 95% CI, 0.001–0.078; P=0.0426:
Table 5).
Table 5.
Reclassification and Discrimination Improvement for Incident Cardioembolic Stroke by Adding Plasma BNP Level to the JPHC Score
| Base model* |
Base model with BNP |
% reclassified |
| <5% |
5–10% |
>10% |
Total |
| No event |
| <5% |
8,270 |
237 |
36 |
8,543 |
3 |
| 5–10% |
250 |
736 |
36 |
1,022 |
28 |
| >10% |
0 |
26 |
33 |
59 |
44 |
| Total |
8,520 |
999 |
105 |
9,624 |
|
| Event |
| <5% |
19 |
8 |
2 |
29 |
34 |
| 5–10% |
0 |
3 |
1 |
4 |
25 |
| >10% |
0 |
2 |
1 |
3 |
67 |
| Total |
19 |
13 |
4 |
36 |
|
| Combined |
| <5% |
8,289 |
245 |
38 |
8,572 |
3 |
| 5–10% |
250 |
739 |
40 |
1,029 |
28 |
| >10% |
0 |
28 |
34 |
62 |
45 |
| Total |
8,539 |
1,012 |
112 |
9,663 |
|
*Base model: JPHC score. Abbreviations as in Table 1.
Discussion
This study showed that although the predictive ability of both UACR and hs-CRP for any ischemic stroke subtype was suboptimal, the plasma BNP level was found to be an excellent biomarker for predicting the future incidence of cardioembolic stroke when used alone or in combination with ESRFs and the JPHC score in an apparently healthy population.
Several studies have reported that the levels of BNP, UACR, and hs-CRP were associated with the risk of stroke in a general population.4–10
However, whether or not these CV biomarkers alone or in addition to other established biomarkers are useful for predicting the future onset of stroke or its subtypes has been unclear. In the Framingham study cohort, Wang et al reported that, compared with the lowest tertile of plasma BNP, the highest tertile had a higher risk for incident total stroke, including transient ischemic attack.4
Kistorp et al demonstrated that the incident risk of ischemic stroke for subjects in the 80th percentile of serum N-amino terminal fragment of the prohormone BNP (NT-proBNP) was higher than that in subjects with lower NT-proBNP levels in a relatively small community-dwelling population (<700).5
In those previous studies, the utility of BNP testing was suggested by the hazard ratio derived from multi-adjusted Cox models. However, whether or not the blood levels of BNP alone are practically useful for predicting which subtype of ischemic stroke will occur is still unclear. Indeed, the clinical severity and outcome differs among the subtypes of ischemic stroke.11
Furthermore, the predictive performance in terms of the AUC-ROC for plasma BNP testing for stroke subtype or the joint effects of BNP for ESRFs or the JPHC score are unclear in the general population. The present study showed for the first time that plasma BNP alone was suitable for predicting the future onset of cardioembolic stroke in a general population. The usefulness of BNP testing was superior to that of ESRFs or the JPHC score for cardioembolic stroke prediction and further improved their ability to predict cardioembolic risk when evaluated in combination.
As the cardiac synthesis and secretion of BNP is stimulated by increased left ventricular (LV) filling pressure and left atrial pressure, subjects with elevated BNP levels may have inherent clinical and preclinical cardiac disorders characterized by abnormalities in intracardiac pressure, LV function, and valvular competence.19,20
Indeed, several previous studies using Doppler echocardiography have reported that a reduced left atrial appendage blood flow with an enlarged atrial diameter inversely correlated with the prothrombotic state (high plasma concentrations of D-dimer and thrombin-antithrombin III complex) and plasma BNP level.21,22
Thus, an elevated plasma BNP level might represent increased intracardiac pressure and hypercoagulation state because of reduced atrial hemostasis, irrespective of the absence of AF, as the present study showed reliable predictive ability for cardioembolic stroke even after excluding subjects showing AF at the baseline examination. The present study therefore clarified the robust association between the BNP level and the incidence of cardioembolic stroke in the general population.
This study also showed that the predictive value of plasma BNP was poor for the other types of ischemic stroke, such as the lacunar and atherothrombotic subtypes. Lacunar stroke is characterized by small brain infarcts in the distal distribution of deep penetrating vessels. Atherothrombotic stroke is caused mainly by embolic events originating from the carotid artery bifurcation or the aortic arch, which are caused primarily by degenerative changes in the arteries, characterized by thickening of the vessel walls and the accumulation of cholesterol with consequent loss of elasticity and reduced blood flow. As BNP is a peptide hormone secreted by cardiomyocytes mainly in response to increased cardiac wall stress, BNP secretion might not be directly reflected by these vascular pathological processes.
Study Strengths and Limitations
To our knowledge, this study included the largest general population sample in which BNP and UACR testing were performed. All CV biomarkers were measured in fresh samples without long-term freezing and repeated thawing. Stroke events were captured prospectively according to previously determined standard epidemiological criteria and confirmed by research staff members, including a neurology specialist. The baseline data, including clinical characteristics and biochemical data, were determined well before the start of the follow-up study.
However, despite these merits, some limitations should be considered when interpreting the results. First, as ECG recoding in the present study was performed on a single occasion during the baseline examination, some subjects with paroxysmal AF might have been overlooked. However, the patients with this transient arrhythmia have elevated plasma BNP levels,23
which are reported to be significantly associated with a high rate of new-onset AF.24
Therefore, elevated plasma BNP levels in the general population might suggest various structural cardiac disorders, including paroxysmal AF with a high risk of intracardiac thrombus formation. As such, the observed predictive performance of BNP testing might not be hampered by this limitation. Second, when the baseline survey was performed in the early 2000s, the usefulness of anticoagulant therapy for lone AF had yet to be established. As such, the prescription rate of anticoagulants for this arrhythmia in that era might have been lower than at present. The incidence of cardioembolic stroke in our cohort might therefore be different from that in the current medical setting. However, this study showed that the utility of BNP testing to predict the onset of cardioembolic stroke was excellent, even after excluding subjects with AF, as the remaining subjects most likely rarely received anticoagulants. Third, the present study did not completely exclude the possible effects of CV drugs, such as renin-angiotensin inhibitors, on the plasma levels of BNP and UACR,25,26
or on the incidence of stroke. In addition, antihypercholesteremic agents, such as statins, reduce both the incidence of stroke27
and the serum level of hs-CRP in high-risk patients.28
These possible therapeutic effects on biomarker levels and stroke incidence could not be taken into account in the present study. However, the usefulness of BNP testing for predicting the onset of cardioembolic stroke remained significant, even after excluding subjects who were taking antihypertensive drugs and/or antihyperlipidemic drugs at the baseline examination (AUC-ROC=0.81;
Table 4). Finally, this study was performed in a Japanese population. As the proportion of a lacunar subtype among ischemic strokes is reportedly higher in this population than in Western populations,29,30
the proportion of cardioembolic stroke might consequently be lower in the present cohort than in other populations. These epidemiological features might lead to an underestimation of the true predictive abilities of BNP testing.
In conclusion, although the predictive abilities of UACR and hs-CRP for any ischemic stroke subtype were suboptimal, the plasma BNP level was found to be an excellent biomarker for predicting the incidence of cardioembolic stroke when used alone or in combination with ESRFs or the JPHC score in a general population. As this type of stroke is common and disproportionately more disabling than non-embolic-type stroke, the present findings may be an important cue for both screening and primary prevention.
Acknowledgments
This study was supported in part by grants-in-aid from the scientific research funds of the Ministry of Education, Science, and Culture of Japan (Nos. 26461082 and 17K09520), Tokyo, Japan.
References
- 1.
D’Agostino RB, Wolf PA, Belanger AJ, Kannel WB. Stroke risk profile: Adjustment for antihypertensive medication: The Framingham Study. Stroke 1994; 25: 40–43.
- 2.
Borglykke A, Andreasen AH, Kuulasmaa K, Sans S, Ducimetière P, Vanuzzo D, et al. Stroke risk estimation across nine European countries in the MORGAM project. Heart 2010; 96: 1997–2004.
- 3.
Yatsuya H, Iso H, Li Y, Yamagishi K, Kokubo Y, Saito I, et al. Development of a risk equation for the incidence of coronary artery disease and ischemic stroke for middle-aged Japanese: Japan Public Health Center-Based Prospective Study. Circ J 2016; 80: 1386–1395.
- 4.
Wang TJ, Larson MG, Levy D, Benjamin EJ, Leip EP, Omland T, et al. Plasma natriuretic peptide levels and the risk of cardiovascular events and death. N Engl J Med 2004; 350: 655–663.
- 5.
Kistorp C, Raymond I, Pedersen F, Gustafsson F, Faber J, Hildebrandt P. N-terminal pro-brain natriuretic peptide, C-reactive protein, and urinary albumin levels as predictors of mortality and cardiovascular events in older adults. JAMA 2005; 293: 1609–1616.
- 6.
Takahashi T, Nakamura M, Onoda T, Ohsawa M, Tanno K, Itai K, et al. Predictive value of plasma B-type natriuretic peptide for ischemic stroke: A community-based longitudinal study. Atherosclerosis 2009; 207: 298–303.
- 7.
Ridker PM, Cushman M, Stampfer MJ, Tracy RP, Hennekens CH. Inflammation, aspirin, and the risk of cardiovascular disease in apparently healthy men. N Engl J Med 1997; 336: 973–979.
- 8.
Makita S, Nakamura M, Satoh K, Tanaka F, Onoda T, Kawamura K, et al. Serum C-reactive protein levels can be used to predict future ischemic stroke and mortality in Japanese men from the general population. Atherosclerosis 2009; 204: 234–238.
- 9.
Wakugawa Y, Kiyohara Y, Tanizaki Y, Kubo M, Ninomiya T, Hata J, et al. C-reactive protein and risk of first-ever ischemic and hemorrhagic stroke in a general Japanese population: The Hisayama Study. Stroke 2006; 37: 27–32.
- 10.
Cao JJ, Barzilay JI, Peterson D, Manolio TA, Psaty BM, Kuller L, et al. The association of microalbuminuria with clinical cardiovascular disease and subclinical atherosclerosis in the elderly: The Cardiovascular Health Study. Atherosclerosis 2006; 187: 372–377.
- 11.
de Jong G, van Raak L, Kessels F, Lodder J. Stroke subtype and mortality: A follow-up study in 998 patients with a first cerebral infarct. J Clin Epidemiol 2003; 56: 262–268.
- 12.
Ohsawa M, Itai K, Onoda T, Tanno K, Sasaki S, Nakamura M, et al. Dietary intake of n-3 polyunsaturated fatty acids is inversely associated with CRP levels, especially among male smokers. Atherosclerosis 2008; 201: 184–191.
- 13.
Nakamura M, Tanaka F, Onoda T, Takahashi T, Sakuma M, Kawamura K, et al. Gender-specific risk stratification with plasma B-type natriuretic peptide for future onset of congestive heart failure and mortality in the Japanese general population. Int J Cardiol 2010; 143: 124–129.
- 14.
Horio M, Imai E, Yasuda Y, Watanabe T, Matsuo S. Modification of the CKD epidemiology collaboration (CKD-EPI) equation for Japanese: Accuracy and use for population estimates. Am J Kidney Dis 2010; 56: 32–38.
- 15.
Yatsuya H, Iso H, Yamagishi K, Kokubo Y, Saito I, Suzuki K, et al. Development of a point-based prediction model for the incidence of total stroke: Japan public health center study. Stroke 2013; 44: 1295–1302.
- 16.
Omama S, Ogasawara K, Ishibashi Y, Nakamura M, Tanno K, Sakata K. The impact and effectivity of an inventory survey for a stroke registry in Iwate prefecture. J Stroke Cerebrovasc Dis 2017; 26: 2160–2166.
- 17.
World Health Organization, MONICA Project. Section 2: Stroke event registration data component. MONICA manual, Part IV, Event registration. November 1990. www.thl.fi/publications/monica/manual/part4/iv-2.htm (accessed November 27, 2017).
- 18. World Health Organization. International statistical classification of diseases and related health problems, 10th rev. Geneva: WHO. www.who.int/classifications/icd/ICD10Volume2_en_2010.pdf (accessed November 27, 2017).
- 19.
Struthers AD. Introducing a new role for BNP: As a general indicator of cardiac structural disease rather than a specific indicator of systolic dysfunction only. Heart 2002; 87: 97–98.
- 20.
Burke MA, Cotts WG. Interpretation of B-type natriuretic peptide in cardiac disease and other comorbid conditions. Heart Fail Rev 2007; 12: 23–36.
- 21.
Igarashi Y, Kashimura K, Makiyama Y, Sato T, Ojima K, Aizawa Y. Left atrial appendage dysfunction in chronic nonvalvular atrial fibrillation is significantly associated with an elevated level of brain natriuretic peptide and a prothrombotic state. Jpn Circ J 2001; 65: 788–792.
- 22.
Shimizu H, Murakami Y, Inoue S, Ohta Y, Nakamura K, Katoh H, et al. High plasma brain natriuretic polypeptide level as a marker of risk for thromboembolism in patients with nonvalvular atrial fibrillation. Stroke 2002; 33: 1005–1010.
- 23.
Sadanaga T, Mitamura H, Kohsaka S, Ogawa S. Steady-state B-type natriuretic peptide levels in patients with atrial fibrillation of various clinical backgrounds. Heart Vessels 2012; 27: 280–286.
- 24.
Patton KK, Heckbert SR, Alonso A, Bahrami H, Lima JA, Burke G, et al. N-terminal pro-B-type natriuretic peptide as a predictor of incident atrial fibrillation in the Multi-Ethnic Study of Atherosclerosis: The effects of age, sex and ethnicity. Heart 2013; 99: 1832–1836.
- 25.
Kohno M, Horio T, Yokokawa K, Murakawa K, Yasunari K, Kurihara N, et al. Atrial and brain natriuretic peptides: Secretion during exercise in patients with essential hypertension and modulation by acute angiotensin-converting enzyme inhibition. Clin Exp Pharmacol Physiol 1992; 19: 193–200.
- 26.
Keane WF, Shapiro BE. Renal protective effects of angiotensin-converting enzyme inhibition. Am J Cardiol 1990; 65: 49I–53I.
- 27.
Heart Protection Study Collaborative Group. MRC/BHF Heart Protection Study of cholesterol lowering with simvastatin in 20 536 high-risk individuals: A randomised placebo-controlled trial. Lancet 2002; 360: 7–22.
- 28.
Ridker PM, Rifai N, Pfeffer MA, Sacks F, Braunwald E. Long-term effects of pravastatin on plasma concentration of C-reactive protein: The Cholesterol and Recurrent Events (CARE) Investigators. Circulation 1999; 100: 230–235.
- 29.
Kubo M, Hata J, Doi Y, Tanizaki Y, Iida M, Kiyohara Y. Secular trends in the incidence of and risk factors for ischemic stroke and its subtypes in Japanese population. Circulation 2008; 118: 2672–2678.
- 30.
Turin TC, Kita Y, Rumana N, Nakamura Y, Takashima N, Ichikawa M, et al. Ischemic stroke subtypes in a Japanese population: Takashima Stroke Registry, 1988–2004. Stroke 2010; 41: 1871–1876.


