Abstract
Background:
The incidence of pulmonary vein stenosis (PVS) after AF ablation following contemporary procedures remains unclear. We compared the incidence of PVS/narrowing (PVS/N) after PV isolation (PVI) for (1) 3-D mapping-guided wide-area encircling irrigated radiofrequency current (RFC) ablation; (2) first–third-generation big cryoballoon (CB1–3) ablation; and (3) laser balloon (LB) ablation.
Methods and Results:
All patients undergoing a second procedure between January 2012 and November 2016 were subgrouped according to index ablation (PVI): RFC; CB; or LB. PVS/N was classified using PV diameter ratio (second/index procedure) on selective PV angiogram performed before ablation: mild, 25–49%; moderate, 50–74%; or severe, ≥75%. A total of 344 patients (1,362 PV) were analyzed (RFC, n=211; 840 PV; CB1, n=21; 82 PV; CB2,3, n=64; 250 PV; LB, n=48; 190 PV). In the LB group, 45 patients (94%) were treated with dose ≥8.5 W. Second procedures were performed on average 14.9±14.1 months after the index procedure. Mild PVS/N was observed in 18.4%, 9.5% and 3.6% of PV in the LB, RFC and CB groups, respectively (P<0.01). Moderate PVS was recognized in 2 PV (0.1%; RFC, LB). Severe PVS was never observed, and no PV intervention/surgery was required.
Conclusions:
The risk for significant PVS is low after RFC/CB. The incidence of mild PVS/N was highest after standard-dose LB ablation and lowest after high-dose CB ablation.
Atrial fibrillation (AF) is linked to reduced quality of life, increased risk of stroke, heart failure and mortality.1
Catheter ablation in rhythm control of AF has been well established and pulmonary vein (PV) isolation (PVI) represents the procedural endpoint.2
Initially, distal, focal segmental radiofrequency current (RFC) PVI was linked to high rates of PV stenosis (PVS; <10%) with severe clinical sequelae.3
Recently, irrigated RFC ablation strategies were modified (antral ablation, contact force) and balloon ablation optimized (big cryoballoon, CB; laser balloon, LB) to facilitate PVI.4–8
Especially in balloon ablation, the effectiveness of high-energy cryoablation (second-/third-generation CB, CB2,3) and current standard-dose protocol (8.5–12 W) LB ablation has been proved.6,7,9
The risk of PVS/narrowing (PVS/N) after increased contemporary PVI, however, is currently ill defined. Also, simultaneous comparative studies on the risk of PVS/N after RFC, CB, and LB ablations, performed by the same operators, at the same time, and in the same institution, have not yet been reported, although the risk of PVS/N after PVI might change depending on these factors.
The aim of this study was therefore to investigate and compare the incidence of PVS/N following (1) 3-D mapping-guided wide-area encircling irrigated RFC ablation (WACA RFC); (2) first–third-generation CB (CB1–3); and (3) LB ablation.
Methods
Study Design
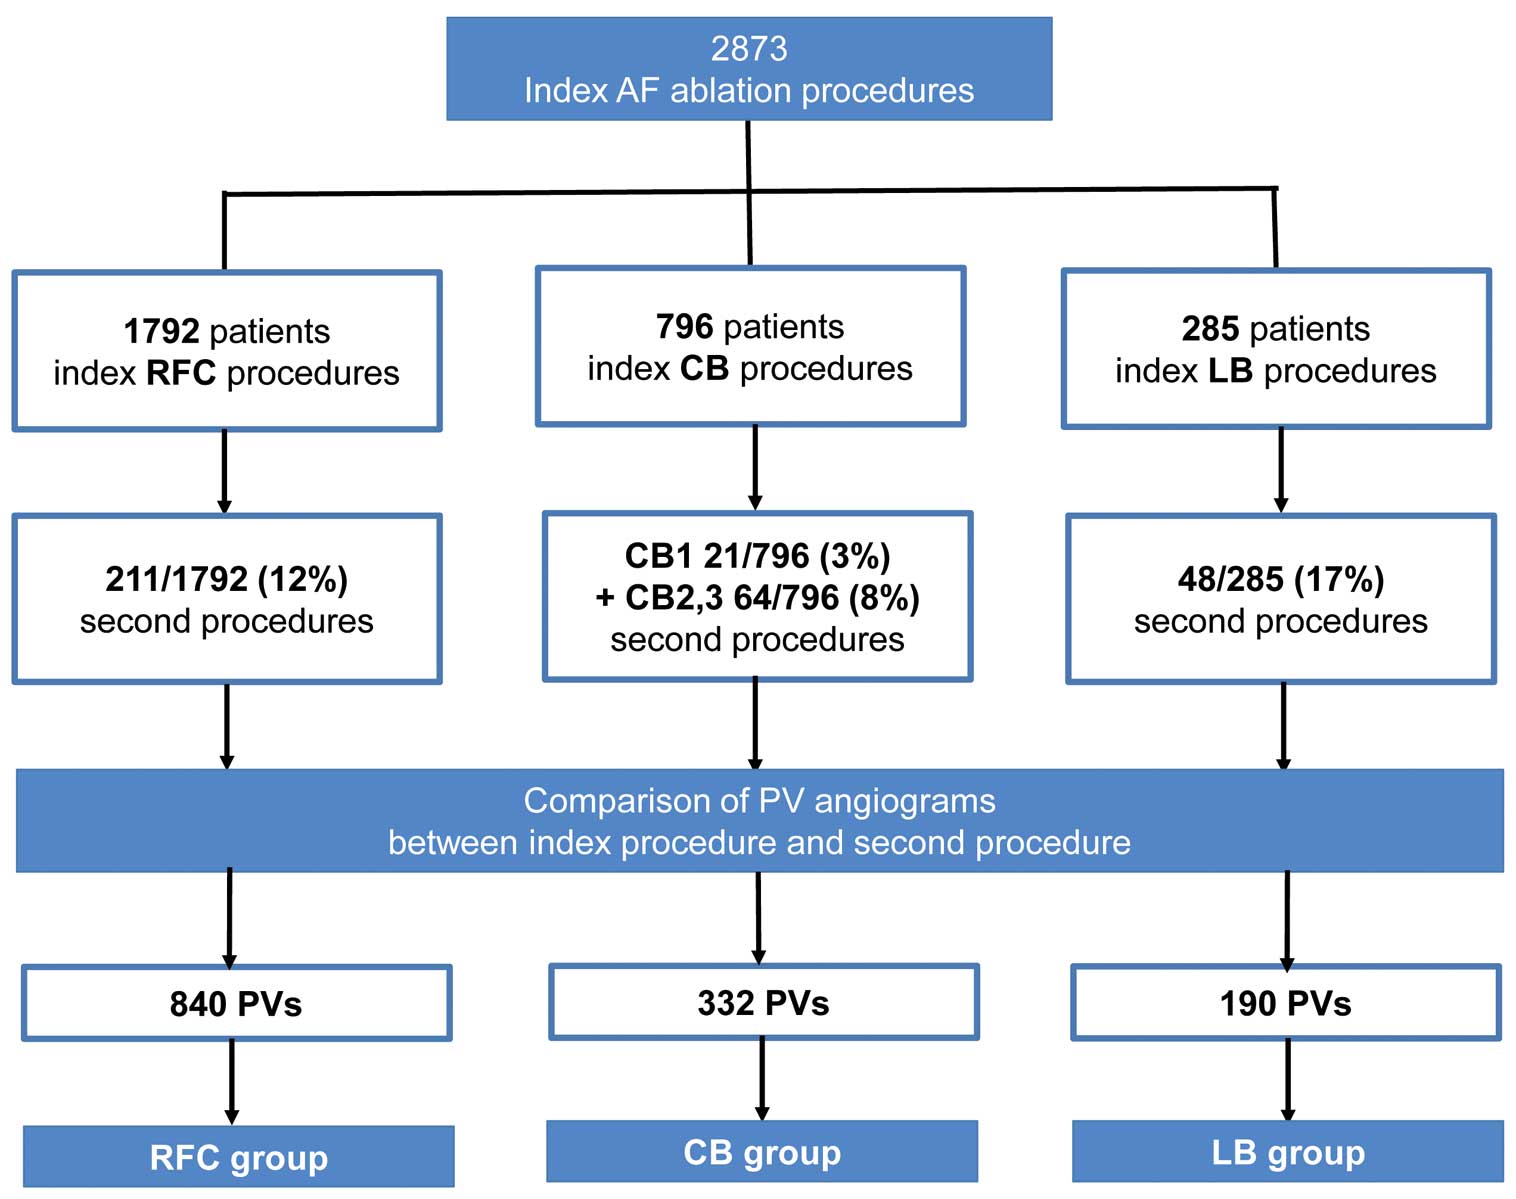
Patients undergoing a second AF ablation between January 2012 and November 2016 were retrospectively identified from the database. Patients were subgrouped according to the utilized index ablation strategy: RFC, CB or LB ablation (Figure 1). PVI was defined as the uniform endpoint in all index procedures. The local institutional review board approved this study. All patients provided written informed consent.
Definition and Analysis of PVS/N
In all patients, selective PV angiograms were performed using a multipurpose and AL2 catheter (6F) in the right anterior oblique (RAO) 30° and left anterior oblique (LAO) 40° angulation as previously described.10
PV angiograms were always performed before ablation in the index and second procedure using an angiography system (AXION-Artis, Forchheim, Siemens, Germany).
At first, we detected the PV ostium at the inflection point of the left atrium (LA)-PV junction as reported previously.11
Then we measured the PV diameter (PVD) at the PV ostium in a direction perpendicular to the long axis of each PV. PVD of the second procedure (PVDsecond) was defined as the minimum PVD from the ostium to 10 mm distal of each PV.
In order to measure the precise absolute value of the PVD even in the oblique view and irrespective of the differences in the distance between the X-ray tube and the heart in different sessions, PVD was measured after calibration with standard software that automatically adjusts the measurement scale using the distance between the table and object (TOD calibration), provided in this angiography system (AXION-Artis, version VC21C, Siemens). PV angiograms were always double-checked by more than 2 experienced physicians. If the PV ostium was unclear, the angiogram of the same PV was performed again. PVD of the right PV, left superior PV, and left inferior/left common PV were measured at RAO, RAO/LAO, and LAO, respectively.
Also, PV without PVS/N from 25 randomly chosen patients were evaluated to assess (1) the inter/intraobserver variability of PVD (n=100 PV); (2) the difference in PVD between measurement using TOD calibration and another calibration method (catheter-based calibration; n=100 PV); and (3) the difference in PVD between the index and second procedure in the same patient (n=72 PV).
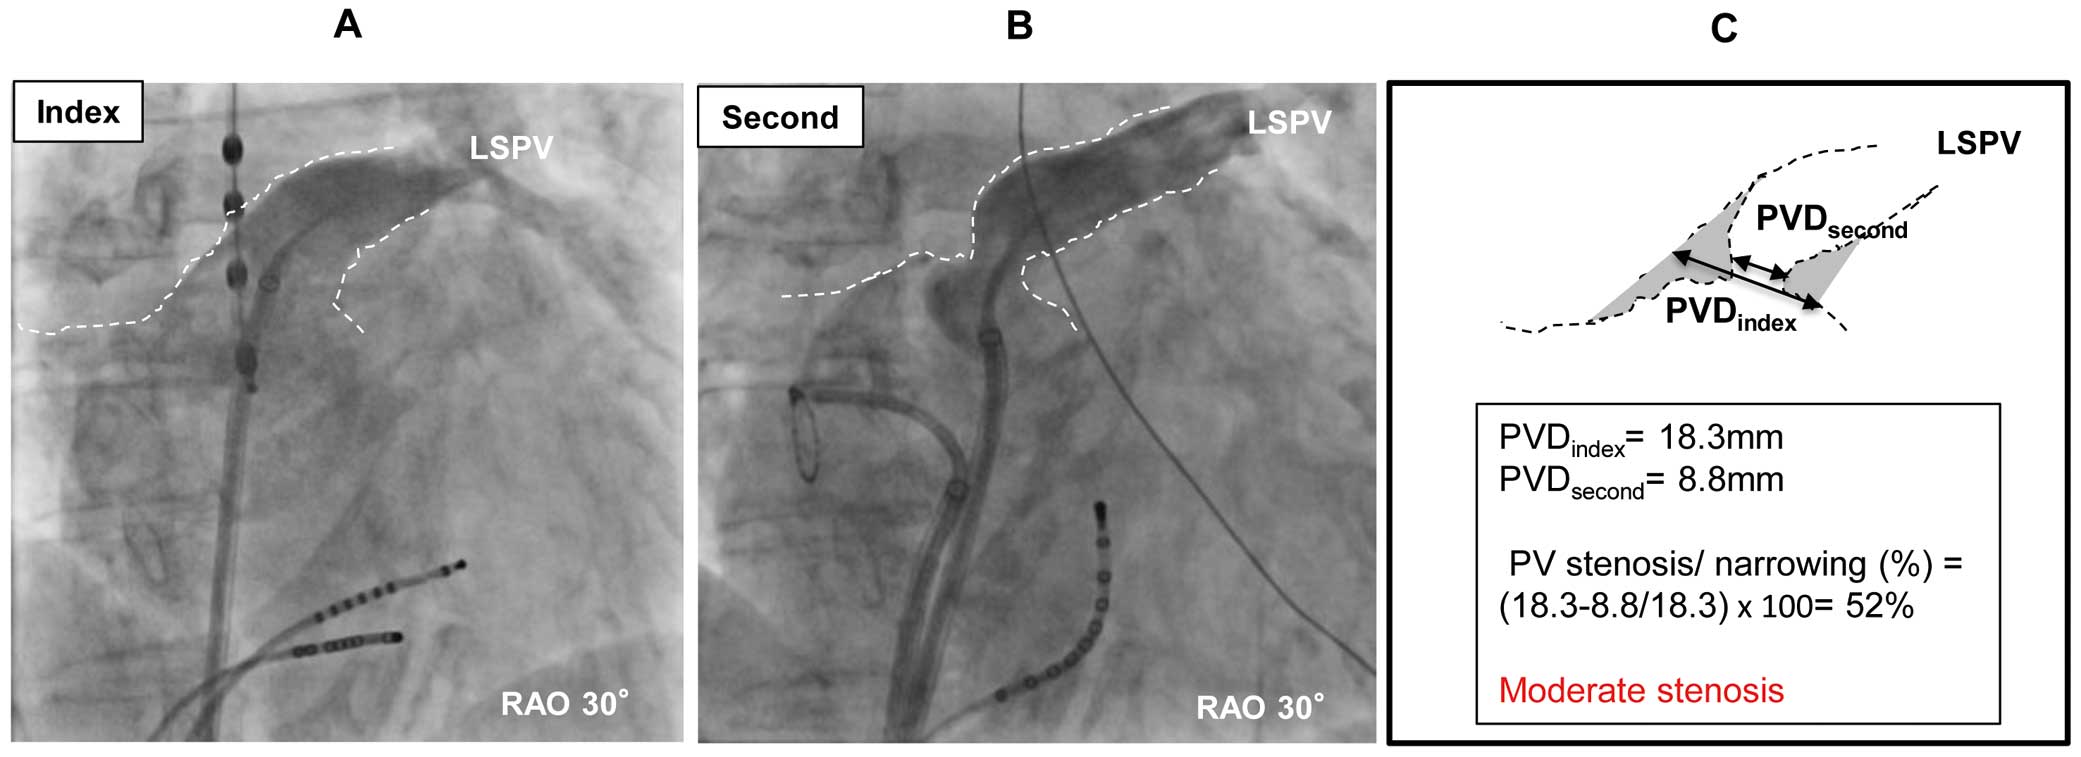
The degree of PVS/N was calculated as follows: PVS/N(%)=([PVDindex−PVDsecond]/PVDindex)×100. PVS/N was classified as absent, mild (25–49%), moderate (50–74%) or severe (≥75%). A representative PV angiogram is shown in
Figure 2.
Index Procedure
Electrophysiological Procedure
All procedures were performed under deep sedation, using boluses of midazolam and fentanyl with continuous infusion of 1% propofol. After placing 1 multipolar catheter in the coronary sinus, a single (CB, LB) or double (RFC) transseptal puncture were performed using the modified Brockenbrough technique and transseptal sheaths (8.5F sheath, SL1; St. Jude Medical). Selective PV angiograms were performed before ablation to define PV anatomy. Details for each ablation strategy are described here and have been reported elsewhere.5–8,10
RFC PVI
After double transseptal punctures and PV angiograms, a 3-D electroanatomic LA map (NavX, St Jude Medical; CARTO3, Biosense Webster, USA) was obtained and ispilateral PV ostia tagged according to selective PV angiograms and local map catheter information. WACA RFC using saline-irrigated ablation catheters (Celsius, Thermocool Navistar, Thermocool Surround Flow Navistar, or Thermocool Smarttouch Surround Flow Navistar; Biosense Webster) was performed. Ablation energy was limited to 30 W (posterior) and to 40 W (anterior). Whenever a contact force sensing catheter was used, contact force ≥10 g was targeted. Procedural endpoint was defined as PV entrance block documented on spiral catheter (Lasso 15, 20 mm, Biosense Webster) for all PV as in CB and LB.
Single CB PVI
After single transseptal puncture and PV angiograms, CB procedures (CB1, Arctic Front; CB2, Arctic Front Advance; CB3, Arctic Front Advance ST, Medtronic) were performed using an exclusively 28-mm balloon. CB positioning maneuvers have been described elsewhere.5–7
Briefly, the CB was positioned in front of the target PV and electrical PV activation was recorded (Axiom Sensis, Siemens) using an endoluminal spiral mapping catheter (Achieve, 20 mm, Medtronic). Cryothermal energy was delivered after angiographic confirmation of adequate CB positioning without sliding into the PV. If signs of CB compression indicating an inadvertent distal PV position were present on fluoroscopy, CB was repositioned. Freeze duration was set to 300 s per application for CB1 and 240–360 s per application for high-dose ablation using CB2,3, respectively. In PV with residual PV activation after the first application, CB was repositioned and cryothermal energy repeatedly delivered until PVI was obtained. Safety applications were dosed according to “time to PVI”,12
or at operator discretion. If balloon-only PVI could not be obtained, focal RFC touch up was allowed.
Visually Guided LB PVI
After single transseptal puncture and PV angiograms, LB was navigated to the target PV by the steerable sheath (12F, CardioFocus). The compliant balloon (9–35 mm) was inflated targeting optimal PV occlusion. An antral balloon position was confirmed on fluoroscopy criteria using PV angiograms and the radiopaque marker at the balloon equator and/or on endoscopy simultaneously visualizing both ipsilateral left PV. Laser energy was deployed in a point-by-point fashion covering 30° of a circle with each ablation lesion. The energy level was titrated according to the degree of tissue exposure between 5.5 W and 12 W, targeting ≥8.5 W as the standard dose after introduction of the high-dose energy concept.9
Ablation energy was applied for 20 or 30 s according to the console’s presets. After complete circular ablation all PV were re-mapped documenting PV entrance block using a circular mapping catheter (Lasso 15; 20 mm, Biosense Webster). If PV potentials remained, additional LB ablation was performed based on PV activation sequence of circular mapping as previously described.8
If balloon-only PVI could not be obtained, focal RFC touch up was allowed.
Second Procedure
In all patients standard selective PV angiograms were performed. All second procedures were performed using RFC energy with a 3-D electroanatomic mapping system as aforedescribed. Whenever PV reconduction was observed, the earliest LA-PV activation site along the previously deployed ablation line was ablated. PV demonstrating either PV activation sequence change or PVI were defined as reconnected PV. Additional ablation beyond PV (cavo-tricuspid isthmus, other linear ablations, non-PV foci ablations, continuous fragmented atrial electrogram ablations) was performed according to the presence of atrial arrhythmias and/or underlying atrial substrate.
Post-Procedure Follow-up
After exclusion of bleeding complication, phenprocoumon controlled within the international normalized ratio range of 2–3 or a novel oral anticoagulant were resumed early postoperatively and continued for ≥8 weeks. A proton pump inhibitor was given for 2 weeks. Anti-arrhythmic drugs were discontinued after ablation. If atrial tachyarrhythmia (ATa) recurred ≤90 days after ablation, resumption of anti-arrhythmic drugs, electrical cardioversion, and/or re-ablation was performed, according to need.
Statistical Analysis
Continuous variables with normal distribution and non-parametric variables are presented as mean±SD or median (IQR), respectively. Comparison between 3 groups was performed using 1-way analysis of variance or Kruskall-Wallis test, according to the variable. Multiple comparisons, including the Tukey and Dunn tests, were performed when a statistically significant difference was observed between 3 groups. For comparison between 2 groups, we used unpaired Student’s t-test and chi-squared test. P<0.05 was considered to indicate statistical significance. Inter/intraobserver variability for PVD; difference in PVD measured using 2 different calibration methods; and the difference in PVD for the same patient between the index and second procedure, were evaluated using a linear regression model.
Results
Patient Characteristics
Between May 2010 and July 2016 a total of 2,873 index AF ablations with the endpoint of PVI were performed at Cardio-angiological Center Bethanien, Markus Hospital, Frankfurt, Germany (RFC, 1,792 patients; CB, 796 patients; LB, 285 patients). A total of 344 patients (RFC, 211 patients; CB, 85 patients; LB, 48 patients) underwent a second AF procedure including PV angiograms, re-mapping and ablation. The second procedure was performed on average 14.9±14.1 months after the index procedure (RFC, 14.5±13.8 months; CB, 15.7±15.2 months; LB, 15.1±13.9 months; P=0.791). All PV were analyzed regarding ablation-induced PVS/N (Figure 1). Baseline characteristics are listed in
Table 1. Patients treated with RFC were older and had more advanced AF stage compared with CB/LB patients. Index procedure data including complications are listed in
Table 2. PV anatomy and PVD was not different between the 3 groups at index procedure (Table 2).
Table 1.
Baseline Clinical Characteristics
| |
RFC |
CB |
LB |
P-value |
| 211 patients |
85 patients |
48 patients |
| Male |
136 (64) |
50 (59) |
22 (46) |
0.006 |
| Age (years) |
69±10 |
66±11 |
69±10 |
0.024*,†
|
| Paroxysmal AF |
65 (31) |
45 (53) |
18 (38) |
0.009**,†
|
| History of AF (years) |
4.3±4.1 |
4.3±4.4 |
3.6±2.6 |
0.953 |
| Hypertension |
165 (78) |
67 (79) |
38 (79) |
0.986 |
| Diabetes |
16 (8) |
9 (11) |
6 (13) |
0.476 |
| Stroke |
11 (5) |
5 (6) |
5 (10) |
0.395 |
| CAD |
43 (20) |
10 (12) |
8 (17) |
0.210 |
| No. AAD |
1 (1–2) |
1 (1–1) |
1 (0–1) |
0.129 |
| LAD (mm) |
44±6 |
41±5 |
41±6 |
0.001**,‡
|
| LVEF (%) |
58±10 |
61±7 |
60±8 |
0.057 |
| Time to second ablation (months) |
14.5±13.8 |
15.7±15.2 |
15.1±13.9 |
0.791 |
Data given as mean±SD, n (%) or median (IQR). *P<0.05, **P<0.01 (†RFC vs. CB; ‡RFC vs. CB/LB). AF, atrial fibrillation; AAD, anti-arrhythmic drug; CAD, coronary artery disease; CB, big cryoballoon; LAD, left atrium diameter; LB, laser balloon; LVEF, left ventricular ejection fraction; RFC, irrigated radiofrequency current.
Table 2.
Index Procedure Data
| |
RFC |
CB |
LB |
P-value |
| 211 patients |
85 patients |
48 patients |
| Ablation |
| Isolation of all PV |
211 (100) |
84 (99) |
48 (100) |
0.217 |
| Touch up with RFC |
– |
0 (0) |
1 (2) |
NA |
| Additional ablations |
46 (22) |
3 (4) |
1 (2) |
<0.001***,† |
| Contact force catheter |
32 (15) |
– |
– |
|
| CB2,3 |
– |
64 (75) |
– |
– |
| Standard-dose protocol (8.5–12 W) |
– |
– |
45 (94) |
– |
| PVD |
| RSPV (mm) |
17.2±2.7 |
16.9±2.5 |
17.0±1.9 |
0.829 |
| RIPV (mm) |
17.2±3.0 |
17.6±2.6 |
18.2±3.1 |
0.381 |
| LSPV (mm) |
17.3±2.7 |
16.8±2.8 |
16.2±2.7 |
0.328 |
| LIPV (mm) |
16.0±2.8 |
15.7±2.6 |
17.3±3.6 |
0.178 |
| LCPV (mm) |
23.8±2.4 |
33.7±13.3 |
22.4±1.0 |
0.204 |
| Complications |
| Death |
0 |
0 |
0 |
1.000 |
| Pericardial tamponade/effusion |
0 |
0 |
0 |
1.000 |
| Phrenic nerve palsy |
0 |
2 (2) |
1 (2) |
NA |
| Stroke |
0 |
0 |
0 |
1.000 |
| Groin-related complication |
8 (4) |
1 (1) |
1 (2) |
0.260 |
Data given as mean±SD or n (%). ***P<0.001 (†RFC vs. CB/LB). Additional ablations, cavo-tricuspid isthmus, other linear ablations, non-pulmonary vein foci ablations, continuous fragmented atrial electrographic ablations; CB(2,3), (second-/third-generation) big cryoballoon; LB, laser balloon; LCPV, left common pulmonary vein; LIPV, left inferior pulmonary vein; LSPV, left superior pulmonary vein; NA, not available; PV(D), pulmonary vein (diameter); RFC, irrigated radiofrequency current; RIPV, right inferior pulmonary vein; RSPV, right superior pulmonary vein.
The endpoint of acute PVI was not significantly different in all groups (P=0.217). Additional ablation beyond PVI was more common in the RFC group compared with CB and LB (P<0.01;
Table 2). In 1 patient (CB group), right inferior PV (RIPV) could not be isolated during the index procedure because of phrenic nerve palsy. In the LB group focal RFC touch up ablation was required to accomplish PVI in 1 patient. In the RFC group, contact force catheters were used in 32 (15%) of 211 patients. In the CB group, 64 (75%) of 85 patients were treated with CB2,3 ablation. In the LB group, standard-dose LB ablation was performed in 45 (94%) of 48 patients (Table 2).
PVD Variation
Linear regression analysis for PVD in 100 PV from 25 patients demonstrated good correlation, with small difference in PVD for (1) inter/intraobserver difference; and (2) the difference between TOD calibration and catheter-based calibration method (interobserver difference, 0.8±0.7 mm, r=0.91, P<0.001; intraobserver difference, 0.4±0.3 mm, r=0.98, P<0.001; calibration method difference, 0.9±0.9 mm, r=0.90, P<0.001). Also, the difference in PVD between the index and second procedure in the same cohort also had excellent correlation, with small difference in PVD (0.7±0.5 mm, r=0.95, P<0.001; n=72 PV).
PVS/N
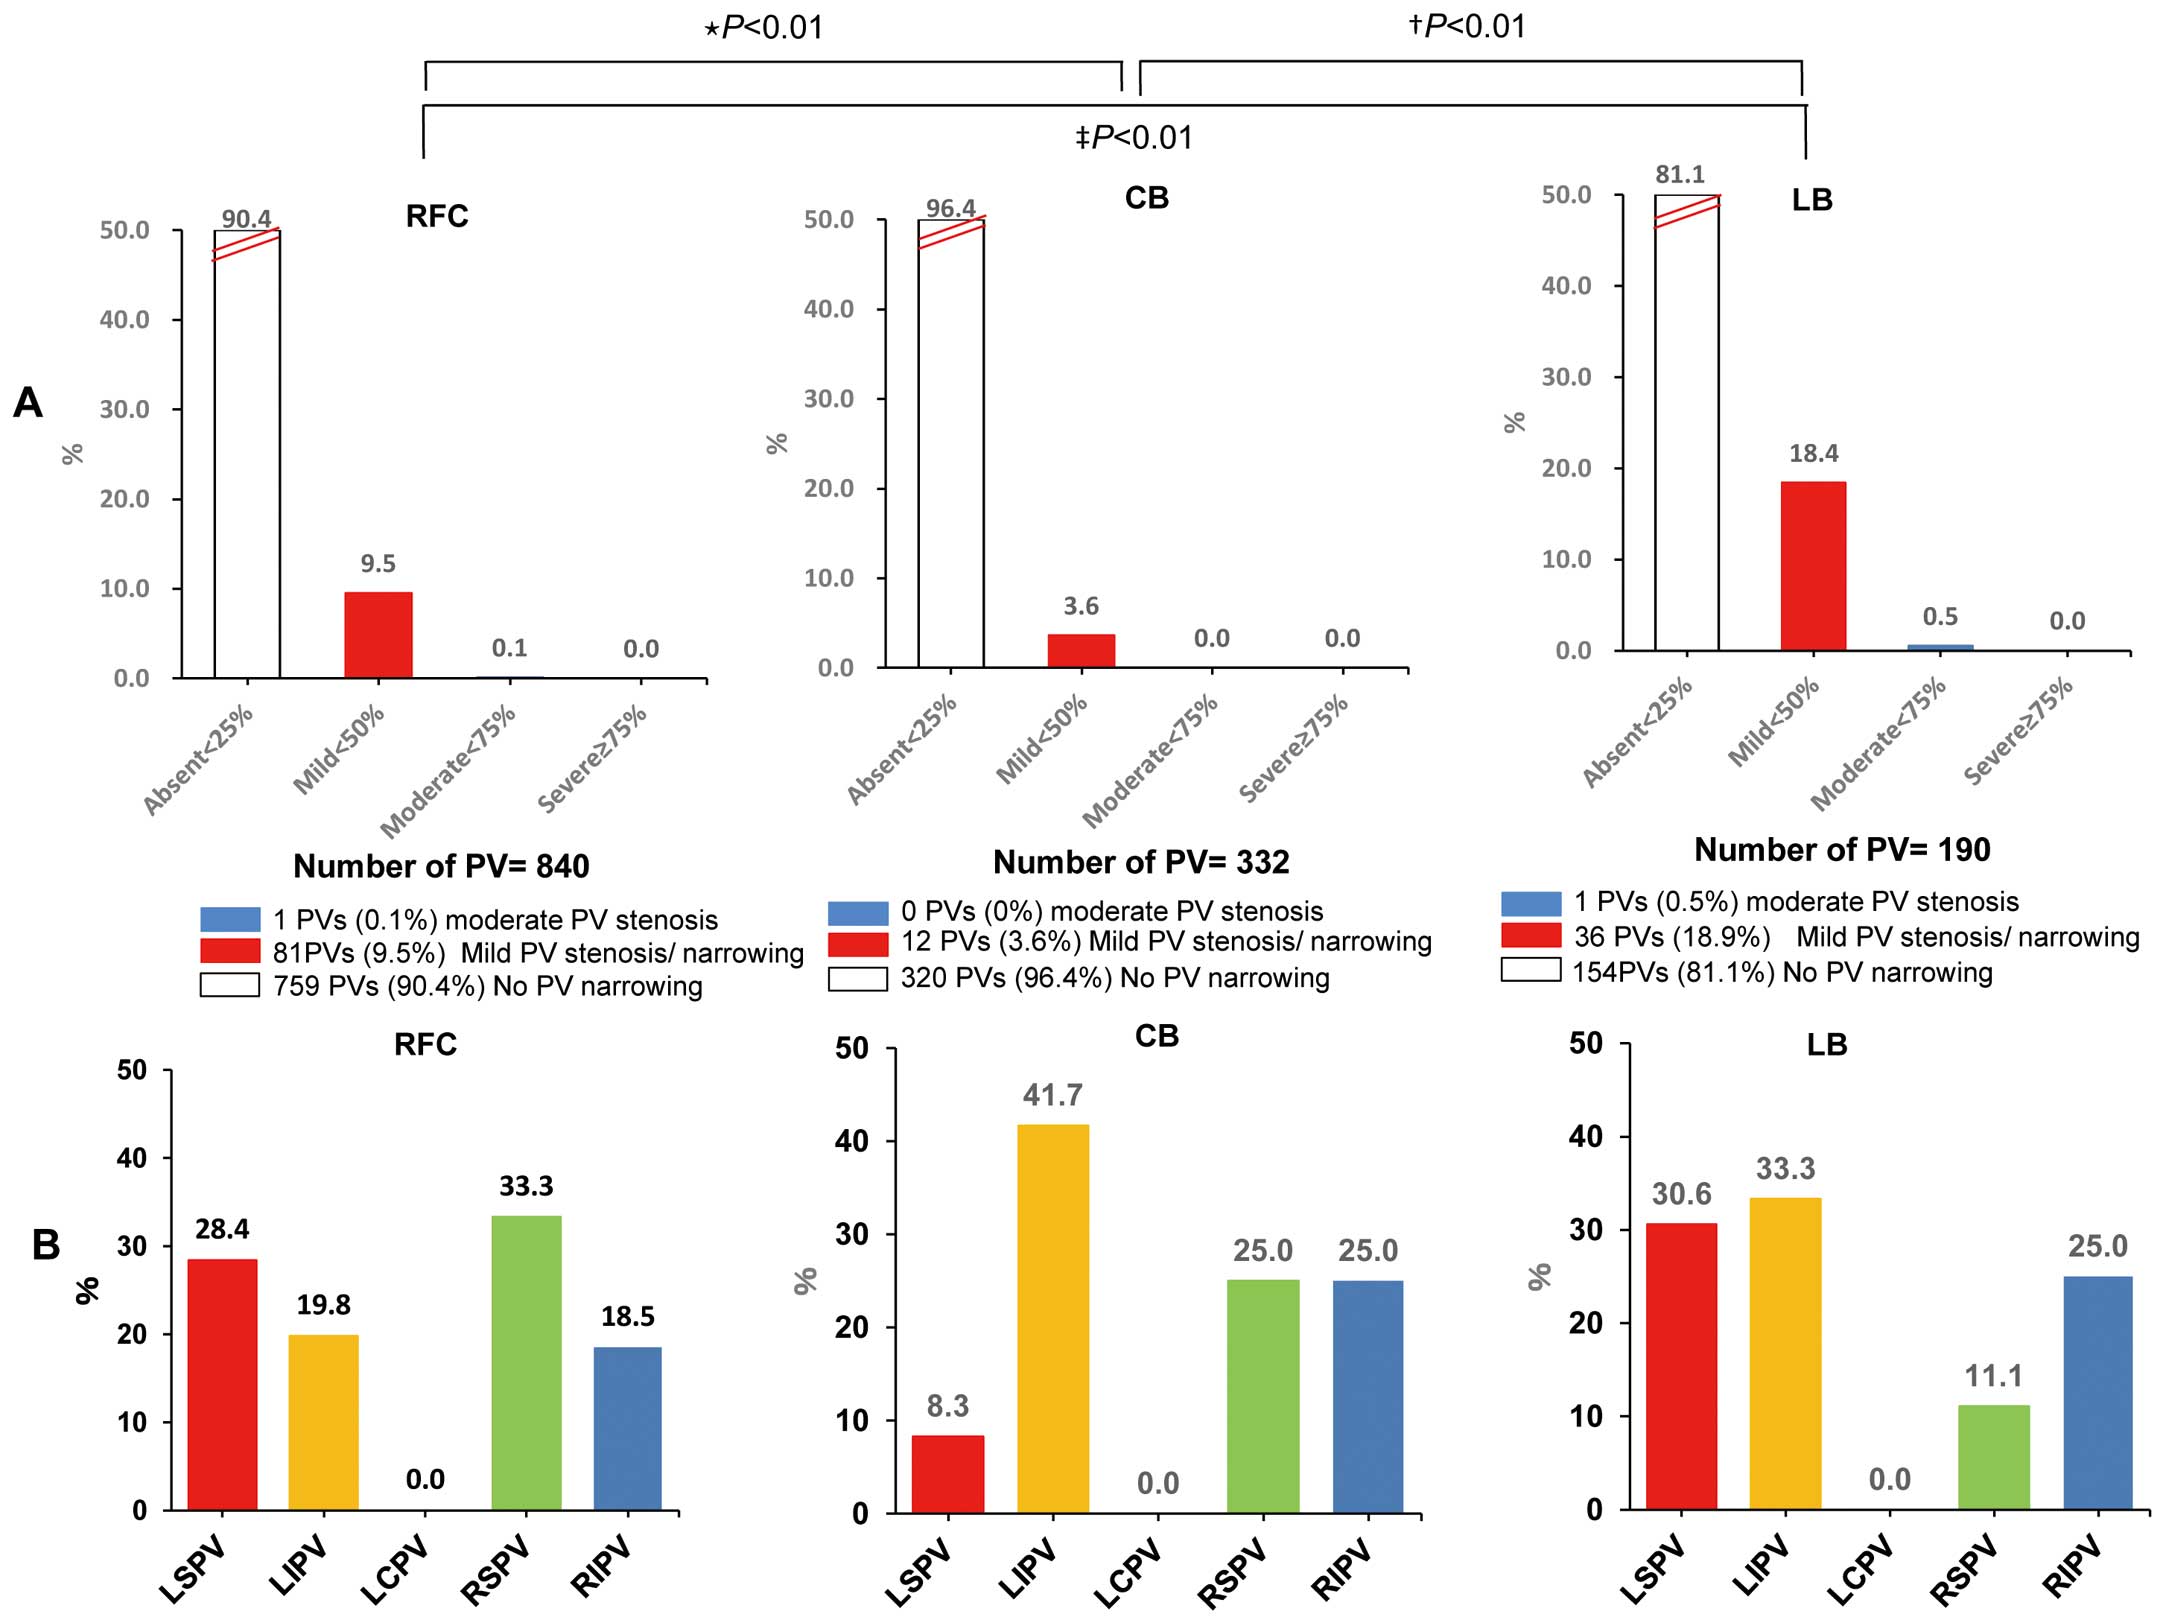
During the second procedure all previously ablated PV could be identified. Therefore, ablation-induced PV occlusion was excluded. No case of severe PVS was seen in any of the 3 groups (RFC vs. CB vs. LB, P=1.000). Moderate PVS was observed for RFC in 1/840 (0.1%) PV, for CB in 0/332 (0%) PV, and for LB in 1/190 (0.5%) PV (P=NA), respectively. Two cases of moderate PVS were recognized at the RIPV (RFC) and the left superior PV (LSPV; LB). Mild PVS/N was identified in 80/840 PV (9.5%) in the RFC group, 12/332 PV (3.6%) in the CB group, and 35/190 PV (18.4%) in the LB group (RFC vs. CB, P<0.01; RFC vs. LB, P<0.01; CB vs. LB, P<0.01). There was no significant difference in the incidence of PVS/N between LSPV/left inferior PV/right superior PV/RIPV in each group (P=NS). No symptoms attributable to PVS were observed during follow-up in any patients, and no PV intervention or operation was required. Also, there was no symptomatic PVS in the 2,529 patients who did not undergo a second procedure (Figure 3).
We compared patients or PV with or without PVS in terms of each procedural parameter in all groups at index procedure (Table 3).
Table 3.
Index Procedure Data vs. PVS/N Status
| |
With PVS/N |
Without PVS/N |
P-value |
| RFC |
58 patients |
153 patients |
|
| Total energy per ipsilateral PV (J) |
19,672±5,152 |
18,967±6,281 |
0.616 |
| Contact force catheter |
13 (22.4) |
19 (12.4) |
0.071 |
| CARTO 3 |
55 (95) |
139 (91) |
0.506 |
| NavX |
3 (5) |
14 (9) |
0.506 |
| CB2,3† |
12 PV |
238 PV |
|
| No. applications per PV |
2 (1.5–2) |
2 (1–2) |
0.109 |
| Freeze duration per PV (s) |
423±225 |
365±180 |
0.288 |
| Minimum CB temperature (℃) |
−43.3±13.2 |
−49.4±6.1 |
0.144 |
| PV occlusion grade |
3.5 (3–4) |
4 (3–4) |
0.192 |
| LB |
36 PV |
154 PV |
|
| No. applications per PV |
26.7±7.6 |
29.9±10.5 |
0.054 |
| Standard-dose protocol (8.5–12 W) |
36 (100) |
143 (93) |
0.209 |
| Total energy per PV (J) |
5,555±1,358 |
5,891±1,253 |
0.401 |
Data given as mean±SD, n (%) or median (IQR). †No PVS/N was recognized in the CB1 group (CB1 vs. CB2,3, P=0.093). CB1–3, first–third-generation big cryoballoon; LB, laser balloon; PV, pulmonary vein; PV occlusion grade (semi-quantitative scale), 1 (poor)–4 (perfect); PVS/N, pulmonary vein stenosis/narrowing; RFC, irrigated radiofrequency current.
In the RFC group, total ablation energy per ipsilateral PV, use of contact force catheter, and type of electroanatomical mapping system (i.e., CARTO3, NavX) had no significant correlation with the risk of PVS/N (P=NS).
In the CB group, PVS/N per PV did not differ for CB1 vs. CB2,3 (CB1, 0/82 PV, 0%; CB2,3, 12/250 PV, 5%; P=0.093). For CB2,3 there were also no significant differences in total application number, total application duration, mean minimum temperature, or mean occlusion grade per PV according to PVS/N status (P=NS).
In the LB group, 45 of 48 patients (94%) were treated with the standard-dose protocol. Total LB application number, use of standard-dose protocol (≥8.5 W), or total ablation energy per PV did not correlate with the risk of PVS/N (P=NS).
Similarly, for each different procedure, there was no significant difference in clinical characteristics according to PVS/N status (Table 4).
Table 4.
Subject Characteristics vs. PVS/N Status
| |
RFC |
CB |
LB |
| With PVS/N |
Without
PVS/N |
P-value |
With PVS/N |
Without
PVS/N |
P-value |
With PVS/N |
Without
PVS/N |
P-value |
| 58 patients |
153 patients |
12 patients |
73 patients |
20 patients |
28 patients |
| Male |
35 (60) |
101 (66) |
0.158 |
8 (67) |
42 (58) |
0.754 |
9 (45) |
13 (46) |
0.845 |
| Age (years) |
69±8 |
69±10 |
0.964 |
66±12 |
66±11 |
0.971 |
68±9 |
70±10 |
0.350 |
| Paroxysmal AF |
17 (29) |
48 (31) |
0.772 |
6 (50) |
39 (53) |
0.927 |
6 (30) |
12 (43) |
0.545 |
| Hypertension |
44 (76) |
121 (79) |
0.613 |
9 (75) |
58 (79) |
1.000 |
16 (80) |
22 (79) |
1.000 |
| Diabetes |
6 (10) |
10 (7) |
0.521 |
1 (8) |
8 (11) |
1.000 |
2 (10) |
4 (14) |
0.476 |
| Stroke |
2 (3) |
9 (6) |
0.478 |
0 (0) |
5 (7) |
0.602 |
3 (15) |
2 (7) |
0.637 |
| CAD |
14 (24) |
29 (19) |
0.520 |
2 (17) |
8 (11) |
0.628 |
3 (15) |
5 (18) |
1.000 |
| LAD (mm) |
45±6 |
43±6 |
0.252 |
40±4 |
42±6 |
0.343 |
42±4 |
40±7 |
0.421 |
| LVEF (%) |
59±9 |
58±11 |
0.382 |
63±6 |
61±7 |
0.327 |
60±9 |
60±7 |
0.968 |
| PVD (mm) |
16.7±2.5 |
17.5±3.1 |
0.074 |
16.5±2.3 |
17.4±3.7 |
0.076 |
16.9±2.9 |
17.4±3.2 |
0.323 |
Data given as mean±SD or n (%). Abbreviations as in Tables 1–3.
In this study, PVS/N was identified in 129 (9%) of a total of 1,362 PV. PV reconnection was detected in 271/840 (32%), 108/332 (33%), and 63/190 PV (33%) in the RFC, CB, and LB groups, respectively (P=0.971). There was no significant difference in the incidence of PV reconnection in the second procedure between PV with and without PVS/N (35/129, 27% vs. 407/1,233, 33%, respectively; P=0.175).
Discussion
Major Findings
We investigated and compared the incidence and extent of PVS/N after PVI with different energy sources and recent ablation technologies/strategies. Freeze duration per application with CB2,3 in the present study (240–360 s) was relatively long compared with recent reports.13,14
As for LB, as mentioned herein, dose ≥8.5 W has already been considered as a standard regimen. Therefore, we compared the risk of PVS/N in “current standard RFC”, “high-dose CB”, and “standard-dose LB”.
The important findings of the present study are as follows: (1) PV occlusion or severe PVSs were absent and the risk of moderate PVS was very low in a large group of 344 patients after WACA RFC (32/211 patients; 15% with contact force catheter), CB (64/85 patients; 75% with CB2,3) or LB (45/48 patients;. 94% with standard-dose protocol ≥8.5 W) ablation, and no PV intervention or surgery was needed; (2) the introduction of high-energy balloon such as CB2,3 and a standard-dose (≥8.5 W) LB ablation protocol did not alter the risk of PVS/N; (3) the risk of mild PVS/N was lowest in CB despite a high-dose regimen, while the risk of mild PVS/N was highest in the standard LB regimen; and (4) this is the first report comparing simultaneously the risk of PVS/N between the 3 different ablation energies after PVI performed by the same operators, at the same time, and in the same institution, and the relevant PVS (≥50%) risk was not different between the 3 ablation energies.
Previous studies investigating the time course of PVS after RFC PVI reported ceased progression 6 months after ablation.3,15,16
In the present study, the mean interval between index PVI and PV re-assessment was approximately 15 months, thus minimizing the risk of missing progressive PVN due to the index ablation. According to those reports, mild PVS/N also remained typically unchanged and is unlikely to cause symptoms. In the present study, clinically relevant PVS (≥50%) was very rare in all groups after a mean of 6 months. Therefore, all technologies appear to be equally safe.
In addition, we evaluated only second procedures. As mentioned herein, however, there was no significant association between PVS/N and reconnected PV. The present results might be also useful for the risk stratification of worsening PVS/N in second procedure.
PVS/N: Comparison With Past Reports
RFC
Several single-center studies of PVS after RFC ablation have been reported.11,15,16
In those reports, the overall rate of PVS after PVI was approximately 2–24% per PV, as in the present study using evolved technique/technology such as WACA RFC and contact force catheter.
Pürerfellner et al stated that there was no significant correlation between PVS and ablation energy with regard to risk of PVS after RFC ablation.15
In addition to this, we newly found that contact force catheter use itself and the type of 3-D mapping system do not correlate with PVS. In contrast, Saad et al reported that ablation in the PV may contribute to PVS.3
With regard to RFC in particular, operators have different skill levels, ablation techniques, and LA reconstruction methods using a 3-D mapping system. These differences might affect ablation in the PV. Also, contact force, the indices related to contact force, and wall thickness at the PV-LA junction may affect lesion formation.4,17,18
Further studies are needed to determine the influence of these indices on PVS.
CB
Narui et al recently reported PVN of 37% per PV, and 1 PV requiring PV intervention after CB2 ablation,19
whereas the present data are in contrast to this. In the present study there was no significant difference between PVS/N and the index procedure parameters (Table 3). Importantly, no difference between low- and high-power ablation (CB1 vs. CB2,3) was also found. The cooling zone of CB1 occurs only in a relatively small part of the balloon maximum diameter, whereas that of CB2,3 is in the entire front part of the balloon.6,7
Theoretically, in CB2,3, there is a possibility of ablation on the inside of the PV compared with CB1. Moderate or severe PVS, however, was not observed in CB2,3 in the present study, although freeze duration per application was relatively long, as already noted. Narui et al screened 74 patients utilizing computed tomography (CT) before and 3 months after CB2 ablation. No selective baseline PV angiograms were performed to delineate PV ostium/anatomy directly at the time of the procedure, although it might be difficult to confirm the details of PV ostium/anatomy during the procedure using only preoperative CT. Interestingly, they reported that larger PV ostia along with deeper balloon were associated with PVS, which may indicate a distal CB position. As a result, direct confirmation of PV ostium/anatomy using intraoperative PV angiogram may be useful in reducing the risk of deep CB positioning; and correct antral CB position still appears to be important to prevent this complication.
LB
Dukkipati et al reported that the incidence of significant PVS is low on CT or magnetic resonance imaging (MRI) after LB PVI, but in that study no standard-dose protocol (≥8.5 W) was applied.20
Additionally, they did not examine the relationship between titrated laser energy and PVS. The present study, however, suggests that there is no correlation between PVS/N and application energy per PV.
Lesion Differences According to Ablation Energy and PVS/N
Khurram et al reported that the RFC and cryothermal groups had diffuse late gadolinium enhancement around the PV-LA junction on MRI, which indicates fibrosis, 3 months after PVI, while the laser group had clearly sharp and discrete linear late gadolinium enhancement at that area.21
Perrotta et al also compared the ablated area of the PV-LA junction on re-mapping immediately after PVI with CB and LB, and found that a larger area of the PV-LA junction was ablated in CB than in LB.22
Thus, there seems to be a slight histological difference in lesions exposed to the 3 energies. Perhaps this lesion difference might have affected the difference in incidence of mild PVS/N in the present study. In particular, laser energy is presumed to be able to form more definite lesions in the PV-LA junction compared with radiofrequency and cryothermal energy, as seen in the Khurram et al21
and the present studies. Moderate and severe PVS, however, were rarely seen in any of the present groups. Therefore, even if these histological small differences in the lesions between the 3 energies are related to PVS, these differences might have little impact on PVS/N clinically.
We considered the possibility that PVS/N correlated with transmural lesions, but we could not identify a significant relationship between PVS/N and PV reconnection. This, however, does not completely rule out a correlation between PVS and sufficient lesion size.
Study Limitations
This study reported on a single-center retrospective experience from a high-volume ablation center in an evolving field. Therefore, different catheter types and energy dosing strategies were utilized over time.
No routine post-procedural CT or MRI was performed. Compared with the area measurement of PV on CT or MRI, the ideal imaging modality to routinely exclude PVS/N might not be invasive PV angiogram, although Dill et al proved, in the evaluation of 44 PV, that PVD evaluated on PV angiography was correlated with that measured on magnetic resonance angiography (r=0.93, P<0.001).23
PV angiograms were evaluated only for patients with ATa recurrence. The present cohort did not include the general population after PVI with these technologies.
Conclusions
The risk for significant PVS is low after WACA RFC and CB. The incidence of mild PVS/N, however, was highest after standard-dose LB ablation and lowest after high-dose CB ablation.
Disclosures
S.B. has received speaker honoraria from CardioFocus. B.S. and J.K.R.C. are consultants to Medtronic and have received research grants and speaker honoraria from CardioFocus. The other authors declare no conflicts of interest.
References
- 1.
January CT, Wann LS, Alpert JS, Calkins H, Cigarroa JE, Cleveland JC Jr, et al. 2014 AHA/ACC/HRS guideline for the management of patients with atrial fibrillation: A report of the American College of Cardiology/American Heart Association Task Force on Practice Guidelines and the Heart Rhythm Society. J Am Coll Cardiol 2014; 64: 2305–2307.
- 2.
Calkins H, Hindricks G, Cappato R, Kim YH, Saad EB, Aguinaga L, et al. 2017 HRS/EHRA/ECAS/APHRS/SOLAECE expert consensus statement on catheter and surgical ablation of atrial fibrillation. Heart Rhythm 2017; 14: e275–e444.
- 3.
Saad EB, Rossillo A, Saad CP, Martin DO, Bhargava M, Erciyes D, et al. Pulmonary vein stenosis after radiofrequency ablation of atrial fibrillation: Functional characterization, evolution, and influence of the ablation strategy. Circulation 2003; 108: 3102–3107.
- 4.
Nakagawa H, Jackman WM. The role of contact force in atrial fibrillation ablation. J Atr Fibrillation 2014; 7: 1027.
- 5.
Chun KRJ, Schmidt B, Metzner A, Tilz R, Zerm T, Köster I, et al. The ‘single big cryoballoon’ technique for acute pulmonary vein isolation in patients with paroxysmal atrial fibrillation: A prospective observational single centre study. Eur Heart J 2009; 30: 699–709.
- 6.
Fürnkranz A, Bordignon S, Schmidt B, Gunawardene M, Schulte-Hahn B, Urban V, et al. Improved procedural efficacy of pulmonary vein isolation using the novel second-generation cryoballoon. J Cardiovasc Electrophysiol 2013; 24: 492–497.
- 7.
Fürnkranz A, Bologna F, Bordignon S, Perrotta L, Dugo D, Schmidt B, et al. Procedural characteristics of pulmonary vein isolation using the novel third-generation cryoballoon. Europace 2016; 18: 1795–1800.
- 8.
Metzner A, Wissner E, Schmidt B, Chun J, Hindricks G, Piorkowski C, et al. Acute and long-term clinical outcome after endoscopic pulmonary vein isolation: Results from the first prospective, multicenter study. J Cardiovasc Electrophysiol 2013; 24: 7–13.
- 9.
Bordignon S, Chun KR, Gunawardene M, Urban V, Kulikoglu M, Miehm K, et al. Energy titration strategies with the endoscopic ablation system: Lessons from the high-dose vs. low-dose laser ablation study. Europace 2013; 15: 685–689.
- 10.
Ouyang F, Bänsch D, Ernst S, Schaumann A, Hachiya H, Chen M, et al. Complete isolation of left atrium surrounding the pulmonary veins: New insights from the double-lasso technique in paroxysmal atrial fibrillation. Circulation 2004; 110: 2090–2096.
- 11.
Kato R, Lickfett L, Meininger G, Dickfeld T, Wu R, Juang G, et al. Pulmonary vein anatomy in patients undergoing catheter ablation of atrial fibrillation: Lessons learned by use of magnetic resonance imaging. Circulation 2003; 107: 2004–2010.
- 12.
Chun KR, Stich M, Fürnkranz A, Bordignon S, Perrotta L, Dugo D, et al. Individualized cryoballoon energy pulmonary vein isolation guided by real-time pulmonary vein recordings, the randomized ICE-T trial. Heart Rhythm 2017; 14: 495–500.
- 13.
Ciconte G, de Asmundis C, Sieira J, Conte G, Di Giovanni G, Mugnai G, et al. Single 3-minute freeze for second-generation cryoballoon ablation: One-year follow-up after pulmonary vein isolation. Heart Rhythm 2015; 12: 673–680.
- 14.
Aryana A, Kenigsberg DN, Kowalski M, Koo CH, Lim HW, O’Neill PG, et al. Verification of a novel atrial fibrillation cryoablation dosing algorithm guided by time-to-pulmonary vein isolation: Results from the Cryo-DOSING Study (Cryoballoon-ablation DOSING Based on the Assessment of Time-to-Effect and Pulmonary Vein Isolation Guidance). Heart Rhythm 2017; 14: 1319–1325.
- 15.
Pürerfellner H, Cihal R, Aichinger J, Martinek M, Nesser HJ. Pulmonary vein stenosis by ostial irrigated-tip ablation: Incidence, time course, and prediction. J Cardiovasc Electrophysiol 2003; 14: 158–164.
- 16.
Maeda S, Iesaka Y, Otomo K, Uno K, Nagata Y, Suzuki K, et al. No severe pulmonary vein stenosis after extensive encircling pulmonary vein isolation: 12-month follow-up with 3D computed tomography. Heart Vessels 2011; 26: 440–448.
- 17.
Das M, Loveday JJ, Wynn GJ, Gomes S, Saeed Y, Bonnett LJ, et al. Ablation index, a novel marker of ablation lesion quality: Prediction of pulmonary vein reconnection at repeat electrophysiology study and regional differences in target values. Europace 2017; 19: 775–783.
- 18.
Iso K, Okumura Y, Watanabe I, Nagashima K, Sonoda K, Kogawa R, et al. Wall thickness of the pulmonary vein-left atrial junction rather than electrical information as the major determinant of dormant conduction after contact force-guided pulmonary vein isolation. J Interv Card Electrophysiol 2016; 46: 325–333.
- 19.
Narui R, Tokuda M, Matsushima M, Isogai R, Tokutake K, Yokoyama K, et al. Incidence and factors associated with the occurrence of pulmonary vein narrowing after cryoballoon ablation. Circ Arrhythm Electrophysiol 2017; 10: e004588.
- 20.
Dukkipati SR, Cuoco F, Kutinsky I, Aryana A, Bahnson TD, Lakkireddy D, et al. Pulmonary vein isolation using the visually guided laser balloon: A prospective, multicenter, and randomized comparison to standard radiofrequency ablation. J Am Coll Cardiol 2015; 66: 1350–1360.
- 21.
Khurram IM, Catanzaro JN, Zimmerman S, Zipunnikov V, Berger RD, Cheng A, et al. MRI evaluation of radiofrequency, cryothermal, and laser left atrial lesion formation in patients with atrial fibrillation. Pacing Clin Electrophysiol 2015; 38: 1317–1324.
- 22.
Perrotta L, Konstantinou A, Bordignon S, Fürnkranz A, Dugo D, Chun KJ, et al. What is the acute antral lesion size after pulmonary vein isolation using different balloon ablation technologies? Circ J 2017; 81: 172–179.
- 23.
Dill T, Neumann T, Ekinci O, Breidenbach C, John A, Erdogan A, et al. Pulmonary vein diameter reduction after radiofrequency catheter ablation for paroxysmal atrial fibrillation evaluated by contrast-enhanced 3-dimensional magnetic resonance imaging. Circulation 2003; 107: 845–850.