Abstract
Background:
We investigated the relationship between intraprocedural angiographic and echocardiographic AR severity after TAVI, and the clinical robustness of angiographic assessment.
Methods and Results:
In 74 consecutive patients, the echocardiographic circumferential extent (CE) of the paravalvular regurgitant jet was retrospectively measured and graded based on the VARC-2 cut-points; and angiographic post-TAVI AR was retrospectively quantified using contrast videodensitometry (VD) software that calculates the ratio of the contrast time-density integral in the LV outflow tract to that in the ascending aorta (LVOT-AR). Seventy-four echocardiograms immediately after TAVI were analyzable, while 51 aortograms were analyzable for VD. These 51 echocardiograms and VD were evaluated. Median LVOT-AR across the echocardiographic AR grades was as follows: none-trace, 0.07 (IQR, 0.05–0.11); mild, 0.12 (IQR, 0.09–0.15); and moderate, 0.17 (IQR, 0.15–0.22; P<0.05 for none-trace vs. mild, and mild vs. moderate). LVOT-AR strongly correlated with %CE (r=0.72, P<0.0001). At 1 year, the rate of the composite end-point of all-cause death or HF re-hospitalization was significantly higher in >mild AR patients compared with no-mild AR on intra-procedural echocardiography (41.5% vs. 12.4%, P=0.03) as well as in patients with LVOT-AR >0.17 compared with LVOT-AR ≤0.17 (59.5% vs. 16.6%, P=0.03).
Conclusions:
VD (LVOT-AR) has good intra-procedural inter-technique consistency and clinical robustness. Greater than mild post-TAVI AR, but not mild post-TAVI AR, is associated with late mortality.
Moderate-severe residual aortic regurgitation (AR), mainly paravalvular, after transcatheter aortic valve implantation (TAVI), is an indicator of worse clinical outcome.1,2
Furthermore, even mild post-TAVI AR has been linked to worse clinical outcome.3,4
In minimally invasive TAVI, transthoracic echocardiography (TTE) and aortic root angiography, typically using Seller’s grading,5
may play a key role in intra-procedural post-TAVI paravalvular leak (PVL) assessment. The intra-procedural echocardiographic imaging, detection, and quantification of PVL is particularly challenging.2
Although the reproducibility of echocardiographic PVL assessment has been improved using a granular approach,6,7
the inter-technique consistency of other modalities (e.g., angiography) is still to be investigated.2,8
Recently, the feasibility of the objective and reproducible angiographic method using videodensitometry (VD) software,9,10
the gauging of AR severity as a continuous value and its clinical impact on late mortality, have been reported.10
Miyazaki et al and Abdelghani et al have reported on the accuracy of the VD assessment and noted that it highly correlated with the regurgitation fraction in an in vitro setting.11,12
Therefore, VD assessment (i.e., calculation of the ratio of the contrast time-density integral in the left ventricular outflow tract to that in the ascending aorta [LVOT-AR]) might become a useful tool for intra-procedural post-TAVI AR assessment. Clinicians are more familiar, however, with the classic categorical grading (trace/mild/moderate/severe), and might be reluctant to use a continuous parameter (LVOT-AR). Such reluctance may be an obstacle to the translation of quantitative VD from validation into clinical practice. Previously, we have reported on the inter-technique consistency and good correlation of intra-procedural VD and pre-discharge TTE (indirect comparison).13
A direct comparison of intra-procedural VD and echocardiography, however, has not yet been performed.2,14
Therefore, to evaluate post-TAVI AR, accurate post-TAVI AR assessment on VD must be validated against echocardiography during the procedure.
In the present study, we used the reproducible quantitative angiographic AR assessment, and transesophageal echocardiography (TEE) to evaluate the inter-technique relationship and the clinical impact of post-TAVI AR severity, in order to show the clinical robustness of angiographic method.
In addition to the intra-procedural direct comparison (angiography vs. intra-procedural TEE), we did indirect comparison (angiography vs. pre-discharge TTE) in the same patients.
Methods
TAVI
Seventy-four consecutive patients underwent TAVI with concomitant TEE, TTE and angiographic quantitative assessment of PVL after TAVI. All patients received general anesthesia with endotracheal intubation, and mechanical ventilator support. The indication for and strategy of TAVI were determined by the institutional heart team. This study was officially approved by the institutional review board of Yamaguchi University Hospital.
Echocardiography Protocol
All patients underwent TTE before TAVI and before discharge, while TEE was carried out during TAVI. Native aortic valve function and prosthetic valve function were evaluated in accordance with European Association of Echocardiography/American Society of Echocardiography guidelines15
and Valve Academic Research Consortium (VARC)-2.16
As done in a large clinical trial,3
we measured retrospectively only the circumferential extent (CE) of the regurgitant jet in short axis view for the post-TAVI AR assessment immediately after TAVI and before discharge.
Post-TAVI PVL severity was evaluated immediately after TAVI (≥10 min after either transcatheter heart valve [THV] implantation or final post-dilatation) and at discharge (median, 7 postoperative days) for evaluation of both direct comparison and indirect comparison. To accurately identify the inflow edge of the THV, simultaneous bi-plane (X-plane) mode was used with the iE33 xMatrix-DS ultrasound system with the X7-2+ TEE transducer (Philips Medical Systems, Bothell, WA, USA), and for the Vivid E9 with the 6VT-D TEE transducer (GE Healthcare, Chicago, IL, USA) for the post-TAVI PVL assessment (Figure 1A,B). To improve the reproducibility of CE analysis, we measured CE at the end of the E wave of transmitral flow (Figure 1C–E) both immediately after TAVI and before discharge. Subsequently, we graded the severity as following: none-trace, 0≤CE<5%; mild, 5%≤CE<10%; moderate, 10%≤CE<30%; and severe, CE ≥30%, based on VARC-2 with a minor modification.16
There was an excellent agreement between the 2 observers for post-TAVI AR grade (weighted κ 0.89, P<0.001).

All aortic root angiograms were performed during stop breathing; as regulated by the anesthetist, fixed catheter size (5 Fr), fixed contrast volume (20 mL) and contrast-injection speed (10 mL/s, 450 pound-force per square inch), were used for the cinefluoroscopy with the Artis Zee Ceiling-Mounted Systems (Siemens AG, Forchheim, Germany). Final angiogram was done ≥10 min after either THV implantation or final post-dilatation.
Assessment of Post-TAVI AR
Post-TAVI AR was quantified using contrast VD software (CAAS A-Valve 2.0.2 research version, Pie Medical Imaging, The Netherlands) that can calculate the ratio of the contrast time-density in the region of interest (ROI) to that in the ascending aorta (reference). In particular, we focused on the LVOT as an ROI, it was so called LVOT-AR (sub-aortic segment;
Figure 2). The methodology of this assessment is summarized in
Figure 2
and detailed elsewhere.10
All VD analysis was done retrospectively, blinded to the clinical outcomes and to echocardiographic severity.
Statistical Analysis
Continuous data are presented as mean±SD if normally distributed or as median (IQR) if non-normally distributed. Continuous variables were tested for normal distribution using the Shapiro-Wilk test and verified on histogram. Categorical variables are given as frequency and percentage. For continuous variables, Student’s t-test or Wilcoxon signed-rank test was used for between-group comparison, and for categorical variables, the chi-squared test was used.
Based on LVOT-AR 0.17, which was previously reported by our group, for the VD method10,17
or based on the VARC-2 cut-point16
for the echocardiography method, we divided the patients into 2 groups: (1) none-mild or (2) greater than mild. Subsequently we carried out a time-to-event analysis (Kaplan-Meier estimation) defining all-cause death and heart failure (HF) re-hospitalization up to 1 year as a composite end-point, and compared the 2 groups using log-rank test. On receiver operating characteristics (ROC) curve analysis, the cut-point was defined based on the highest sum of sensitivity and specificity. Correlation between the 2 modalities was examined using Pearson’s test, in which Pearson correlation coefficient values of 0–0.19, 0.2–0.39, 0.4–0.59, 0.6–0.79, and 0.8–1.0 indicate very weak, weak, moderate, strong, and very strong correlations, respectively.18
Statistical analysis was performed with JMP Pro 12.2.0 (SAS Institute, Cary, NC, US). Two-tailed P<0.05 was defined as statistically significant.
Results
Subjects
Seventy-four consecutive patients underwent TAVI using 52 Sapien XTs, 6, Sapien 3 s (Edwards Lifesciences, Irvine, CA, USA), 15 CoreValves, and 1 Evolut R (Medtronic, Minneapolis, MN, USA). Seventy-four echocardiograms immediately after TAVI, and 69 echocardiograms at discharge could be analyzed retrospectively, while 51 aortic root angiograms were analyzable for VD assessment (LVOT-AR). Median follow-up time was 366 days (IQR, 14–445 days) after TAVI. Of the 74 patients, 7 had died and 9 were re-hospitalized for HF ≤1 year after TAVI.
Echocardiographic Post-TAVI AR
Mean±SD %CE on intra-procedural TEE was 9.5±5.2, while that on pre-discharge TTE was 9.5±6.0. The prevalence of echocardiographic post-procedural PVL was as follows: none-trace, 19 (25.7%); mild, 24 (32.4%); and moderate, 31 (41.9%); while the prevalence of PVL at discharge was as follows: none-trace, 15 (21.7%); mild, 23 (33.3%); and moderate, 31 (45.0%). Two trace transvalvular leaks were seen immediately after TAVI, which were no longer present at pre-discharge assessment.
Tables 1,2
summarize the subject baseline clinical and echocardiographic characteristics stratified according to the severity of PVL on intra-procedural TEE (43 patients for %CE <10, 31 patients for %CE ≥10).
Table 1.
Baseline Subject Characteristics
| |
Total
(n=74) |
No-mild PVL
(n=43) |
Greater than mild PVL
(n=31) |
P-value |
| Age at procedure (years) |
85.9±5.3 |
85.5±5.6 |
86.3±5.1 |
0.5368 |
| Male |
25 (33.8) |
12 (27.9) |
13 (41.9) |
0.2081 |
| BMI (kg/m2) |
21.6±3.3 |
21.7±3.3 |
21.4±3.3 |
0.6676 |
| BSA (m2) |
1.4±0.2 |
1.4±0.2 |
1.4±0.2 |
0.5169 |
| Sinus rhythm |
64 (86.5) |
37 (86) |
27 (87.1) |
0.1561 |
| Chronic AF |
2 (2.7) |
0 (0) |
2 (6.5) |
| Pacemaker |
8 (10.8) |
6 (14) |
2 (6.5) |
| NYHA grade |
| I |
3 (4.1) |
0 |
3 (10) |
0.152 |
| II |
38 (51.4) |
25 (58.1) |
13 (43.3) |
| III |
29 (39.2) |
16 (37.2) |
13 (43.3) |
| IV |
3 (4.1) |
2 (4.7) |
1 (3.3) |
| HTN |
65 (87.8) |
37 (86) |
28 (90.3) |
0.5787 |
| DM |
19 (25.7) |
16 (37.2) |
3 (9.7) |
0.0075 |
| COPD |
21 (28.4) |
9 (21.4) |
12 (38.7) |
0.1069 |
| CKD |
59 (79.7) |
35 (81.4) |
24 (77.4) |
0.6747 |
| PAD |
18 (24.3) |
8 (18.6) |
10 (32.3) |
0.1768 |
| Prior BAV |
21 (28.4) |
11 (25.6) |
10 (32.3) |
0.5296 |
| Prior CABG |
5 (6.8) |
2 (4.7) |
3 (9.7) |
0.3954 |
| Prior MI |
6 (8.1) |
4 (9.3) |
2 (6.5) |
0.6576 |
| Prior stroke |
15 (20.3) |
11 (25.6) |
4 (12.9) |
0.1807 |
| Logistic EuroSCORE (%) |
11.9±7.4 |
12.3±8.6 |
11.6±5.6 |
0.6878 |
| STS-PROM (%) |
7.2±4.2 |
7.5±4.9 |
6.8±3 |
0.4927 |
Data given as mean±SD, median (IQR), or number (%). AF, atrial fibrillation; BAV, balloon aortic valvuloplasty; BMI, body mass index; BSA, body surface area; CABG, coronary artery bypass graft; CKD, chronic kidney disease; COPD, chronic obstructive pulmonary disease; DM, diabetes mellitus; EuroSCORE, European System for Cardiac Operative Risk Evaluation score; HTN, hypertension; MI, myocardial infarction; NYHA, New York Heart Association; PAD, peripheral artery disease; PVL, paravalvular leak; STS PROM, Society of Thoracic Surgeons Predicted Risk of Mortality.
Table 2.
Pre-Procedural Echocardiographic Parameters
| |
Total
(n=74) |
No-mild PVL
(n=43) |
Greater than mild PVL
(n=31) |
P-value |
| LVDd (mm) |
44.7±5.2 |
44.6±5.7 |
44.5±4.5 |
0.9488 |
| LVEF (%) |
63.3±13.7 |
62.5±14.6 |
64.4±12.9 |
0.5705 |
| EOA (cm2) |
0.6±0.2 |
0.6±0.1 |
0.6±0.2 |
0.1173 |
| Trans-AV PG (mmHg) |
52.3±18.1 |
49.1±18.2 |
55.3±16.4 |
0.1394 |
| Peak trans-AV velocity (m/s) |
4.6±0.8 |
4.5±0.8 |
4.8±0.7 |
0.0595 |
| LVMI (g/cm2) |
140.8±33.2 |
137.3±34.9 |
143.2±28.3 |
0.4439 |
| Greater than mild pre-TAVI AR |
12 (16.2) |
6 (14.0) |
6 (19.4) |
0.534 |
| Greater than mild pre-TAVI MR |
9 (12.2) |
6 (14.0) |
3 (9.7) |
0.5787 |
Data given as mean±SD, median (IQR), or number (%). AR, aortic regurgitation; AV, aortic valve; EOA, effective orifice area; LVDd, left ventricular diastolic dimension; LVEF, left ventricular ejection fraction; LVMI, left ventricular mass index; MR, mitral regurgitation; PG, pressure gradient; PVL, paravalvular leak; TAVI, transcatheter aortic valve implantation.
In addition to the %CE VARC-2 cut-point, ROC curve analyses were constructed to investigate whether another cut-point of %CE would be of better predictive value in the current subject group. Interestingly, %CE >9.8 immediately after TAVI and %CE >9.6 before discharge provided the highest sum of sensitivity and specificity in predicting the composite clinical end-point (Figure 3A,B). These results confirmed the clinical robustness of the reported VARC-2 cut-point of %CE ≥10. There was no significant difference in the prediction of clinical outcomes between TEE performed immediately after valve deployment and TTE performed before discharge (area under the ROC curve [AUC], 0.67 vs. 0.69, using the method reported by DeLong et al,19
P=0.74,
Figure 3C).
Post-TAVI AR Severity: Angiography vs. Echocardiography
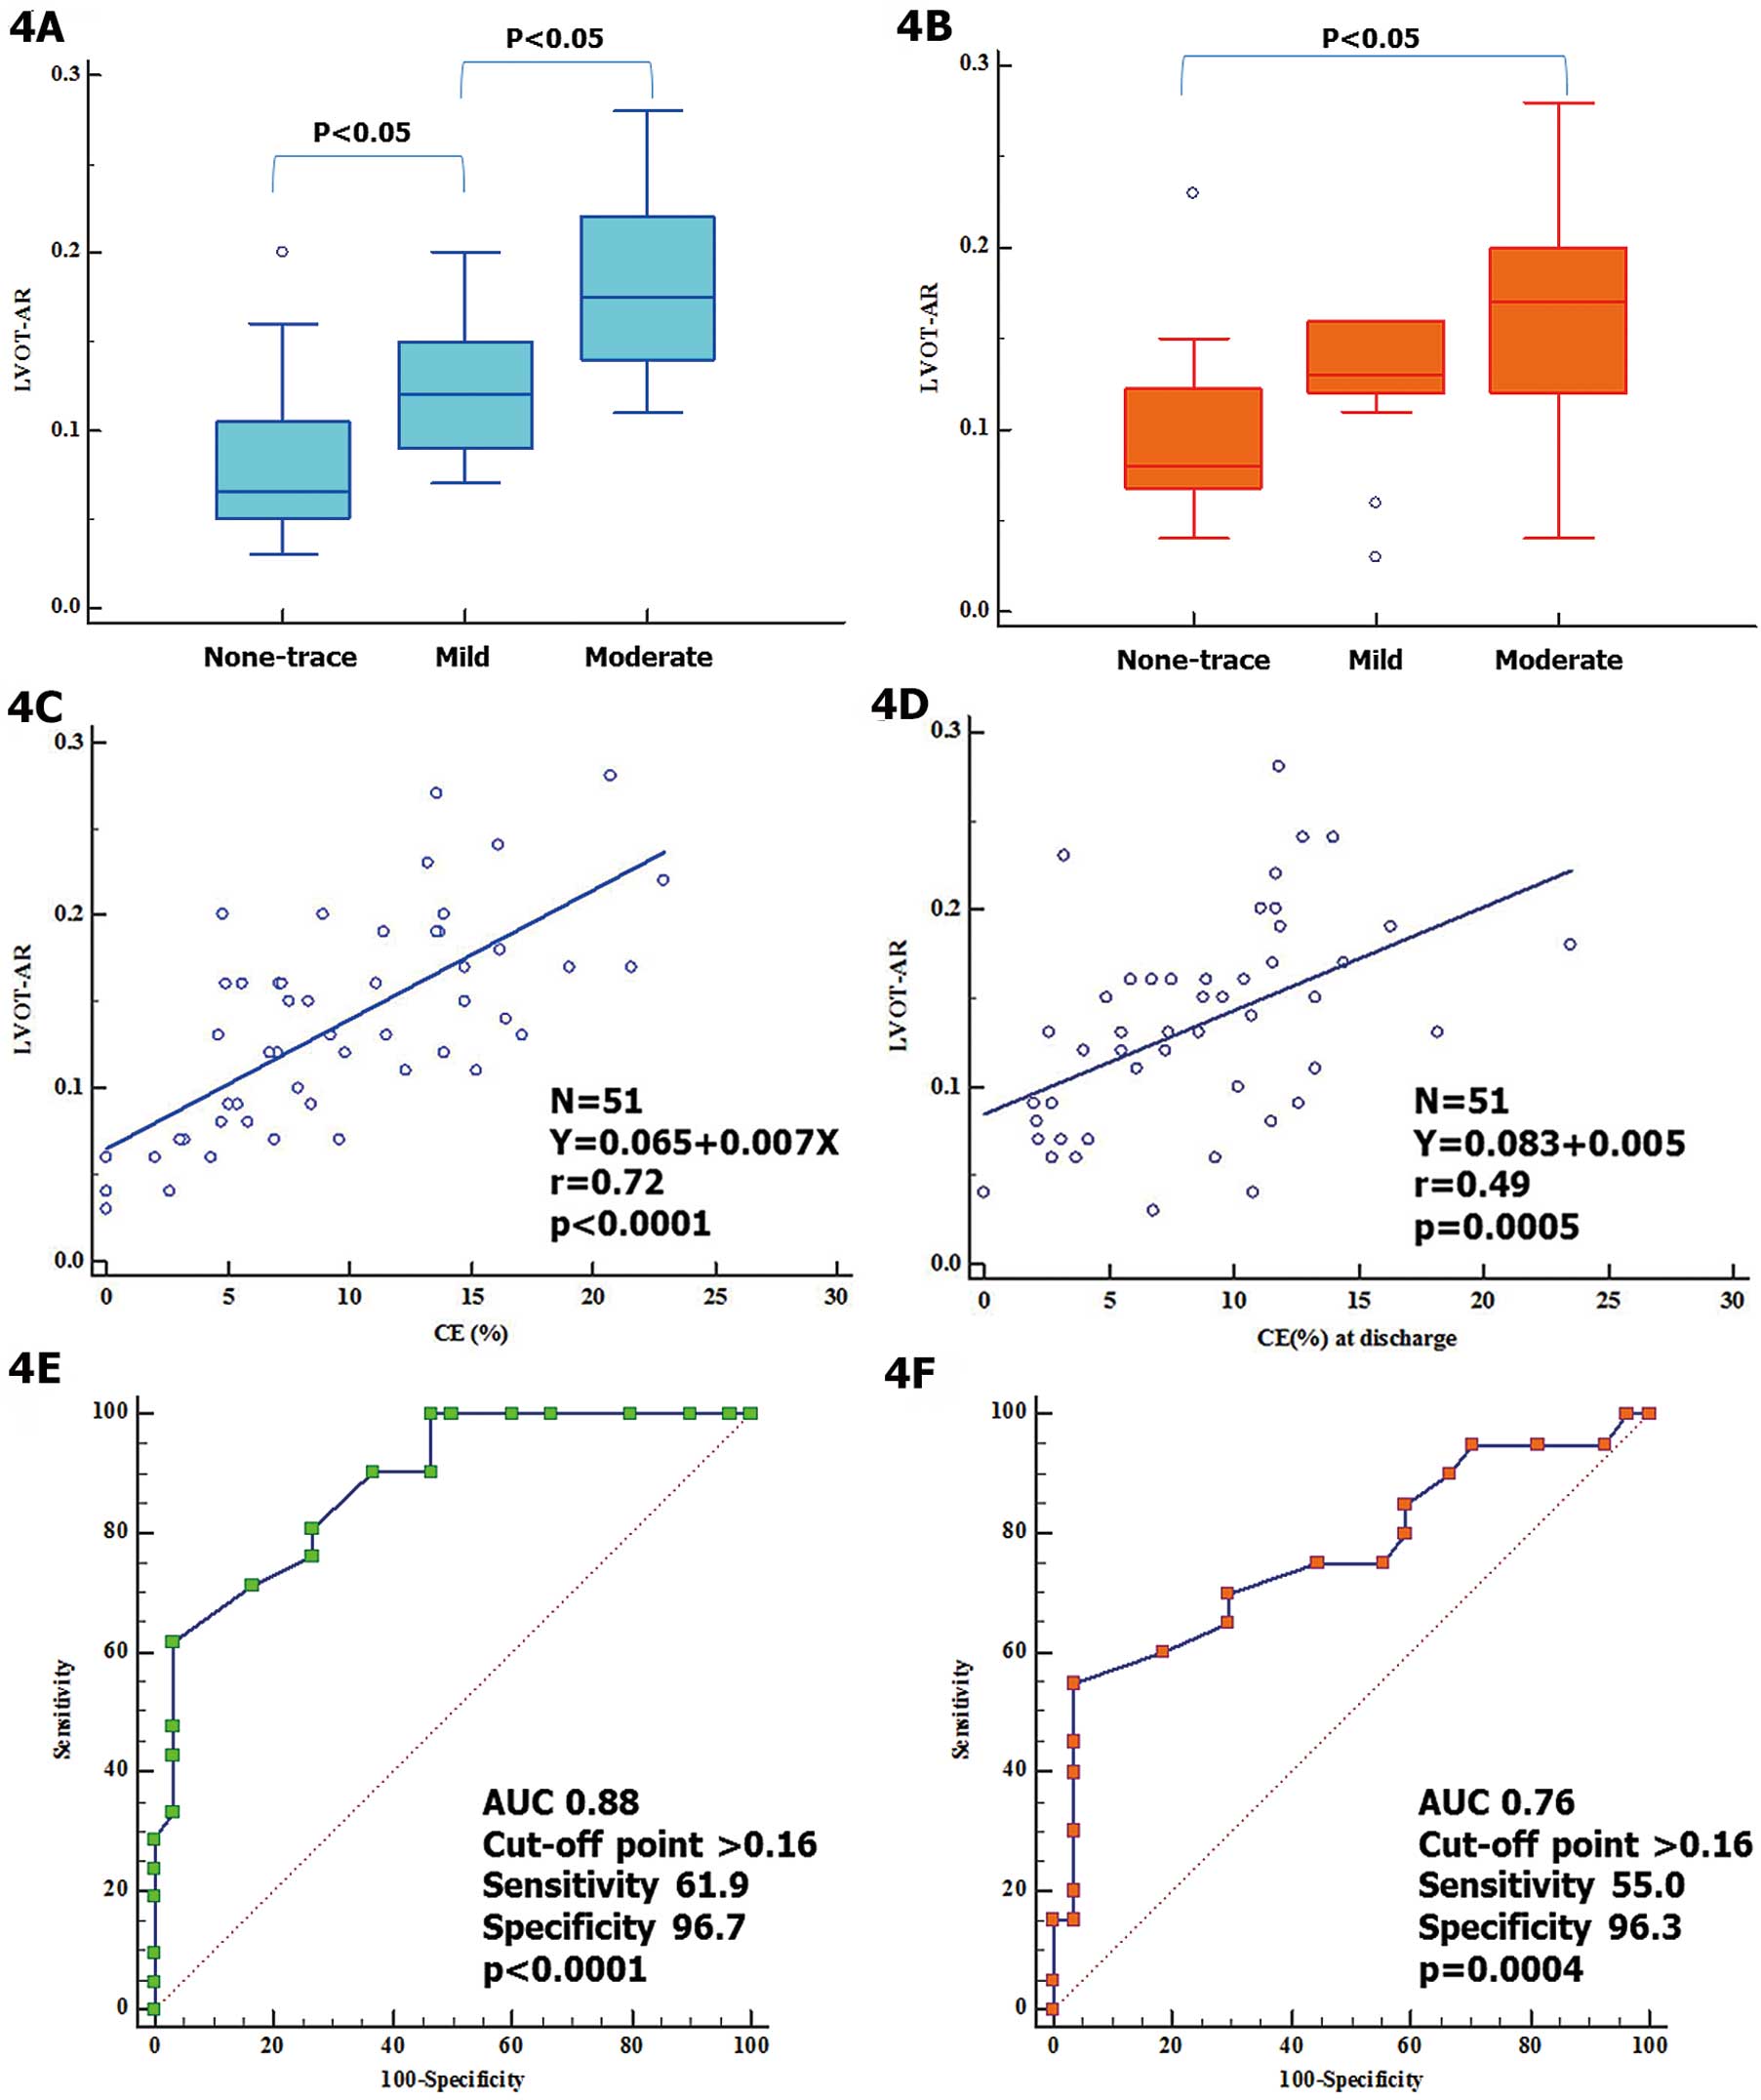
Fifty-one aortic root angiograms were analyzed using the VD method (LVOT-AR). Median LVOT-AR on the VD assessment was 0.13 (IQR, 0.09–0.17). Median LVOT-AR was 0.07 (IQR, 0.05–0.11), 0.12 (IQR, 0.09–0.15), and 0.17 (IQR, 0.15–0.22) in no-trace (n=12), mild (n=18), and moderate (n=21) PVL, respectively, as defined by %CE on intra-procedural TEE (Figure 4A), while it was 0.08 (IQR, 0.07–0.12), 0.13 (IQR, 0.12–0.16), and 0.17 (IQR, 0.12–0.20) in no-trace (n=13), mild (n=14), and moderate (n=20) PVL, respectively, as defined by %CE on pre-discharge TTE (Figure 4B). There was a strong correlation between LVOT-AR and %CE on intra-procedural TEE (r=0.72, P<0.0001,
Figure 4C), while there was a moderate correlation between LVOT-AR and %CE on pre-discharge TTE (r=0.49, P=0.0005,
Figure 4D). On ROC curve analysis, LVOT-AR >0.16 corresponded to a greater than mild AR on echocardiography performed either immediately after TAVI (AUC, 0.88; P<0.0001,
Figure 4E) or before discharge (AUC, 0.76; P=0.0004,
Figure 4F). Furthermore, on ROC curve analysis to investigate whether another cut-point of LVOT-AR would be of better predictive value in the current subjects, LVOT-AR >0.18 provided the highest sum of sensitivity and specificity in predicting the composite clinical end-point. Interestingly, LVOT-AR >0.17, a previously reported clinically relevant cut-point,10,13,17
also provided a similar sensitivity and specificity as LVOT-AR >0.18. Therefore LVOT-AR >0.17 was confirmed as a clinically relevant cut-point, and was used for the present time-to-event analysis.
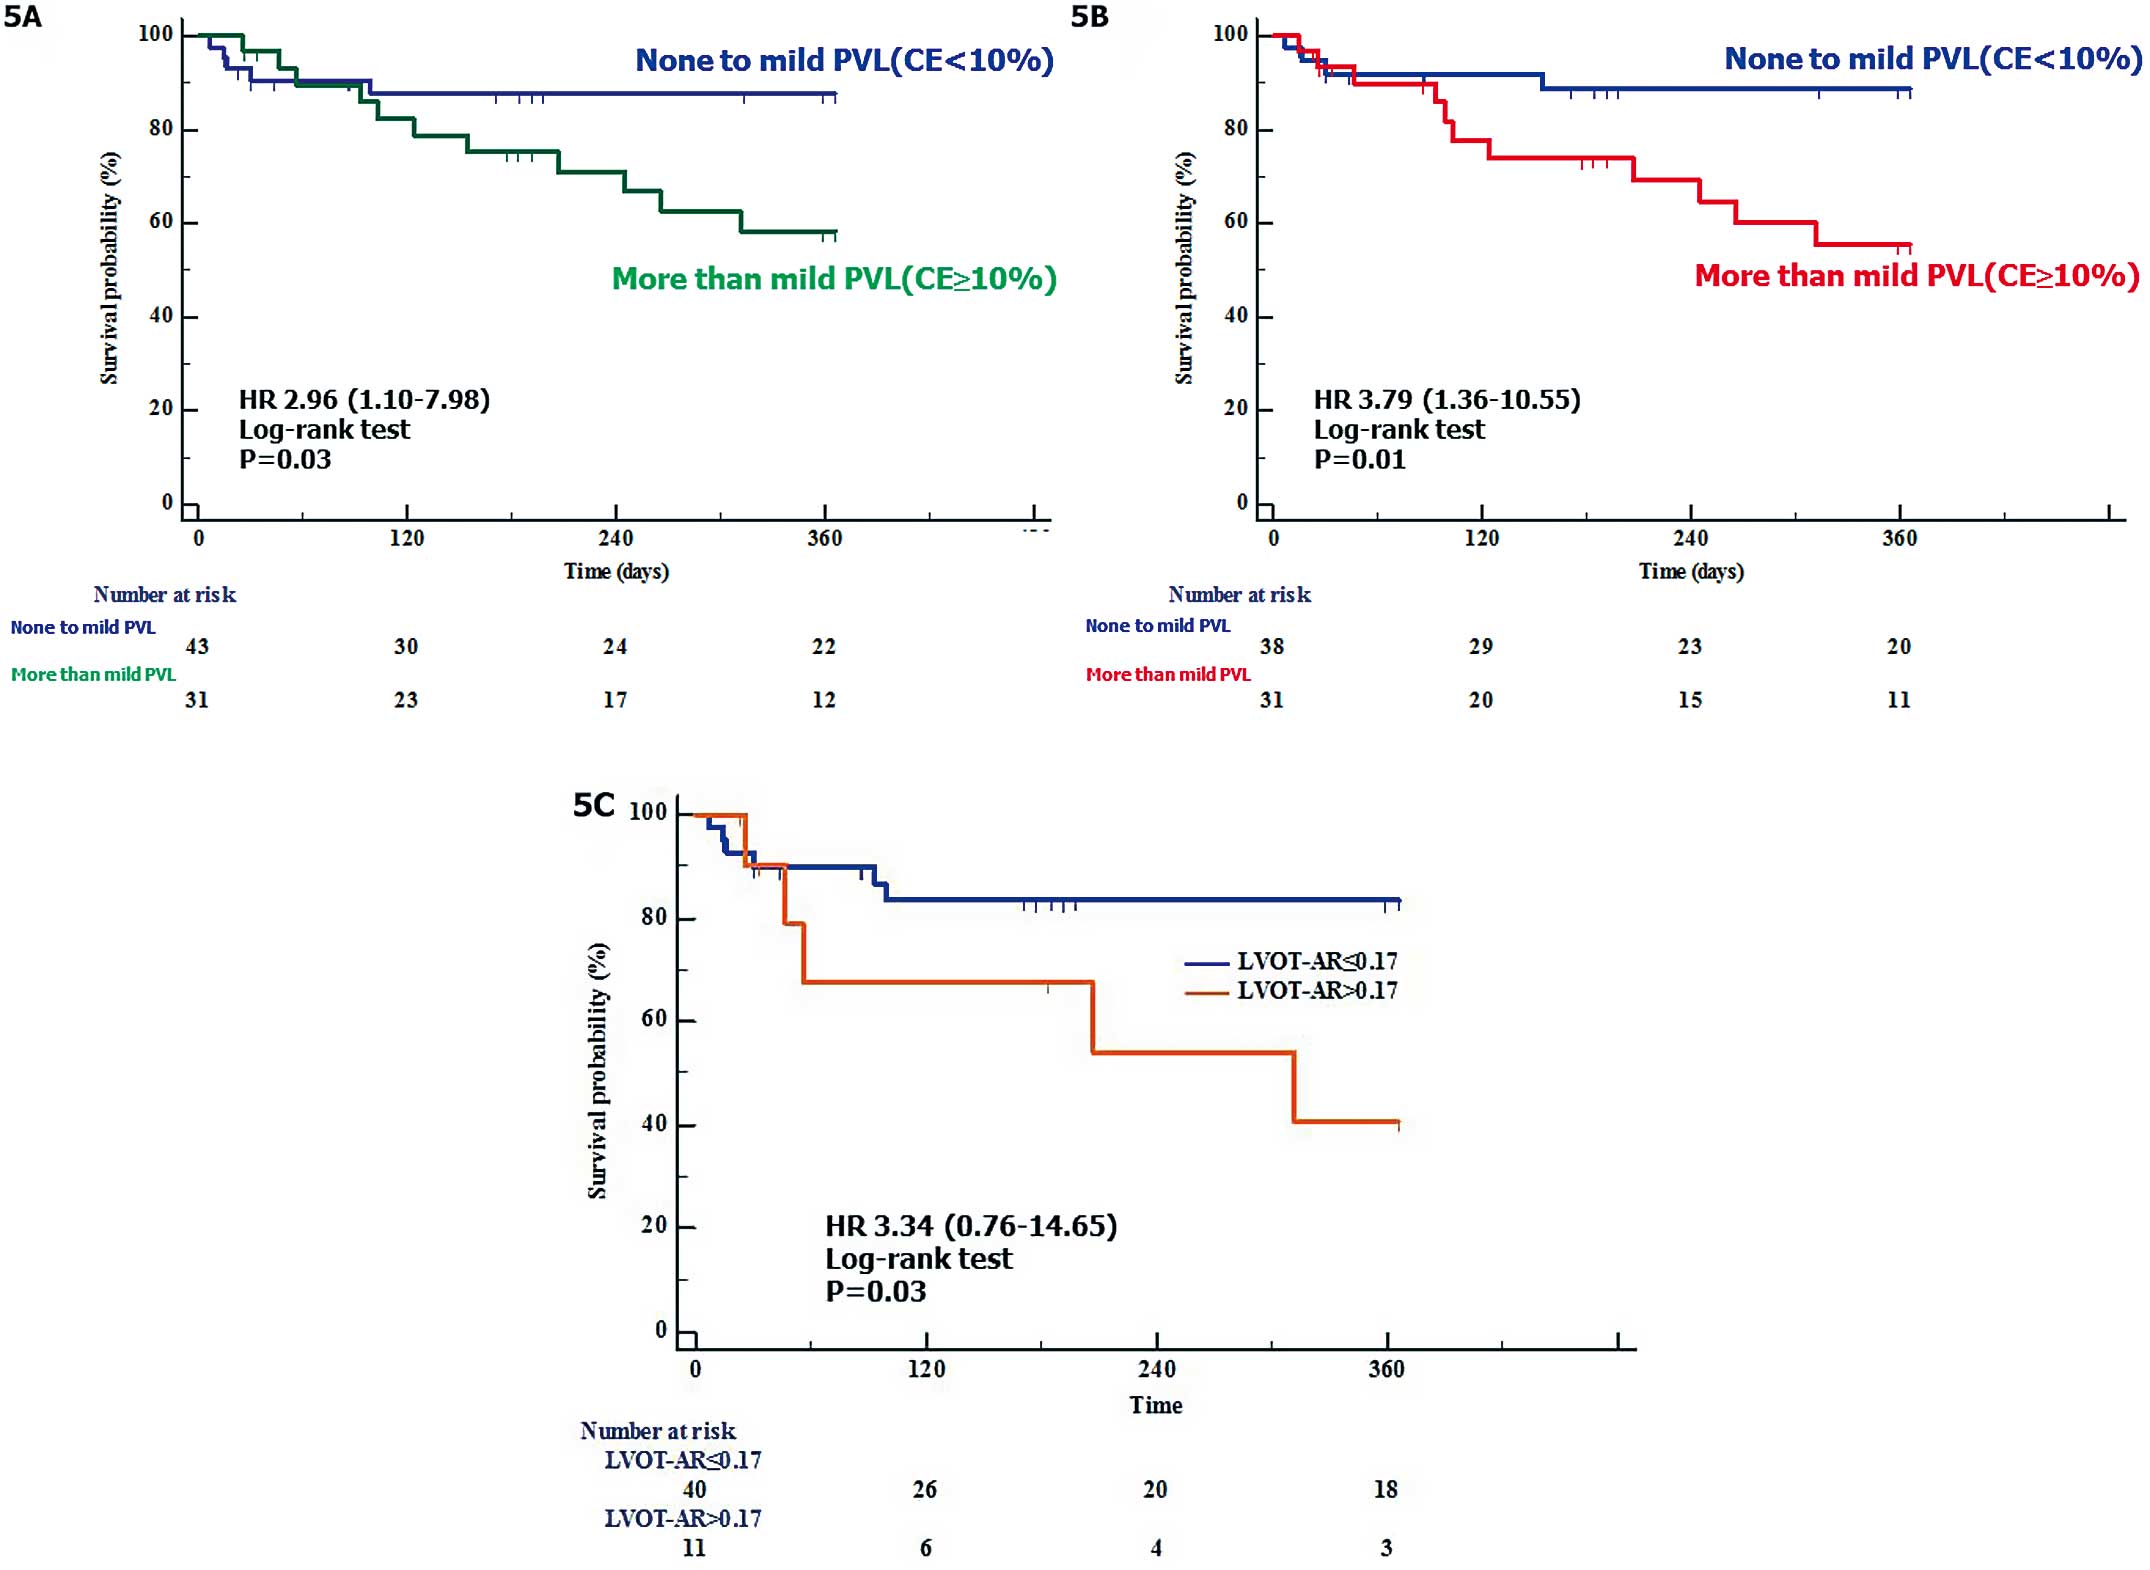
The risk of the composite end-point of all-cause death or re-hospitalization due to HF was higher in patients with greater than mild PVL (%CE ≥10) compared with patients with no-mild PVL (%CE <10) on intraprocedural TEE (41.5% vs. 12.4%; hazard ratio [HR], 2.96; 95% CI: 1.10–7.98, P=0.03;
Figure 5A), as well on pre-discharge TTE (44.5% vs. 11.2%; HR, 3.79; 95% CI: 1.36–10.55, P=0.01
Figure 5B).
Clinical Impact of Angiographic Post-TAVI AR (LVOT-AR)
Based on the LVOT-AR >0.17 cut-point, we divided the 51 patients into 2 groups: LVOT-AR ≤0.17, n=40; LVOT-AR >0.17, n=11. The LVOT-AR >0.17 group had a significantly increased risk of the composite clinical end-point at 1 year, compared with the LVOT-AR≤0.17 group (59.5% vs. 16.6%; HR, 3.34; 95% CI: 0.76–14.65, P=0.03
Figure 5C).
Discussion
The present findings are as follows: (1) a strong correlation between intra-procedural angiographic and echocardiographic PVL severity was documented; (2) LVOT-AR>0.17, which was previously reported as a vital prognostic marker, was also confirmed to be clinically robust in the present subjects; and (3) the present echocardiographic PVL assessment was reproducible and confirms the clinical robustness of the VARC-2 cut-point.
The present study is the first to carry out a direct comparison of intra-procedural angiographic and echocardiographic post-TAVI AR severity, confirming a strong correlation between the 2 modalities, and demonstrating the clinical impact and clinical robustness of this angiographic method.
The intra-procedural direct comparison tended to produce a numerically better correlation between the 2 modalities, compared with the indirect comparison. The intra-procedural direct comparison had better discrimination between mild and moderate echocardiographic post-TAVI AR, compared with the indirect comparison. LVOT-AR 0.17 corresponded to greater than mild post-TAVI AR, and the median LVOT-AR, to moderate echocardiographic post-TAVI AR. Therefore, only greater than mild post-TAVI AR is potentially associated with late mortality; not mild post-TAVI AR. There was a small difference in the prognostic cut-point of LVOT-AR between the present and previous studies. This difference could be due to differences in the patients studied, the end-point, and/or the TAVI procedure itself. Based on a number of studies, including this one, we can state that LVOT-AR >0.17 corresponds to an echocardiographic greater than mild post-TAVI AR, and that LVOT-AR >0.17 is also a potential vital prognostic marker,10,13,17
regardless of differences in background.
As done in a large clinical trial,3
we used only the measurement of the regurgitant jet CE on echocardiography. Although VARC-2 and guidelines recommend the integrative approach to assess the post-TAVI AR severity, the issues of echocardiographic assessment being semi-quantitative and less reproducible have been noted in the literature.2,15,16
Furthermore, several reports have noted the lower sensitivity and feasibility of echocardiographic assessment.2,7,20
Because of this limitation, we did not use other echocardiographic parameters (pressure-half time and diastolic flow reversal) in the assessment of inter-technique consistency, and used only the feasible and reproducible method. The CE measurement of regurgitant jet at the proximal edge of the THV may overestimate post-TAVI AR severity, compared with the measurement at the native annulus level.2,14
In the present study multiple (>1) PVL jets were identified in many (35/74) patients. Multiple PVL jet measurement may also lead to overestimation of post-TAVI AR severity.2
These factors probably led to the high prevalence of greater than mild post-TAVI AR noted in the present study. Despite this potential overestimation, the present echocardiographic assessment was simple, reproducible and strongly correlated with VD assessment, thereby indicating that it would be a reliable tool for intra-procedural post-TAVI AR assessment.
Change in post-TAVI AR severity was identified in almost 40% of the present patients in the short term, between the procedure and pre-discharge assessment (median, 7 postoperative days). This may have been caused by differences in spatial/temporal resolution, detection and localization of PVL between intra-procedural TEE and pre-discharge TTE,2
and/or the individual hemodynamic status. Comparison of post-TAVI AR grade between intra-procedural TEE and pre-discharge TTE cannot be done directly, because PVL might be improving, stable, or deteriorating due to either elastic recoil or self-expansion of the THV.
Recently, Miyazaki et al and Abdelghani et al, in an experimental study, reported excellent agreement between VD and regurgitation fraction evaluated in an in vitro setting.11,12,21,22
Therefore, VD assessment (LVOT-AR) may play a central role in TAVI procedural guidance in the context of the minimalist TAVI approach. We believe that this intra-procedural direct comparison between the 2 modalities would facilitate the adoption of VD assessment into clinical practice.
Study Limitations
This study is based on a retrospective data analysis, a small number of patients and a single-center assessment. In addition, the feasibility of the VD method was only modest, given that angiographic assessment was available for only 51/74 patients (68.9%). This, however, was better than in our previous report, because we have started to implement a dedicated angiographic image acquisition protocol. By identification of the optimal angiographic projection for VD assessment on pre-procedural multi-slice computed tomography screening, we can achieve an almost perfect analyzability without increase of X-ray exposure and contrast volume during procedure.23
Second, it was not possible to carry out multivariate analysis to evaluate the clinical impact of post-TAVI AR. Multivariate analysis was not meaningful because of the small number of cases and events. Third, this study revealed that the angiographic assessment and the echocardiographic assessment would complement each other during procedure; however, this study did not include the hemodynamic indices, called “AR index”. Several hemodynamic indices have been increasingly described but tend to be used as prognostic rather than diagnostic tools. This is primarily due to their inability to differentiate transvalvular from paravalvular regurgitation and to their binary qualitative, rather than quantitative, character. Furthermore, these indices incorporate other markers of adverse prognosis that are not related to the degree of PVL, such as stiffness of the aorta and compliance of the LV.24
In further studies, prospective data, such as AR index, should be collected to complete the intra-procedural multi-modality validation.
Conclusions
VD (LVOT-AR) has good intra-procedural inter-technique consistency and clinical robustness. Greater than mild post-TAVI AR, but not mild post-TAVI-AR, is associated with late mortality.
Acknowledgments
This study was supported by the Japan Society for the Promotion of Science. We thank the heart team of Yamaguchi University Hospital for their collaboration.
Disclosures
The authors declare no conflicts of interest.
References
- 1.
Athappan G, Patvardhan E, Tuzcu EM, Svensson LG, Lemos PA, Fraccaro C, et al. Incidence, predictors, and outcomes of aortic regurgitation after transcatheter aortic valve replacement: Meta-analysis and systematic review of literature. J Am Coll Cardiol 2013; 61: 1585–1595.
- 2.
Pibarot P, Hahn RT, Weissman NJ, Monaghan MJ. Assessment of paravalvular regurgitation following TAVR: A proposal of unifying grading scheme. JACC Cardiovasc Imaging 2015; 8: 340–360.
- 3.
Kodali S, Pibarot P, Douglas PS, Williams M, Xu K, Thourani V, et al. Paravalvular regurgitation after transcatheter aortic valve replacement with the Edwards sapien valve in the PARTNER trial: Characterizing patients and impact on outcomes. Eur Heart J 2015; 36: 449–456.
- 4.
Colli A, Besola L, Salizzoni S, Gregori D, Tarantini G, Agrifoglio M, et al. Does pre-existing aortic regurgitation protect from death in patients who develop paravalvular leak after TAVI? Int J Cardiol 2016; 233: 52–60.
- 5.
Sellers RD, Levy MJ, Amplatz K, Lillehei CW. Left retrograde cardioangiography in acquired cardiac disease: Technic, indications and interpretations in 700 cases. Am J Cardiol 1964; 14: 437–447.
- 6.
Hahn RT, Pibarot P, Weissman NJ, Rodriguez L, Jaber WA. Assessment of paravalvular aortic regurgitation after transcatheter aortic valve replacement: Intra-core laboratory variability. J Am Soc Echocardiogr 2015; 28: 415–422.
- 7.
Abdelghani M, Ren B, Spitzer E, Tateishi H, Jonker H, Geleijnse ML, et al. A granular approach to improve reproducibility of the echocardiographic assessment of paravalvular regurgitation after TAVI. Int J Cardiovasc Imaging 2016; 32: 1519–1526.
- 8.
Abdelghani M, Soliman OI, Schultz C, Vahanian A, Serruys PW. Adjudicating paravalvular leaks of transcatheter aortic valves: A critical appraisal. Eur Heart J 2016; 37: 2627–2644.
- 9.
Schultz CJ, Slots TL, Yong G, Aben JP, Van Mieghem N, Swaans M, et al. An objective and reproducible method for quantification of aortic regurgitation after TAVI. EuroIntervention 2014; 10: 355–363.
- 10.
Tateishi H, Campos CAM, Abdelghani M, Leite RS, Mangione JA, Bary L, et al. Video densitometric assessment of aortic regurgitation after transcatheter aortic valve implantation: Results from the Brazilian TAVI registry. EuroIntervention 2016; 11: 1409–1418.
- 11.
Miyazaki Y, Abdelghani M, de Boer ES, Aben JP, van Sloun M, Suchecki T, et al. A novel synchronized diastolic injection method to reduce contrast volume during aortography for aortic regurgitation assessment: In-vitro experiment of a transcatheter heart valve model. EuroIntervention 2017; 13: 1288–1295.
- 12.
Abdelghani M, Miyazaki Y, de Boer ES, Aben JP, van Sloun M, Suchecki T, et al. Videodensitometric quantification of paravalvular regurgitation of a transcatheter aortic valve: In vitro validation. EuroIntervention 2018; 13: 1527–1535.
- 13.
Abdelghani M, Tateishi H, Miyazaki Y, Cavalcante R, Soliman OII, Tijssen JG, et al. Angiographic assessment of aortic regurgitation by video-densitometry in the setting of TAVI: Echocardiographic and clinical correlates. Catheter Cardiovasc Interv 2017; 90: 650–659.
- 14.
Mihara H, Shibayama K, Jilaihawi H, Itabashi Y, Berdejo J, Utsunomiya H, et al. Assessment of post-procedural aortic regurgitation after TAVR. JACC Cardiovasc Imaging 2015; 8: 993–1003.
- 15.
Zamorano JL, Badano LP, Bruce C, Chan KL, Gonçalves A, Hahn RT, et al. EAE/ASE recommendations for the use of echocardiography in new transcatheter interventions for valvular heart disease. Eur Heart J 2011; 32: 2189–2214.
- 16.
Kappetein AP, Head SJ, Genereux P, Piazza N, van Mieghem NM, Blackstone EH, et al. Updated standardized endpoint definitions for transcatheter aortic valve implantation: The Valve Academic Research Consortium-2 consensus document. J Thorac Cardiovasc Surg 2013; 145: 6–23.
- 17.
Tateishi H, Abdelghani M, Cavalcante R, Miyazaki Y, Campos CM, Collet C, et al. The interaction of de novo and pre-existing aortic regurgitation after TAVI: Insights from a new quantitative aortographic technique. EuroIntervention 2017; 13: 60–68.
- 18.
Campbell MJ, Swinscow TDV. Statistics at square one, 11th edition. Chichester, UK: Wiley-Blackwell/BMJ Books, 2009.
- 19.
DeLong ER, DeLong DM, Clarke-Pearson DL. Comparing the areas under two or more correlated receiver operating characteristic curves: A nonparametric approach. Biometrics 1988; 44: 837–845.
- 20.
Abdelghani M, Tateishi H, Spitzer E, Tijssen JG, de Winter RJ, Soliman OII, et al. Echocardiographic and angiographic assessment of paravalvular regurgitation after TAVI: Optimizing inter-technique reproducibility. Eur Heart J Cardiovasc Imaging 2017; 18: 697–706.
- 21.
Mol A, Rutten MC, Driessen NJ, Bouten CV, Zund G, Baaijens FP, et al. Autologous human tissue-engineered heart valves: Prospects for systemic application. Circulation 2006; 114(1 Suppl): I152–I158.
- 22.
Schampaert S, Pennings KA, van de Molengraft MJ, Pijls NH, van de Vosse FN, Rutten MC. A mock circulation model for cardiovascular device evaluation. Physiol Meas 2014; 35: 687–702.
- 23.
Tateishi H, Miyazaki Y, Okamura T, Modolo R, Abdelghani M, Soliman OII, et al. Role of computed tomography in planning the appropriate X-ray gantry for quantitative aortography of post-transcatheter aortic valve implantation regurgitation. Circ J 2018; 82: 1943–1950.
- 24.
Abdelghani M, Soliman OII, Schultz C, Vahanian A, Serruys PW. Adjudicating paravalvular leaks of transcatheter aortic valves: A critical appraisal. Eur Heart J 2016; 37: 2627–2644.