Tentative Screening Criteria for Short QT Interval in Children and Adolescents
Article ID: CJ-18-0213

Details
Article ID: CJ-18-0213
Background: While the prevalence of short QT syndrome (SQTS) in children and adolescents is low, early detection is important because SQTS can cause life-threatening arrhythmia. The aim of this study was to determine the tentative screening criteria for short QT interval in children and adolescents.
Methods and Results: A total of 75,040 digitally stored electrocardiograms (ECG) of participants in a school-based ECG screening program were obtained between 2009 and 2013 in Kagoshima, Japan. ECG with a corrected QT interval (QTc) below the 10th percentile for each grade and sex were selected: 2,581 first graders (M/F, 1,296/1,285); 2,792 7th graders (M/F, 1,400/1,392); and 2018 10th graders (M/F, 979/1,039). Three consecutive QT/RR intervals were manually measured and corrected using Bazett’s formula. The prevalence of SQTS was estimated at 1/30,000–1/10,000, which was set compared with the prevalence of long QT syndrome, then the screening points of the prevalence of short QT interval were assumed to be between 1/5,000 and 1/2,000 to exclude the possibility of false negative. We obtained the following tentative criteria based on frequency distribution charts: 325, 315 and 305 ms for male 1st, 7th and 10th graders, respectively; and 320 ms for female 1st, 7th, and 10th graders.
Conclusions: For primary SQTS screening of children and adolescents, the QTc values for short QT interval should be adapted according to grade and sex.
Short-QT syndrome (SQTS) is a rare inherited disorder characterized by abnormally shortened cardiac repolarization. SQTS is associated with atrial or ventricular fibrillation and a propensity for cardiac arrest.1–4 Early recognition of SQTS in the young may prevent tragic events such as sudden cardiac death.
Patients with SQTS typically have a short corrected QT interval (QTc) <300 ms,1 but symptomatic patients have been described with a wide range of QTc.2–4 For this reason, relevant guidelines recommend different cut-offs: <390 ms according to the American Heart Association in 2009;5 <380 ms according to the European Society of Cardiology in 2010;6 ≤330 ms according to the Heart Rhythm Society in 2013;7 and ≤320 ms according to the Seattle criteria published in 2013.8 A recent recommendation does not mention a cut-off for short QT interval and instead proposes that short QT interval be investigated only in the context of relevant clinical markers.9
The rarity of SQTS is one of the reasons for the existence of different recommended cut-offs for short QTc. In a large study in apparently healthy people aged 14–35 years, the prevalence of QTc <320 ms was 0.14% (26 of 18,825 subjects; 1/724).10 While the largest series of patients with SQTS studied to date included fewer than 100 patients,2,4 reports based on the International Long QT Syndrome (LQTS) Registry included >3,000 patients.11–13 Thus, the prevalence of SQTS could be estimated at <1/30 of that of LQTS. Given, however, that SQTS was added to the list of inherited arrhythmias only 2 decades ago, its reported prevalence is expected to increase in the future.
A school-based electrocardiographic screening program for 1st (6-year-old), 7th (12-year-old), and 10th (15-year-old) graders has been conducted in Japan since 1994.13,14 This screening program has already detected a case of SQTS,15 and the probability of diagnosing LQTS was also determined using the data from the program: 1/3,298 in the 1st and 1/988 in the 7th graders.16
The aim of the present study was therefore to determine the tentative screening criteria of short QT interval in children and adolescents with manually measured QTc, using data obtained in the screening program conducted in Kagoshima City, Japan.
The electrocardiograms (ECG) included in the present study were selected from a database of ECG of 75,040 participants evaluated in the screening program in Kagoshima City, Japan, between 2009 and 2013. The process of identifying cardiovascular disease in the school-based screening program in Kagoshima is described in detail elsewhere.14 In brief, the process consisted of 3 steps of examination: the 1st screening, and 2nd and 3rd examinations. In the 1st screening, students underwent 12-lead resting ECG and their parents were asked to fill out questionnaires, including written informed consent to participate.14
ECG in the Present StudyIn the present study, the ECG from the 1st screening were used. ECG were recorded at the schools using a portable PC-based system (Fukuda Denshi, Tokyo, Japan) at a speed of 25 mm/s, a sampling rate of 500 Hz, and a bandwidth of 0.5–35 Hz. Each ECG was recorded by authorized technicians with supervisors at each recording. ECG were processed using a 12-lead ECG analysis program (S2 Version; Fukuda Denshi) based on an international standard from the International Electrotechnical Commission (IEC 60601-2-25).17 This study was approved by the Ethics Committee of the National Hospital Organization Kagoshima Medical Center.
QT and RR Interval MeasurementBased on the data obtained by automatic measurement, ECG with QTc ≤10th percentile for each sex and grade were identified. ECG showing rhythm disturbance of the P wave (wandering pacemaker and junctional rhythm), 2nd- and 3rd-degree atrioventricular block, intraventricular conduction disturbance (complete bundle branch block or Wolff-Parkinson-White syndrome), or premature beats (atrial or ventricular) were excluded.14 ECG showing the presence of Q waves in lead V1 and that of ST depression and/or an inverted T wave in leads V5 and V6 were also excluded.14
QT/RR intervals were manually measured by 1 author (D.H.). QT intervals of 3 consecutive beats were measured from the onset of the Q wave to the end of the T wave in lead V5 using the tangent method.18 QT/RR data for each of the 3 consecutive beats were corrected using Bazett’s formula. The mean of the 3 consecutive QTc was used. We chose to use Bazett’s formula rather than Fridericia’s formula to correct the QT interval because the distribution obtained using Bazett’s formula provided a better representation of outliers for each grade and sex, especially in 7th and 10th graders (Figures S1–S3).
Tentative Screening CriteriaThe tentative screening criteria were developed for the estimated prevalence of SQTS, which was deduced based on the following facts and assumptions: (1) the probability of diagnosing long QT syndrome in 7th graders is approximately 1/1,000;16 (2) the number of patients with SQTS in the large series of articles2,4 was <1/30 of that with LQTS;11–13 and (3) the exact number of patients with SQTS may be larger in future than now, because <20 years has passed since the first report.1 Thus, the prevalence of SQTS was estimated to be between 1/30,000 and 1/10,000 in young subjects. To exclude the possibility of false negative results when screening subjects with SQTS, we assumed that the prevalence of short QT interval was between 1/5,000 and 1/2,000.
Statistical AnalysisTo determine the reliability of manually measured QT intervals, one of the coauthors (M.Y.) performed the same measurements in 400 randomly selected ECG included in the present study, and inter-observer concordance between the measurements performed by the 2 authors (D.H. and M.Y.) was assessed using Bland-Altman plot (Figure 1). The difference between measurements performed by the 2 authors was 0.21±7.21 ms (P=0.55). All other manual measurements of QT interval were performed by 1 author (D.H.). Statistical analysis was performed using SPSS version 24.0 for Mac (SPSS, Chicago, IL, USA). Two-tailed P<0.05 was considered statistically significant.
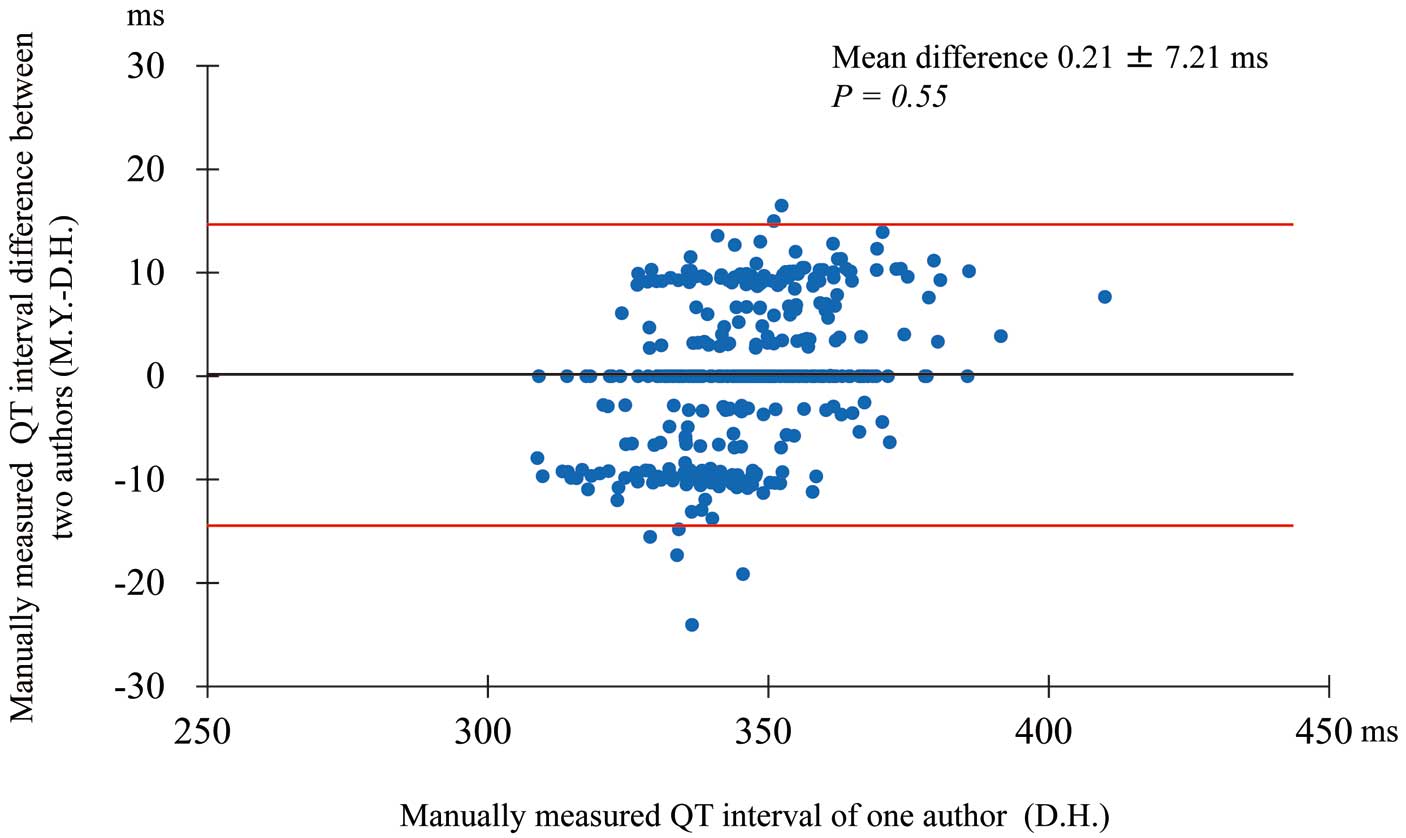
Bland-Altman plot of inter-observer agreement for manually measured QT interval on electrocardiogram. Mean difference, 0.21±7.21 ms; P=0.55. Red lines, limits of agreement; mean±(1.96×SD).
A total of 75,040 subjects participated in the screening program, including 26,518 1st graders (M/F, 13,384/13,134); 28,072 7th graders (M/F, 14,038/14,034); and 20,450 10th graders (M/F, 9,884/10,566). The descriptive data for the distribution of values obtained by automatic measurement are listed in Table 1. The QTc corresponding to the 10th percentile (i.e., a prevalence of 1/10) for each grade and sex are also included in Table 1. A final total of 7,391 subjects with manually measured QT interval were included in the analysis after excluding inadequate ECG. We determined the differences in QT interval and QTc between manual and automatic measurement. In each group, the QT interval and QTc obtained using manual measurement were smaller than those obtained using automatic measurement (Table S1). The frequency distribution charts of QTc derived from manual measurements for subjects with shortest QTc are provided in Figures 2,3, which also indicate the approximate QTc corresponding to a prevalence of short QT interval of 1/5,000 and 1/2,000. A more detailed view of tentative QTc screening values for a specific prevalence of short QT interval is provided in Table 2. The representative ECG of the subjects with the smallest QTc (Figures 4,5) were characterized by significantly sharper T waves with symmetric shape. According to the prevalence and frequency distribution charts, the tentative QTc values to be used in screening for short QT interval were estimated at 325, 315, and 305 ms in male 1st, 7th, and 10th graders, respectively; and at 320 ms in female 1st, 7th, and 10th graders. When using these tentative screening values, the prevalence of short QT interval was 1/2,230, 1/4,679, and 1/2,471 in male 1st, 7th, and 10th graders, respectively; and 1/2,627, 1/4,678, and 1/1,509 in female 1st, 7th, and 10th graders, respectively.
| Variable | 1st graders | 7th graders | 10th graders | |||
|---|---|---|---|---|---|---|
| Male | Female | Male | Female | Male | Female | |
| No. subjects | 13,384 | 13,134 | 14,038 | 14,034 | 9,884 | 10,566 |
| Heart rate (beats/min) | 80±10 | 82±10 | 75±11 | 79±12 | 67±12 | 72±12 |
| QT interval (ms) | 366±20 | 362±20 | 374±24 | 370±24 | 385±29 | 380±27 |
| Mean QTc (ms1/2) | 422±18 | 423±18 | 417±20 | 423±19 | 405±22 | 414±20 |
| 10th percentile QTc (ms1/2) | 399 | 400 | 391 | 399 | 377 | 389 |
Data given as mean±SD. QTc, QT interval corrected using Bazett’s formula.
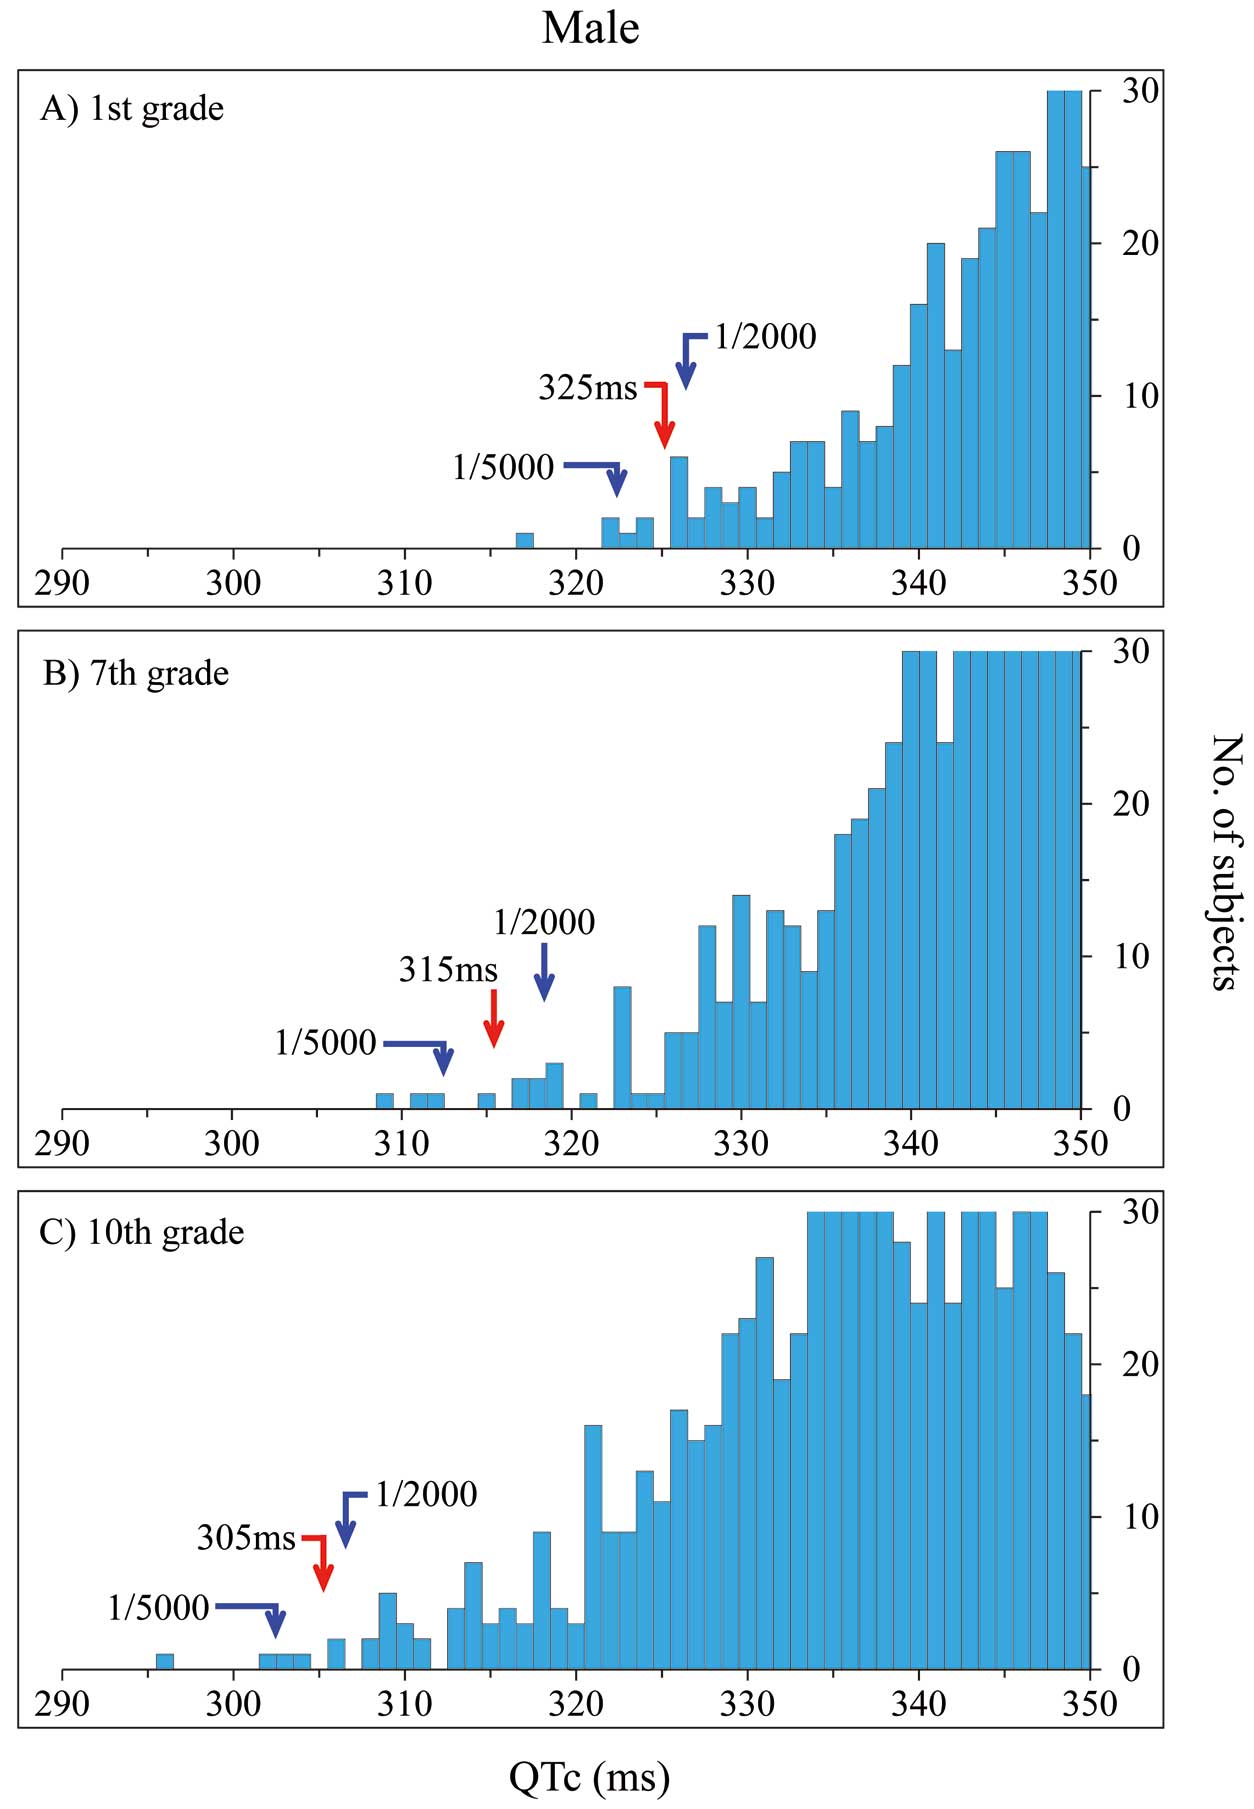
Frequency distribution chart of shortest corrected QT interval (QTc; <350 ms) derived from manual measurements in boys: (A) 1st graders (n=334); (B) 7th graders (n=214); (C) 10th graders (n=509). Blue arrows, QTc corresponding to a prevalence of short QT interval of 1/5,000 and 1/2,000. Red arrow, point of tentative screening value of short QT interval.
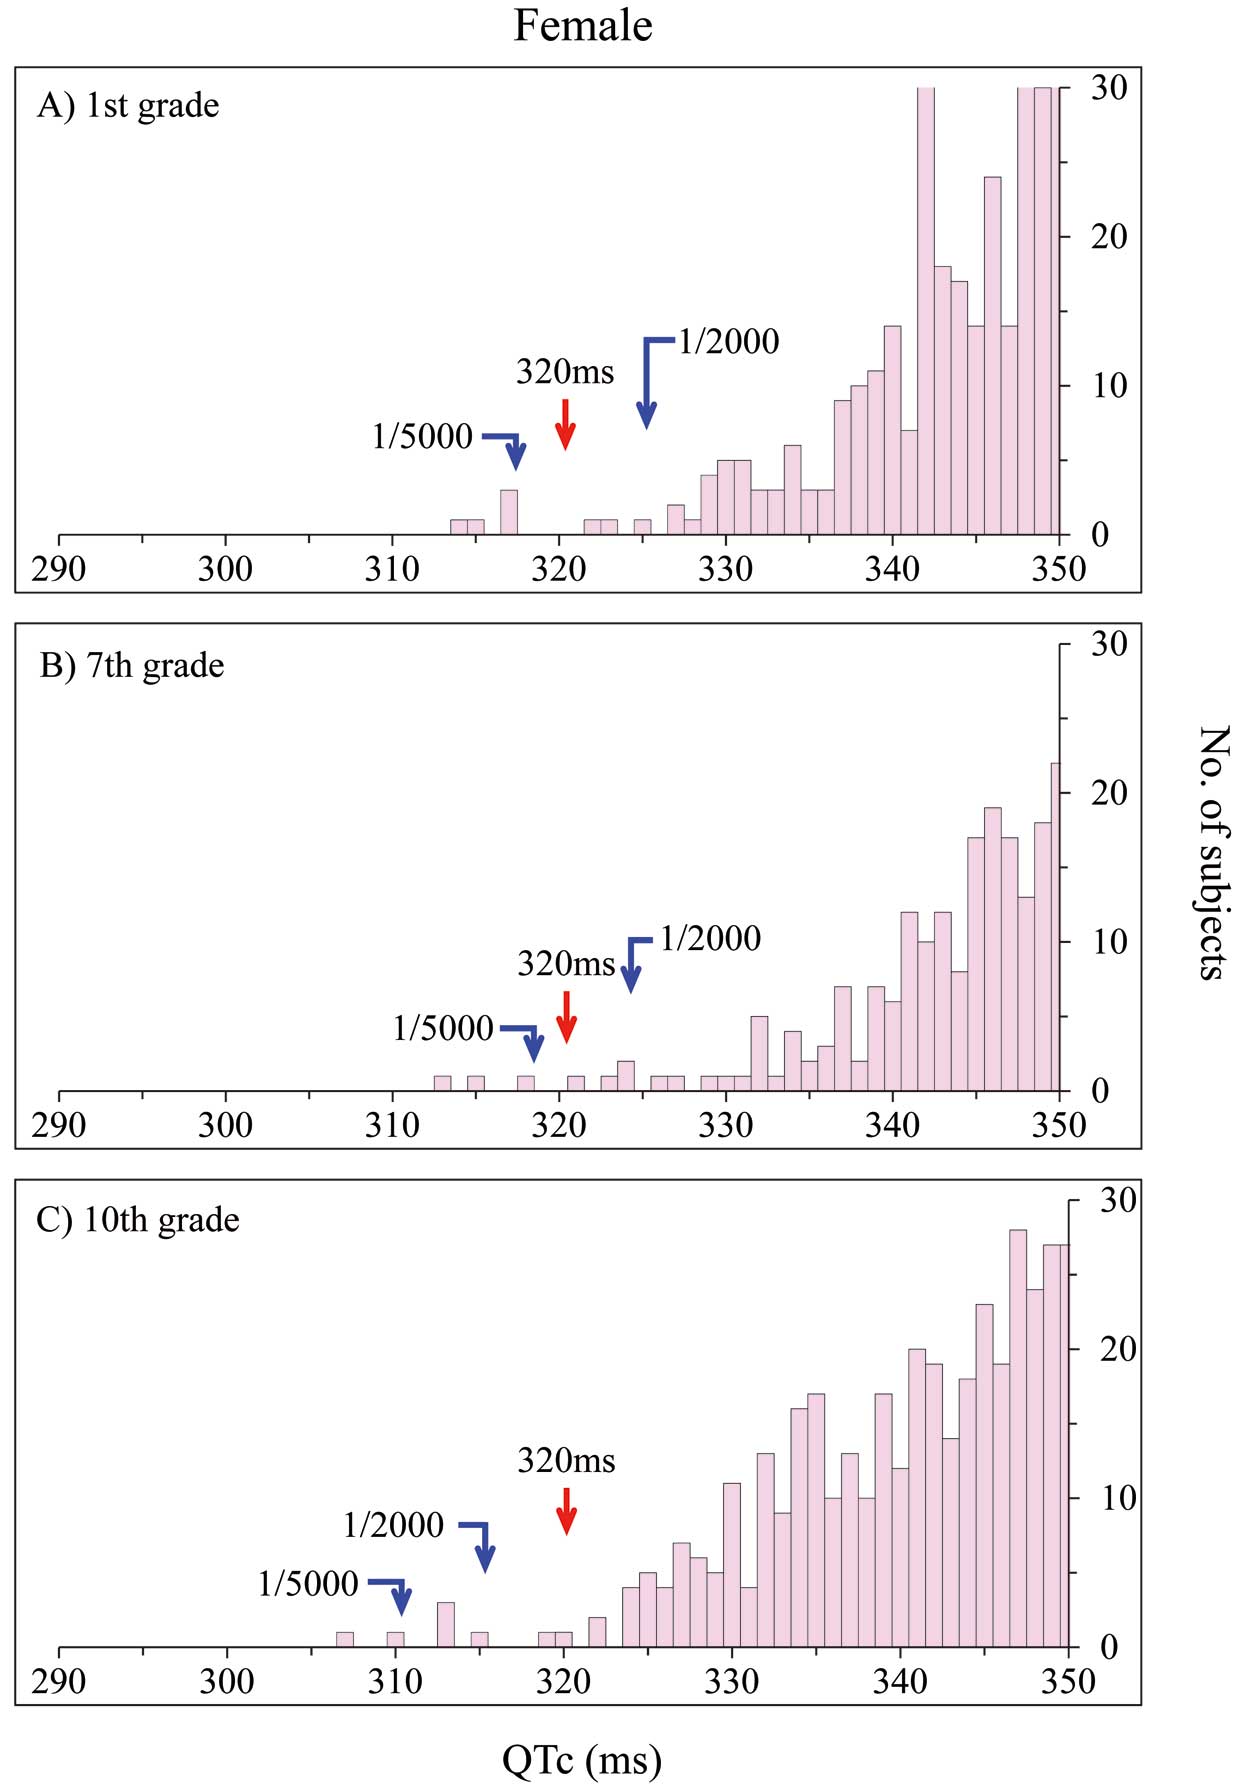
Frequency distribution chart of shortest corrected QT interval (QTc; <350 ms) derived from manual measurements in girls: (A) 1st graders (n=296); (B) 7th graders (n=182); (C) 10th graders (n=381). Blue arrows, QTc corresponding to a prevalence of short QT interval of 1/5,000 and 1/2,000. Red arrow, point of tentative screening value of short QT interval.
| Variable | 1st graders | 7th graders | 10th graders | |||
|---|---|---|---|---|---|---|
| Male | Female | Male | Female | Male | Female | |
| No. subjects† | 1,296 | 1,285 | 1,400 | 1,392 | 979 | 1,039 |
| Minimum QTc (ms) | 317 | 315 | 310 | 313 | 296 | 307 |
| QTc screening cut-off (ms) considering a prevalence of short QT interval of: | ||||||
| 1/10,000 | 317 | 315 | 310 | 313 | 296 | 307 |
| 1/5,000 | 322 | 317 | 312 | 318 | 302 | 310 |
| 1/2,000 | 326 | 325 | 318 | 324 | 306 | 315 |
| 1/1,000 | 327 | 329 | 323 | 332 | 309 | 324 |
| 1/100 | 343 | 343 | 337 | 348 | 325 | 336 |
†Evaluated on manual measurement, after exclusion of inadequate electrocardiograms. QTc, QT interval corrected using Bazett’s formula.
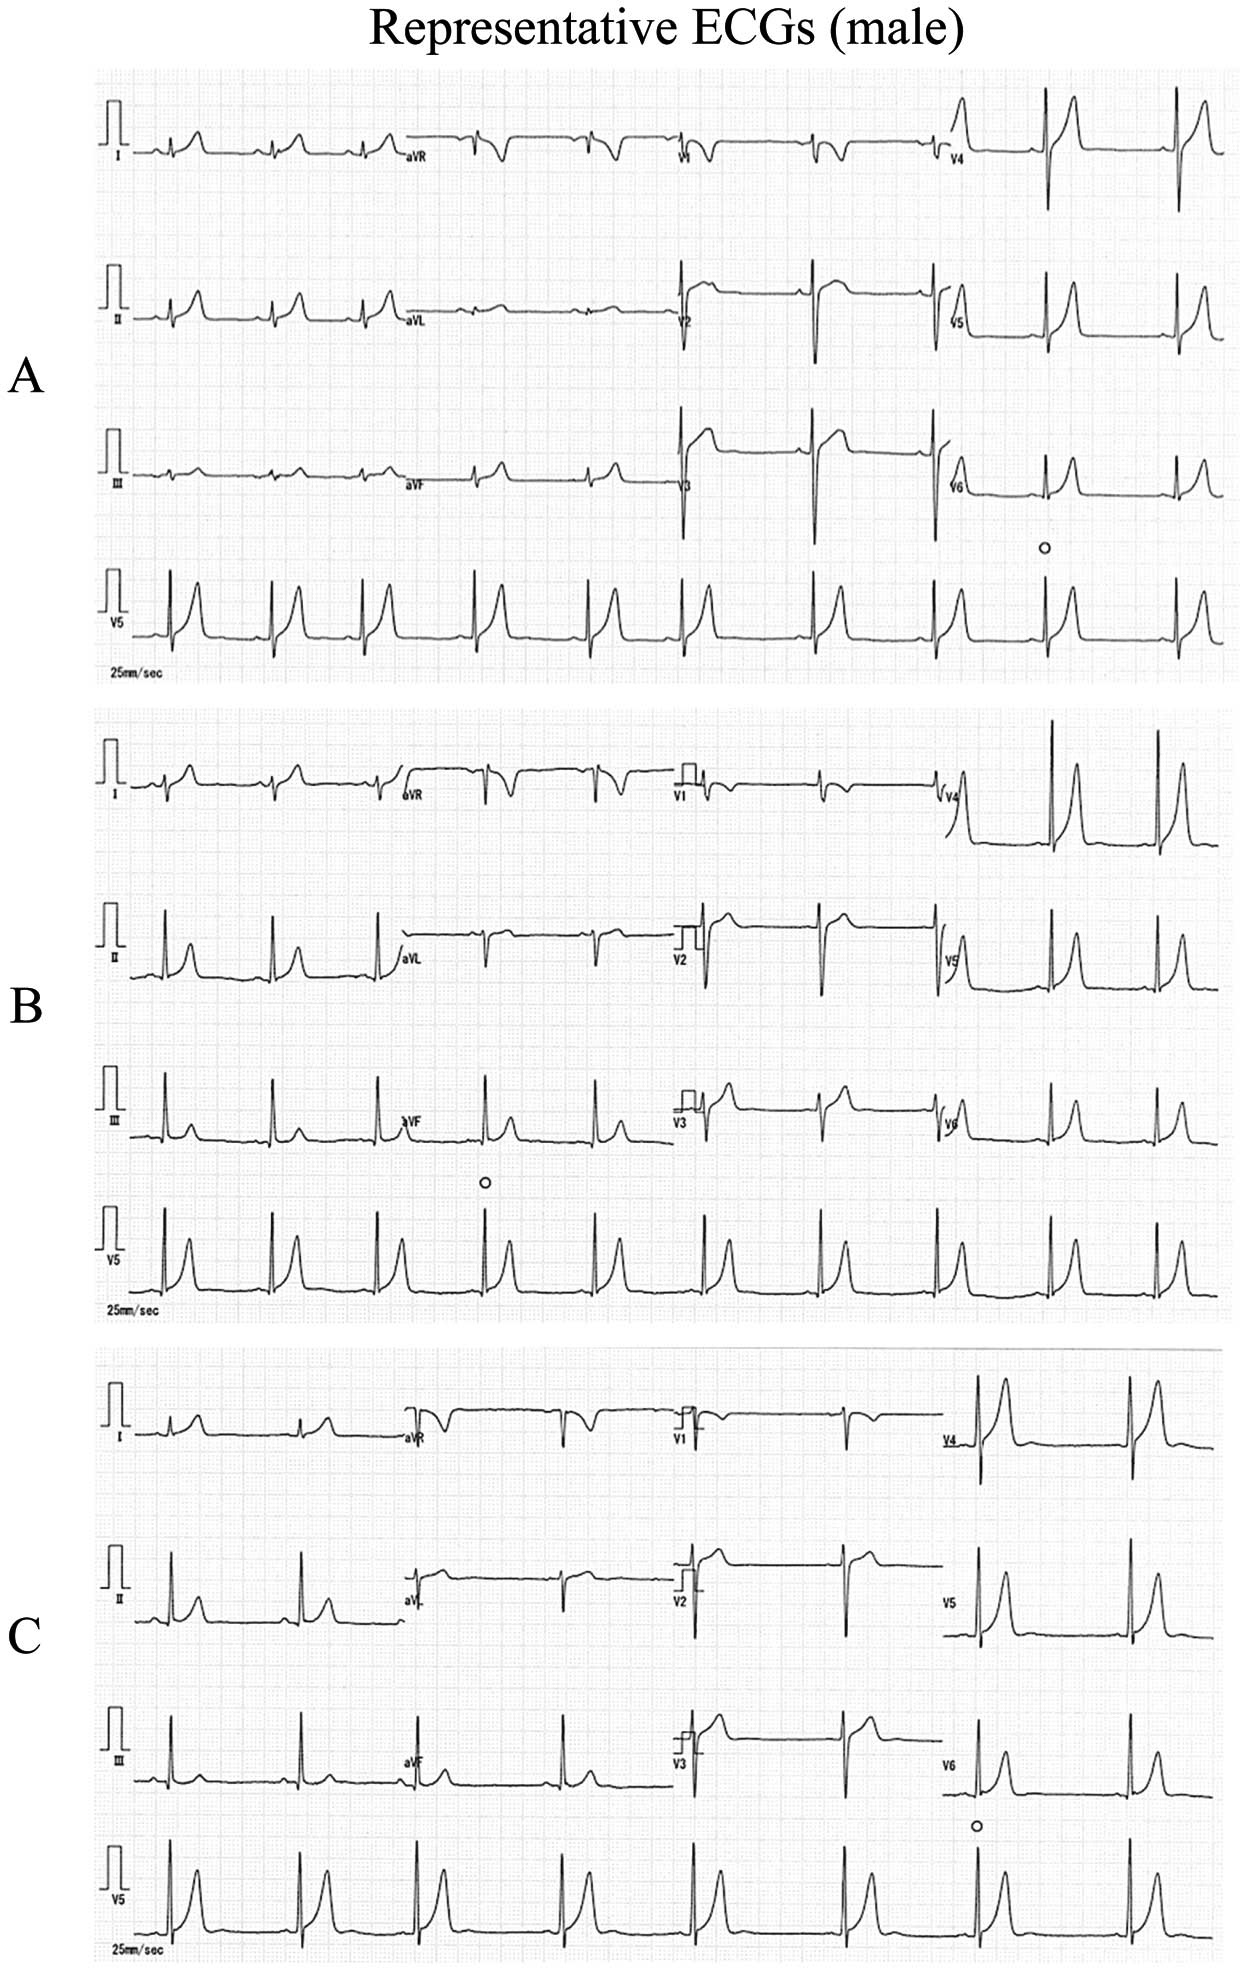
Representative 12-lead electrocardiogram (ECG) in boys with the shortest corrected QT interval (QTc) in each grade: (A) 1st grader (QTc=317 ms); (B) 7th grader (QTc=310 ms); (C) 10th grader (QTc=296 ms).
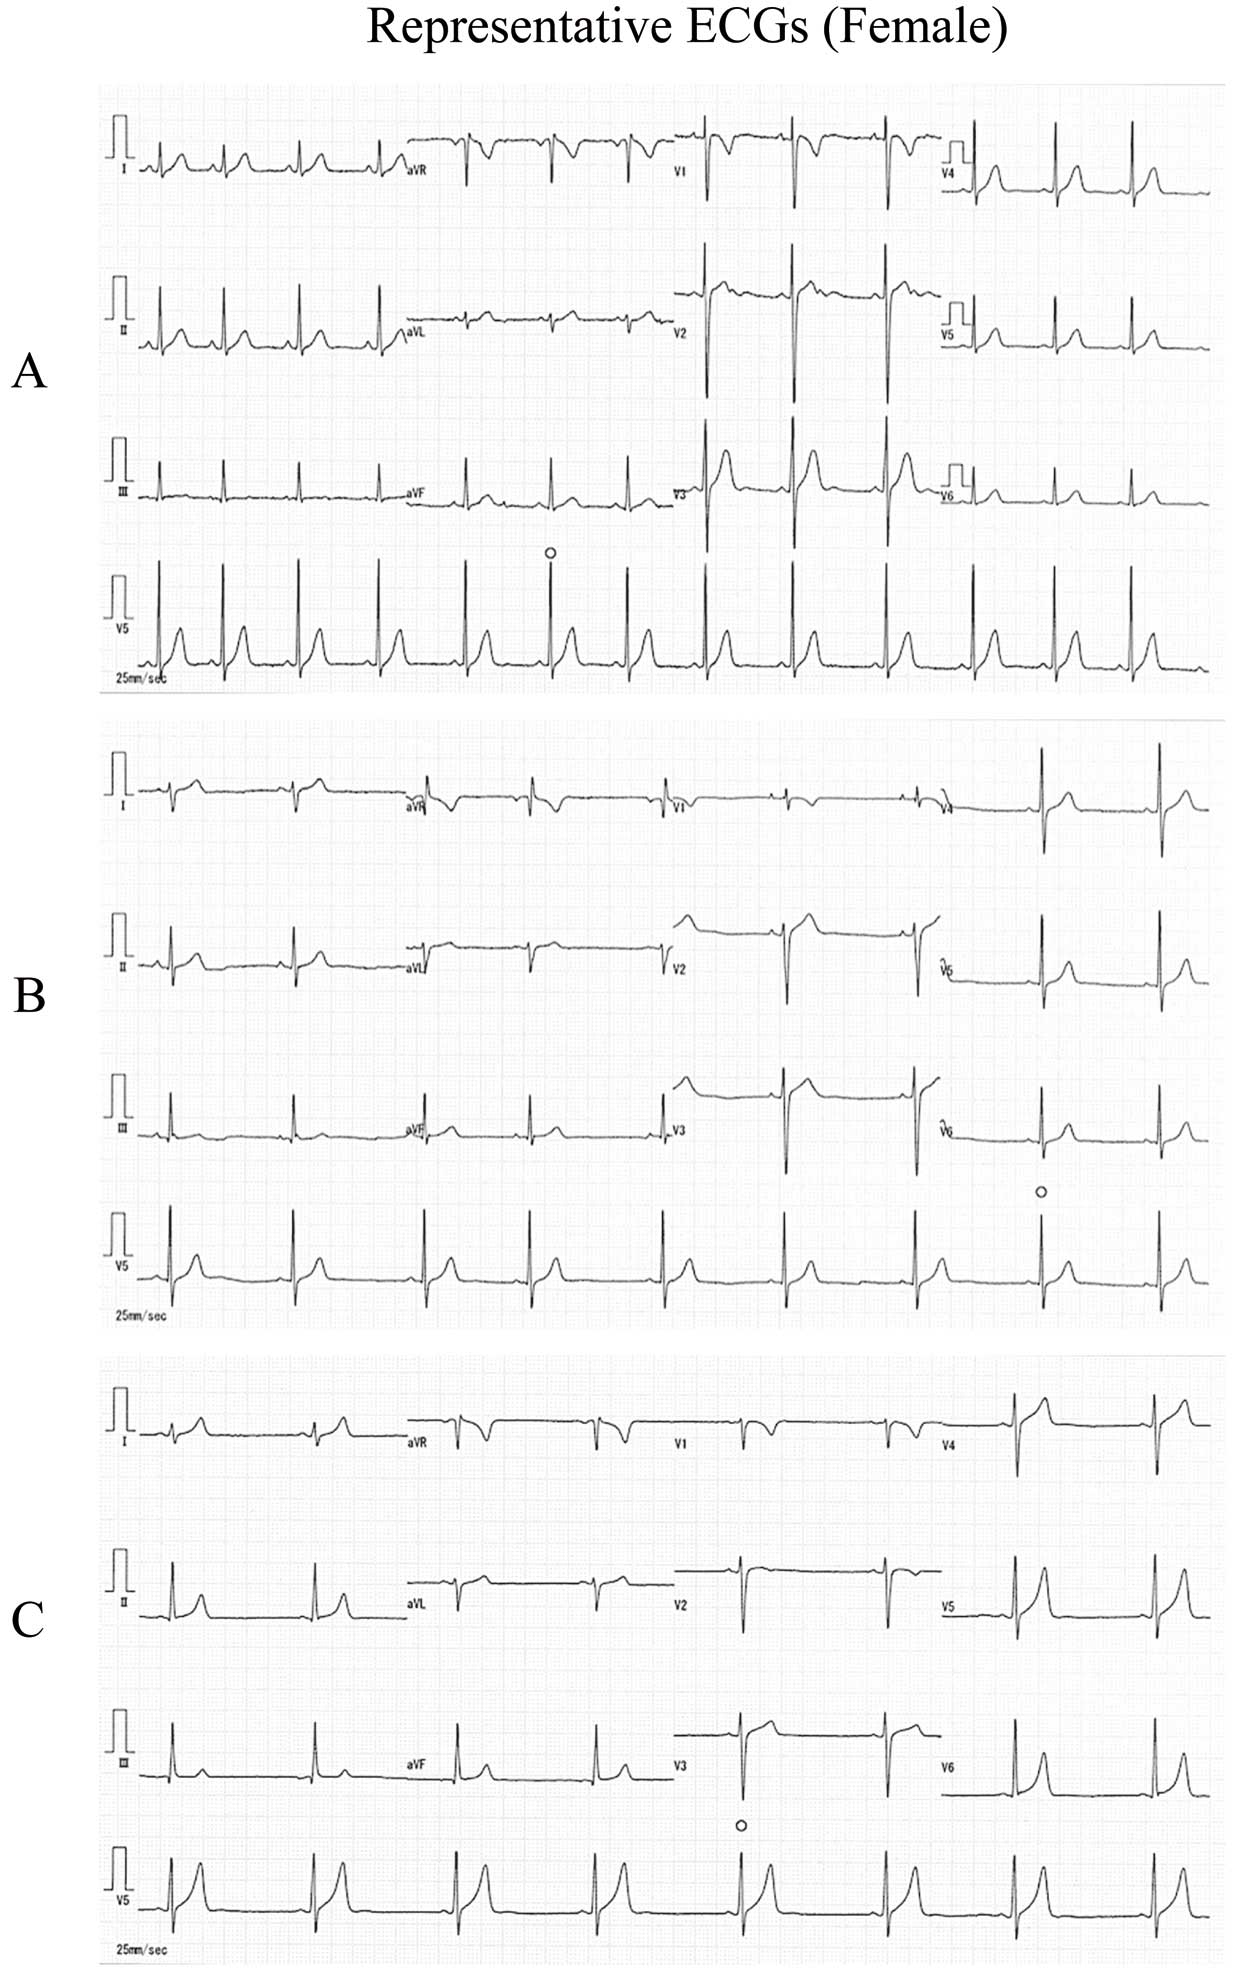
Representative 12-lead electrocardiogram (ECG) in girls with the shortest corrected QT interval (QTc) in each grade: (A) 1st grader (QTc=315 ms); (B) 7th grader (QTc=313 ms); (C) 10th grader (QTc=307 ms).
In the present study, we determined that, for manually measured QT interval corrected using Bazett’s formula, the tentative screening values for short QT interval are 325, 315, and 305 ms in male 1st, 7th, and 10th graders, respectively, and 320 ms in female 1st, 7th, and 10th graders.
This suggests that the screening value indicative of short QT interval decreases with age. Given that Bazett’s formula tends to overshorten the QT value when the heart rate is slow,19–21 QTc was particularly low in 7th and 10th grade boys with bradycardia tendency. Therefore, the expert consensus statement issued by the Heart Rhythm Society, the European Heart Rhythm Association, and the Asia Pacific Heart Rhythm Society recommends avoiding the use of Bazett’s formula when attempting to diagnose SQTS in individuals with tachycardia or bradycardia.7 Giustetto et al reported that, because SQTS patients have reduced adaptation of the QT interval to heart rate, the exercise test can be a useful tool in the diagnosis of SQTS.22 Thus, in subjects with short QT interval and bradycardia, it might be helpful to perform the exercise test in order to diagnose SQTS. In addition, we found that the screening QTc value tended to be smaller in boys than in girls. This is consistent with previously reported sex- and age-specific characteristics of the QT interval.19,20
The prevalence of short QT interval with QTc <330 ms in children and adolescents was reported to be between 1/2,000 and 1/1,250.23,24 In the present study, a total of 58 boys in the 7th grade and 193 boys in the 10th grade were identified as having short QT interval when applying the criterion QTc ≤330 ms, corresponding to a prevalence of short QT interval of 1/242 (58/14,038) and 1/51 (193/9,884), in 7th and 10th grade boys, respectively. Unlike previous studies, the present study included a very large number of subjects for whom QT was obtained using manual measurement.23 Because the manually measured QTc tended to be smaller than the automatically measured values (Table S1), the prevalence of subjects with QTc ≤330 ms was much higher in the present study than in past studies.23 In other words, the currently recommended cut-off would likely yield a very large number of children and adolescents with suspected SQTS, which seems unfeasible in clinical practice. Additionally, as previously reported, we noted sex-specific differences in QTc.25–27 The number of subjects with QTc <330 ms was 35, 58 and 193 boys in 1st, 7th, and 10th grades, respectively, compared with only 18, 10, and 48 girls in 1st, 7th, and 10th grades, respectively. This suggests that, to facilitate efficient screening for SQTS, the screening values indicative of short QT interval should be established separately for each grade and sex. Candidates identified on QTc-based screening should be further evaluated for symptoms, family history of sudden cardiac death, or gene mutations characteristic of SQTS, as described by Gollob et al.2 Upon retrospective review of the questionnaires filled out by the parents during the first stage of the screening program, we evaluated the history of symptoms and family history of cardiac conditions for the 10 subjects with the shortest QT intervals for each grade and sex (in total, 60 subjects). None of the 60 subjects evaluated had a history of symptoms. Three female subjects, however, had family history of sudden death before age 40. A grandparent of a female 10th grader with QTc 313 ms had a heart attack at age 37. The father of a female 7th grader with QTc 319 ms had acute cardiac infarction at age 33. A brother of a 10th grader with QTc 322 ms died at 3 months after birth. These data indicated that it is essential to take into account past history and family history in addition to QTc when screening for short QT interval.
ImplicationsThere are no currently accepted universal criteria for SQTS screening. A school-based ECG screening program has been conducted in Japan, which has led to the successful detection of at least 1 case of SQTS.15 The present proposed tentative screening values may be useful for early detection of SQTS.
Study LimitationsThere were some limitations in the present study. First, the present subject age range was limited. Therefore, the suggested screening values may not be useful for SQTS screening of children and adolescents across all age groups. Second, the optimal QTc criteria for SQTS screening may need to be re-evaluated as the number of SQTS patients described in the literature increases. A prospective, long-term study should be performed to determine whether all young subjects with SQTS can be adequately identified using the present temporary criteria. Finally, no genetic testing was performed in the present study. The recent expert consensus statement recommended diagnosing SQTS in the presence of short QT interval (QTc ≤330 ms) rather than only genetic testing.7 Further cohorts involving clinical data and genetic testing are necessary to develop the criteria for SQTS.
The tentative QTc values to be used in screening for short QT interval were estimated at 325, 315, and 305 ms in male 1st, 7th, and 10th graders, respectively; and at 320 ms in female 1st, 7th, and 10th graders. Effective screening for short QT interval in children and adolescents may require the use of age- and sex-specific QTc.
The authors declare no conflicts of interest.
This work was partly supported by a Health and Labour Sciences Research Grant from the Ministry of Health, Labour and Welfare of Japan (H29-055).
Supplementary File 1
Figure S1. Influence of QT correction method on the frequency distribution of shortest corrected QT interval (QTc; <350 ms) in 1st graders: (A,C) Bazett’s formula (A, 334 boys; C, 296 girls); and (B,D) Fridericia’s formula (B, 766 boys; D, 711 girls).
Figure S2. Influence of QT correction method on the frequency distribution of shortest corrected QT interval (QTc; <350 ms) in 7th graders: (A,C) Bazett’s formula (A, 584 boys; C, 182 girls); and (B,D) Fridericia’s formula (B, 783 boys; D, 375 girls).
Figure S3. Influence of QT correction method on the frequency distribution of shortest corrected QT interval (QTc; <350 ms) in 10th graders: (A,C) Bazett’s formula (A, 509 boys; C, 165 girls); and (B,D) Fridericia’s formula (B, 694 boys; D, 139 girls).
Table S1. QT parameters: mean differences between automatic and manual measurement
Please find supplementary file(s);
http://dx.doi.org/10.1253/circj.CJ-18-0213