Abstract
Background:
The independent role of serum triglyceride (TG) levels as a cardiovascular risk factor is still not elucidated. We aimed to investigate if the effect of TG on arterial stiffness is influenced by the serum level of low-density lipoprotein cholesterol (LDL-C).
Methods and Results:
We studied 11,640 subjects who underwent health checkups. They were stratified into 4 groups according to LDL-C level (≤79, 80–119, 120–159, and ≥160 mg/dL). Arterial stiffness was evaluated by brachial-ankle pulse wave velocity (baPWV). In each group, univariate and multivariete logistic regression analyses were performed to investigate the association between high TG (≥150 mg/dL) and high baPWV (>1,400 cm/s). In the univarite analysis, high TG was significantly associated with high baPWV in LDL-C <79 mg/dL (OR, 3.611, 95% CI, 2.475–5.337; P<0.0001) and 80–119 mg/dL (OR, 1.881; 95% CI, 1.602–2.210; P<0.0001), but not in LDL-C 120–159 mg/dL and ≥160 mg/dL. In the multivariate analysis, high TG was significantly associated with high baPWV in LDL-C ≤79 mg/dL (OR, 2.558; 95% CI, 1.348–4.914; P=0.0040) and LDL-C 80–119 mg/dL (OR, 1.677; 95% CI, 1.315–2.140; P<0.0001), but not in LDL-C 120–159 mg/dL and ≥160 mg/dL.
Conclusions:
High TG and increased arterial stiffness showed an independent relationship in a Japanese general population with LDL-C ≤119 mg/dL. TG-lowering therapy might be an additional therapeutic consideration in these subjects.
The incidence of cardiovascular disease (CVD), one of the major causes of death and disability, is increasing and is expected to rise further as life expectancy increases globally. Recognition of patients at high risk of CVD is essential to devising prevention strategies. Dyslipidemia, especially elevated levels of low-density lipoprotein cholesterol (LDL-C), is a well-known risk factor for CVD.1
However, patients with cardiometabolic syndrome remain at high risk of cardiovascular events even when the LDL-C goal is achieved. Several studies have shown that possible residual risk factors include hypertriglyceridemia,2,3
low levels of high-density lipoprotein cholesterol (HDL-C),4
and hyperuricemia.5
As for hypertriglyceridemia, several reports have suggested that triglycerides (TG) are independently associated with ischemic CVD6
and a decrease in initially high TG levels has been associated with a decreased risk of coronary artery disease compared with stably elevated TG levels.7
However, there are also reports that deny the independence of hypertriglyceridemia as a cardiovascular risk factor.8
Therefore, the role of TG as an independent risk factor for CVD is still controversial and may vary according to the coexistence of other cardiovascular risk factors and the severity of the target cardiovascular disorders.
Arterial stiffness is an important risk factor for atherosclerosis at an early stage of CVD. Pulse wave velocity (PWV) is used as an index of arterial stiffness, and brachial-ankle PWV (baPWV) is a conventional and noninvasive screening method to identify patients at high risk of CVD.9
In the era of statin therapy, we again need to pay attention to the residual risk of these patients even after their LDL-C goals have been achieved. We hypothesized that high TG levels are more closely associated with the early stage of CVD, especially in patients with low LDL levels. In the present study, we examined the association between serum TG levels and baPWV after stratification for LDL-C levels by analyzing the medical records of Japanese subjects who underwent medical health checkups.
Methods
Study Population
Subjects who underwent routine health checkups at the JA Kagoshima Kouseiren Medical Health Care Center (Kagoshima, Japan) from January 2001 to December 2015 were enrolled in this cross-sectional study. Among them, 31,743 had their arterial stiffness evaluated by baPWV, which was optional. Subjects were excluded if they were younger than 20 years old, did not have direct measurements of serum TG and LDL, were missing measurements of variables used in the analysis as confounding factors, showed atrial fibrillation on ECG (because it may affect the reliability of baPWV measurements) or were receiving medical treatment for dyslipidemia, hypertension (HT), diabetes mellitus (DM), or hyperuricemia, which may have an influence on confounding factors, including blood pressure (BP), blood glucose, and uric acid levels.
The study conformed to the Declaration of Helsinki and was approved by the institutional ethics committees of the Graduate School of Medical and Dental Sciences, Kagoshima University, Kyoto University Graduate School of Medicine, and JA Kagoshima Kouseiren Hospital.
Data Collection
Data on medical history, including history of HT, DM, dyslipidemia, medications, and cigarette smoking and alcohol drinking were obtained through self-administered questionnaires. The classification of smoking and alcohol drinking status was as follows: smoker, smoking currently; non-smoker, never smoked or smoked in the past; chance drinker, drinking no more than 10 days per month; habitual drinker, drinking alcohol more than 11 days per month. Body mass index (BMI, kg/m2) was calculated for each subject. BP was measured using a mercury sphygmomanometer after subjects sat quietly for 5 min. A 12-lead surface ECG recording was performed. Blood samples were obtained in the fasting state.
Serum levels of TG and LDL-C were measured by enzymatic methods using Choletest TG (Sekisui Medical, Tokyo, Japan) and Choletest LDL (Sekisui Medical, Tokyo, Japan), respectively. JA Kagoshima Kouseiren Medical Health Care Center participates in the External Quality Assessment of Clinical Laboratories program of the Lipid Standardization Program of the US Centers for Disease Control and Prevention/Cholesterol Reference Method Laboratory Network. The other biochemical parameters, including serum HDL-C, uric acid, creatinine, and blood glucose levels, were measured using standard laboratory procedures.
Measurement of baPWV
The measurement of baPWV was performed similarly to a previously reported study from the same facility.10
Cuffs were applied to the 4 extremities, and the ECG electrodes were attached to the upper arm. A microphone was placed in the 2nd intercostal space on the left side of the sternum. The subject was then asked to rest supine for 5 min, and the following variables were measured and automatically calculated with a Colin Waveform Analyzer (Colin, Komaki, Japan) using the following equation: baPWV=(D1−D2)/T1, where D1 is the distance from the aortic root to the right ankle, and D2 is that from the heart to the right upper arm. These distances were determined according to the subject’s height. T1 is the time from the onset of the rise in pulse volume record of the right upper arm to the onset of the rise in pulse volume record of the right ankle.9
The BP in the extremity was obtained automatically by the Colin Waveform Analyzer when baPWV was measured, and we used the mean of the right and left brachial BPs for analysis. A high baPWV was defined as >1,400 cm/s in this study, because this value is an independent variable for risk stratification using the Framingham score and for the discrimination of patients with atherosclerotic CVD.11
Statistical Analysis
Continuous variables, including age, BMI, BP, and the serum creatinine, LDL-C, HDL-C, and serum uric acid concentrations, are expressed as mean±standard deviation (SD), except for TG, which is expressed as median [1st quartile, 3rd quartile]. Categorical variables, including sex, and smoking and alcohol drinking status, are expressed as number of subjects and proportions (percentages).
Subjects were stratified into 4 groups according to LDL-C levels (≤79 mg/dL, 80–119 mg/dL, 120–159 mg/dL, and ≥160 mg/dL) based on the classifications used in previous studies.12,13
Each variable was compared among the 4 groups, with the χ2
test for sex, the Kruskal-Wallis test for TG, and one-way analysis of variance for the other continuous variables. For assessment of the contribution of TG levels on baPWV measurements by LDL-C levels, we compared the proportion of subjects with high baPWV between the normal and high TG groups according to the LDL-C categories.
Univariate logistic regression analysis was performed to clarify the association between baPWV levels and other variables. Multivariate logistic regression analysis was performed to investigate the contribution of high TG levels to high baPWV when divided into 4 groups according to LDL-C levels. Age, sex, BMI, smoking and drinking status, systolic BP, serum creatinine, blood glucose, HDL-C, and uric acid levels, and high TG levels (≥150 mg/dL) were used as covariates for the multivariate analyses. Finally, we performed the same analyses in the following subgroups: elderly, ≥65 years old; non-obese, BMI <25 kg/m2; normotensive, systolic BP <140 mmHg, diastolic BP <90 mmHg, and no antihypertensive drugs; non-diabetic, blood glucose <126 mg/dL and no antidiabetic drugs.
All statistical analyses were performed using JMPPro version 11 (SAS Institute Inc., Cary, NC, USA) for Windows. P-values <0.05 were considered significant.
Results
Characteristics of the Study Population
From among 45,154 subjects, 11,640 were included in the analysis (Figure 1). Their baseline characteristics according to LDL-C levels are summarized in
Table 1. The mean age was 54.6±11.7 years, and the proportion of men was 56.1%. The median [1st quartile, 3rd quartile] of serum TG was 90 mg/dL [64 mg/dL, 130 mg/dL] and the mean±SD of serum LDL-C, and baPWV was 123.2±30.9 mg and 1,441±290 cm/s, respectively. As the LDL increased, age, the proportion of men, BMI, serum creatinine, blood glucose, TG, uric acid levels, baPWV measurements, and the proportion with high baPWV tended to increase, while the proportion of men, proportion of habitual alcohol drinkers, and serum HDL-C levels tended to decrease.
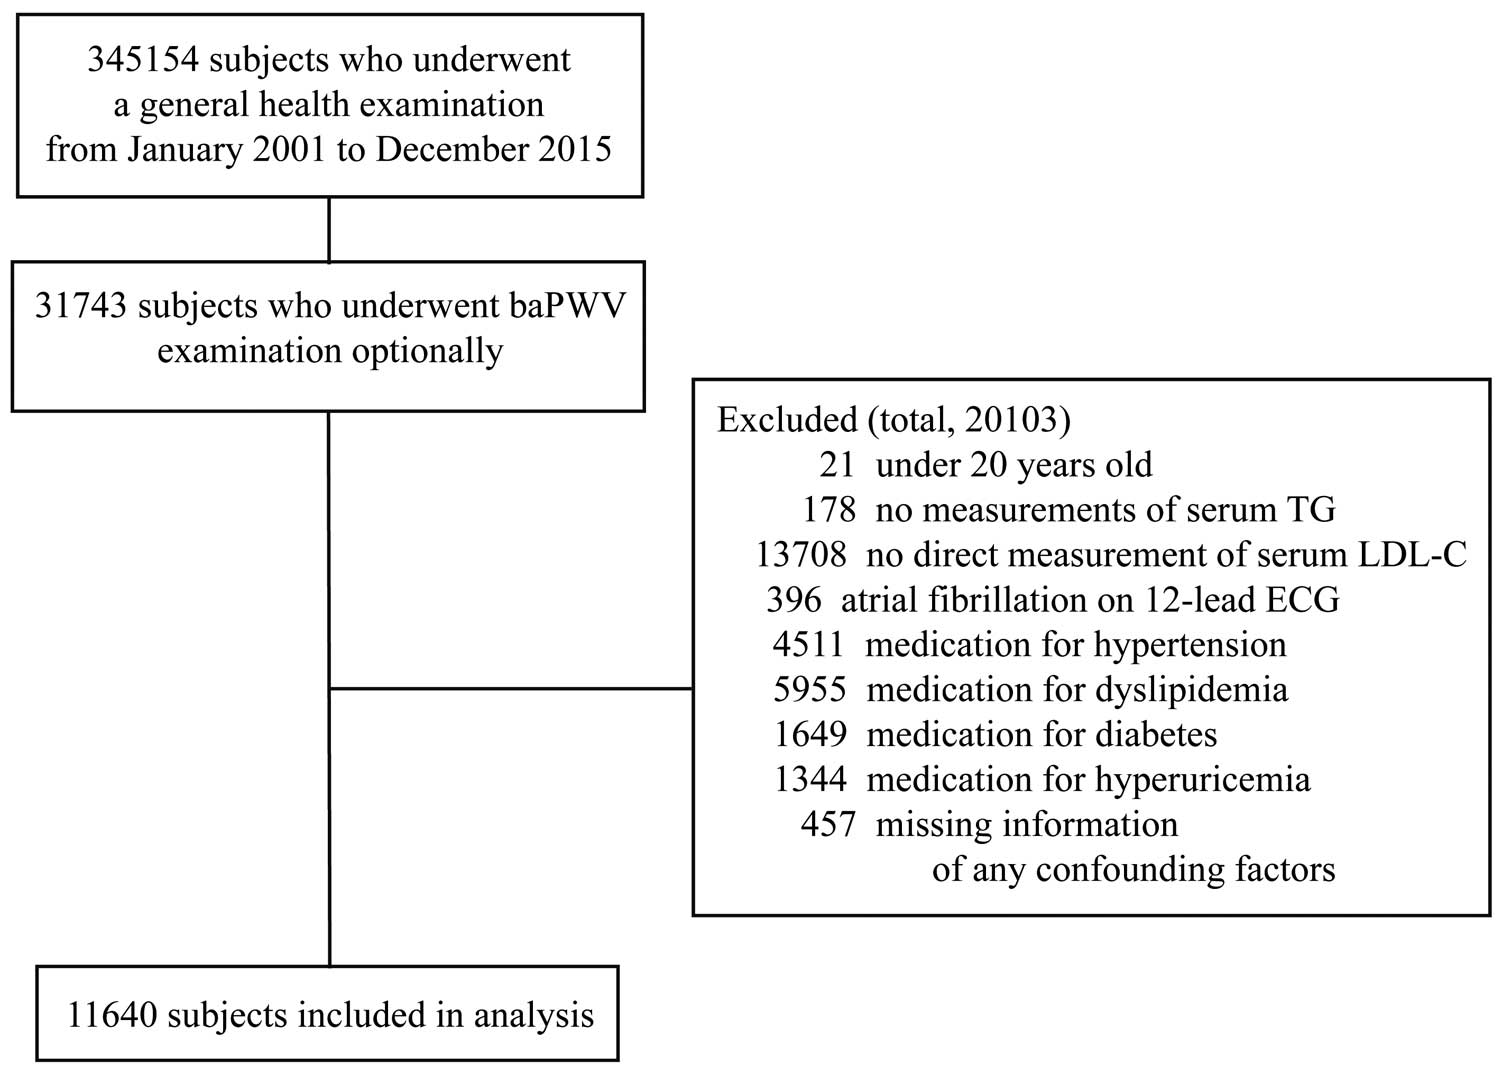
Table 1.
Characteristics of the Study Subjects According to LDL-C Levels
| |
LDL-C |
All
(n=11,640) |
≤79 mg/dL
(n=798) |
80–119 mg/dL
(n=4,739) |
120–159 mg/dL
(n=4,789) |
≥160 mg/dL
(n=1,311) |
| Age (years) |
54.6±11.7 |
52.4±13.1 |
53.8±12.4 |
55.7±11.0 |
55.1±10.2 |
| Male sex, n (%) |
6,526 (56.1) |
492 (61.7) |
2,698 (56.9) |
2,650 (55.3) |
686 (52.3) |
| BMI (kg/m2) |
22.9±3.3 |
21.4±2.9 |
22.4±3.2 |
23.3±3.3 |
24.1±3.3 |
| Smoking, n (%) |
2,461 (21.1) |
233 (29.2) |
1,035 (21.8) |
922 (19.3) |
271 (20.7) |
| Habitual alcohol drinking, n (%) |
2,940 (25.3) |
327 (41.1) |
1,378 (29.2) |
1,029 (21.5) |
206 (15.8) |
| SBP (mmHg) |
118.2±15.8 |
117.2±16.6 |
117.0±16.0 |
118.9±15.5 |
120.3±15.6 |
| Creatinine (mg/dL) |
0.75±0.17 |
0.73±0.15 |
0.74±0.18 |
0.75±0.15 |
0.75±0.16 |
| Blood glucose (mg/dL) |
100.0±17.6 |
97.7±15.2 |
98.8±15.5 |
100.3±16.6 |
104.5±26.4 |
| HDL-C (mg/dL) |
60.4±15.2 |
64.4±19.3 |
61.8±15.9 |
59.1±14.1 |
57.5±12.5 |
| TG (mg/dL) |
90 [64 130] |
66 [49 107] |
78 [57 116] |
96 [71 135] |
114 [87 156] |
| Uric acid (mg/dL) |
5.4±1.4 |
5.3±1.5 |
5.3±1.4 |
5.5±1.4 |
5.6±1.4 |
| baPWV (cm/s) |
1,441±290 |
1,438±355 |
1,421±292 |
1,456±279 |
1,466±278 |
| baPWV >1,400 cm/s, n (%) |
5,466 (47.0) |
345 (43.2) |
2,058 (43.4) |
2,397 (50.1) |
666 (50.8) |
baPWV, brachial-ankle pulse wave velocity; BMI, body mass index; HDL-C, high-density lipoprotein cholesterol; LDL-C, low-density lipoprotein cholesterol; SBP, systolic blood pressure; TG, triglycerides.
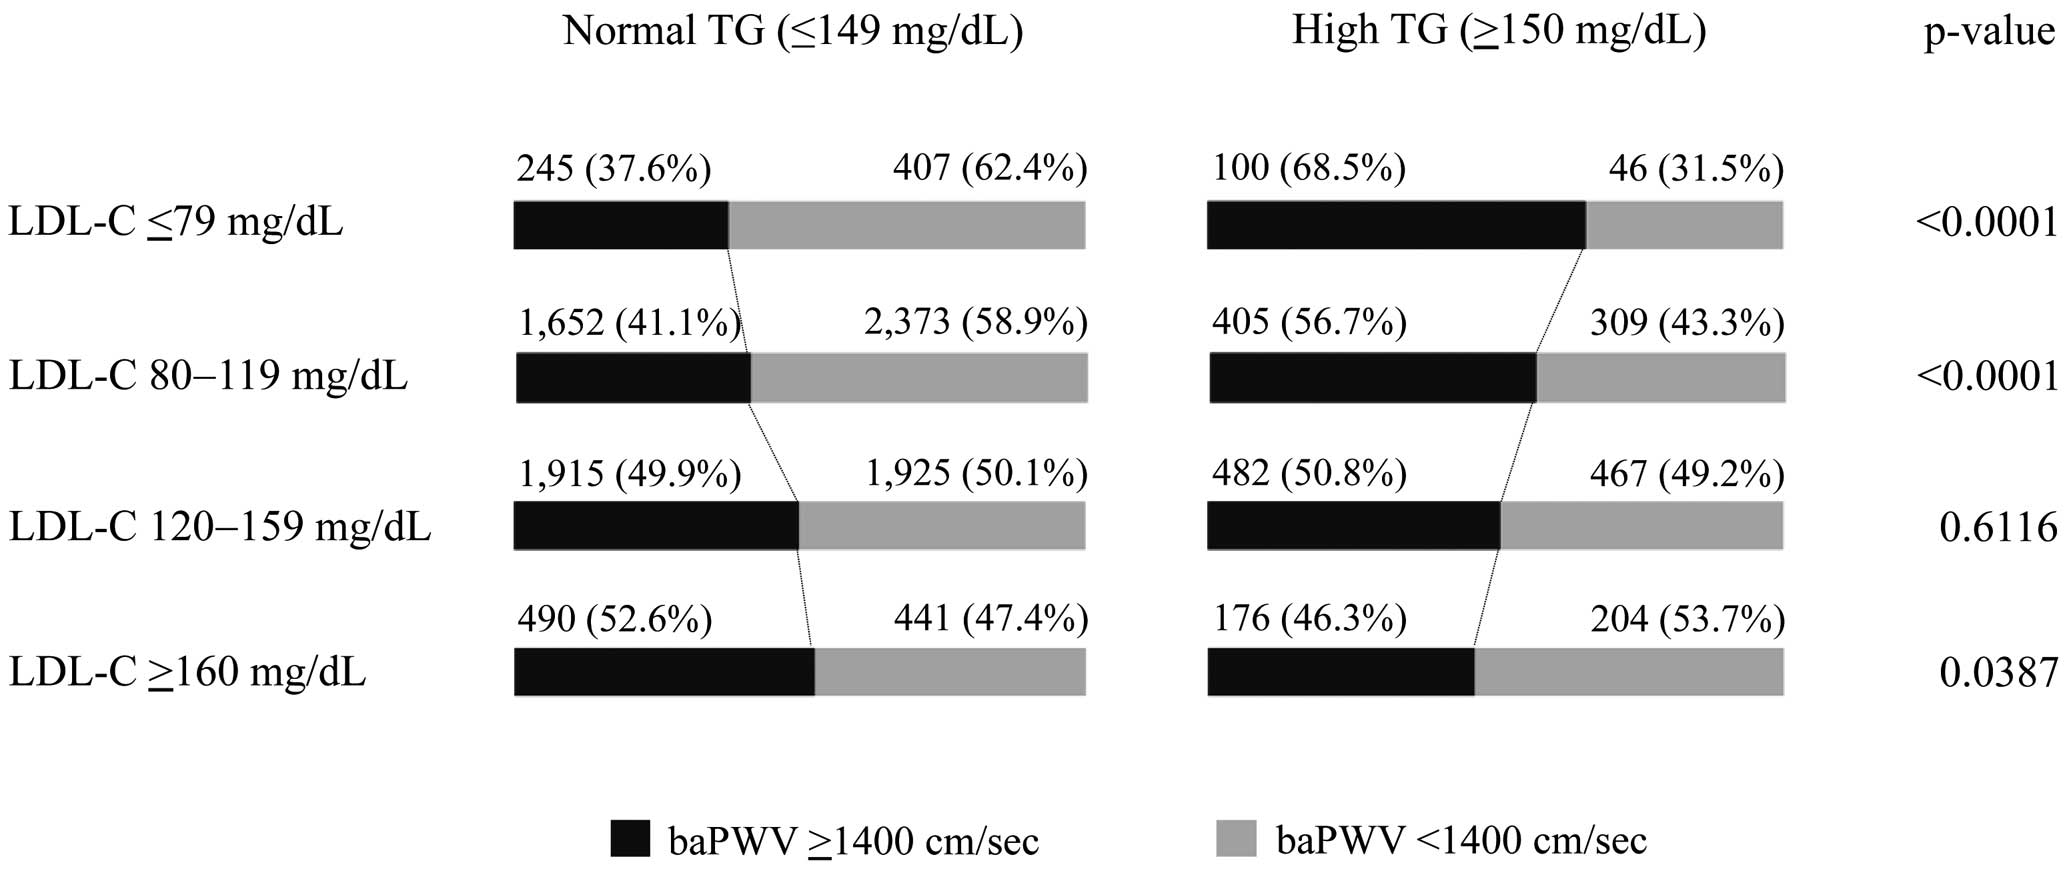
The results of the comparison of the proportion with high baPWV between the normal and high TG groups according to LDL-C levels are shown in
Figure 2. The proportion of high baPWV measurements was significantly less among subjects with high TG (≥150 mg/dL) than among those with normal TG (<150 mg/dL) in the LDL-C ≥160 mg/dL group (46.3% vs. 52.6%, P=0.0387). As the LDL-C levels decreased, the proportion of high baPWV measurements in subjects with high TG levels gradually increased. In contrast, the proportion of high baPWV measurements was significantly higher among subjects with high TG than among those with normal TG in the LDL-C 80–119 mg/dL (56.7% vs. 41.1%, P<0.0001) and LDL-C ≤79 mg/dL groups (68.5% vs. 37.6%, P<0.0001).
Association Between TG and baPWV When Classified by Serum LDL-C Levels
Table 2
shows the results of univariate logistic regression analysis to identify the factors associated with high baPWV values. Age, male sex, systolic BP, and blood glucose were significantly associated with high baPWV across all levels of LDL-C. High TG was significantly associated with high baPWV in the LDL-C ≤79 mg/dL (odds ratio [OR], 3.611; 95% confidence interval [CI], 2.475–5.337; P<0.0001) and 80–119 mg/dL (OR, 1.881; 95% CI, 1.602–2.210; P<0.0001) groups, but not in the LDL-C 120–159 mg/dL and ≥160 mg/dL groups.
Table 2.
Univariate Logistic Regression Analysis to Identify the Factors Associated With High baPWV Value (>1,400 cm/s)
| |
LDL ≤79 mg/dL
(n=798) |
LDL 80–119 mg/dL
(n=4,739) |
LDL 120–159 mg/dL
(n=4,789) |
LDL 160 mg/dL≥
(n=1,311) |
| OR |
95% CI |
P value |
OR |
95% CI |
P value |
OR |
95% CI |
P value |
OR |
95% CI |
P value |
| Age (years) |
1.123 |
1.105–
1.142 |
<0.0001 |
1.123 |
1.115–
1.131 |
<0.0001 |
1.112 |
1.104–
1.120 |
<0.0001 |
1.108 |
1.092–
1.124 |
<0.0001 |
| Male sex |
5.645 |
4.064–
7.936 |
<0.0001 |
2.015 |
1.869–
2.372 |
<0.0001 |
1.219 |
1.088–
1.367 |
0.0007 |
0.750 |
0.603–
0.932 |
0.0093 |
| BMI (kg/m2) |
1.086 |
1.034–
1.140 |
0.0008 |
1.042 |
1.024–
1.061 |
<0.0001 |
0.993 |
0.976–
1.011 |
0.4446 |
0.963 |
0.931–
0.996 |
0.0263 |
| Smoking |
1.319 |
0.970–
1.793 |
0.0772 |
0.757 |
0.657–
0.872 |
0.0001 |
0.575 |
0.497–
0.666 |
<0.0001 |
0.480 |
0.364–
0.631 |
<0.0001 |
Habitual
alcohol
drinking |
3.033 |
2.266–
4.075 |
<0.0001 |
2.032 |
1.790–
2.308 |
<0.0001 |
1.813 |
1.575–
2.088 |
<0.0001 |
1.294 |
0.960–
1.748 |
0.0912 |
| SBP (mmHg) |
1.107 |
1.091–
1.124 |
<0.0001 |
1.093 |
1.087–
1.099 |
<0.0001 |
1.082 |
1.076–
1.088 |
<0.0001 |
1.087 |
1.075–
1.099 |
<0.0001 |
Creatinine
(mg/dL) |
27.629 |
10.243–
77.070 |
<0.0001 |
5.211 |
3.539–
7.700 |
<0.0001 |
1.750 |
1.212–
2.529 |
0.0028 |
0.785 |
0.406–
1.517 |
0.4716 |
Blood glucose
(mg/dL) |
1.056 |
1.041–
1.071 |
<0.0001 |
1.039 |
1.033–
1.044 |
<0.0001 |
1.029 |
1.024–
1.034 |
<0.0001 |
1.006 |
1.002–
1.012 |
0.0044 |
HDL-C
(mg/dL) |
0.990 |
0.983–
0.997 |
0.0083 |
0.991 |
0.987–
0.994 |
<0.0001 |
0.999 |
0.995–
1.003 |
0.5266 |
1.011 |
1.002–
1.020 |
0.0155 |
TG
(>150 mg/dL) |
3.611 |
2.475–
5.337 |
<0.0001 |
1.881 |
1.602–
2.210 |
<0.0001 |
1.038 |
0.900–
1.196 |
0.6116 |
0.802 |
0.611–
1.021 |
0.0387 |
Uric acid
(mg/dL) |
1.546 |
1.393–
1.724 |
<0.0001 |
1.247 |
1.197–
1.300 |
<0.0001 |
1.092 |
1.048–
1.138 |
<0.0001 |
0.944 |
0.874–
1.020 |
0.1449 |
CI, confidence interval; OR, odds ratio. Other abbreviations as in Table 1.
The results of multivariate logistic regression analysis to examine the independent association between high TG levels and high baPWV measurements according to LDL-C categories are shown in
Table 3. In the model including all variables as adjusting factors (model 3), high TG was significantly associated with high baPWV in the LDL-C ≤79 mg/dL (OR, 2.558; 95% CI, 1.348–4.914; P=0.0040) and LDL-C 80–119 mg/dL (OR, 1.677; 95% CI, 1.315–2.140; P<0.0001) groups, but not in the LDL-C 120–159 mg/dL and ≥160 mg/dL groups.
Table 3.
Multivariate Logistic Regression Analysis for High baPWV Value (>1,400 cm/s)
| |
LDL-C ≤79 mg/dL |
LDL-C 80–119 mg/dL |
LDL-C 120–159 mg/dL |
LDL-C ≥160 mg/dL |
| OR |
95% CI |
P value |
OR |
95% CI |
P value |
OR |
95% CI |
P value |
OR |
95% CI |
P value |
| TG >150 mg/dL |
| Model 1 |
3.439 |
2.154–
5.574 |
<0.0001 |
2.227 |
1.831–
2.714 |
<0.0001 |
1.383 |
1.168–
1.637 |
0.0002 |
1.072 |
0.817–
1.409 |
0.6171 |
| Model 2 |
4.537 |
2.675–
7.836 |
<0.0001 |
2.365 |
1.918–
2.921 |
<0.0001 |
1.376 |
1.153–
1.642 |
0.0004 |
1.111 |
0.835–
1.479 |
0.4704 |
| Model 3 |
2.558 |
1.348–
4.914 |
0.0040 |
1.677 |
1.315–
2.140 |
<0.0001 |
1.074 |
0.878–
1.314 |
0.4864 |
1.002 |
0.717–
1.400 |
0.9898 |
Model 1, adjusted for age and sex; model 2, adjusted for age, sex and HDL-C; model 3: adjusted for age, sex, HDL-C, BMI, smoking, alcohol drinking, SBP, serum creatinine, blood glucose, and uric acid level. Abbreviations as in Tables 1,2.
The results of the multivariate logistic regression analysis in several subgroups are shown in
Table 4. In the analysis in women and in the elderly population (≥65 years old), the numbers of the subjects with baPWV ≥1,400 cm/s and TG ≥150 mg/dL in the LDL ≤79 mg/dL group were too small to perform a reliable statistical analysis (4 and 19 subjects, respectively); thus, we combined the subjects in the LDL-C ≤79 mg/dL and 80–119 mg/dL groups. In each subgroup analysis, we found an independent association between high TG and high baPWV levels in the LDL-C ≤119 mg/dL group.
Table 4.
Multivariate Logistic Regression Analysis for High baPWV Value (>1,400 cm/s) in Each Subgroup
| |
LDL-C ≤119 mg/dL |
LDL-C 120–159 mg/dL |
LDL-C ≥160 mg/dL |
|
|
|
|
| N |
OR |
95% CI |
P value |
N |
OR |
95% CI |
P value |
N |
OR |
95% CI |
P value |
|
|
|
|
| Womena |
2,335 |
1.899 |
1.069–
3.387 |
0.0282 |
2,139 |
1.135 |
0.747–
1.731 |
0.5551 |
624 |
0.591 |
0.340–
1.016 |
0.0571 |
|
|
|
|
Elderly
(>65years)b |
1,140 |
3.088 |
1.320–
8.269 |
0.0083 |
1,010 |
1.164 |
0.633–
2.223 |
0.6297 |
232 |
2.801 |
0.770–
13.322 |
0.1224 |
|
|
|
|
| |
LDL-C ≤79 mg/dL |
LDL-C 80–119 mg/dL |
LDL-C 120–159 mg/dL |
LDL-C ≥160 mg/dL |
| N |
OR |
95% CI |
P value |
N |
OR |
95% CI |
P value |
N |
OR |
95% CI |
P value |
N |
OR |
95% CI |
P value |
| Non-obesec |
704 |
2.956 |
1.446–
6.164 |
0.0031 |
3,803 |
1.970 |
1.462–
2.659 |
<0.0001 |
3,582 |
1.183 |
0.917–
1.526 |
0.1949 |
857 |
1.009 |
0.642–
1.587 |
0.9681 |
| Normotensived |
697 |
2.519 |
1.270–
5.063 |
0.0084 |
4,186 |
1.591 |
1.226–
2.064 |
<0.0001 |
4,153 |
1.083 |
0.874–
1.342 |
0.4638 |
1,126 |
0.966 |
0.682–
1.370 |
0.8497 |
| Non-diabetice |
762 |
2.271 |
1.175–
4.437 |
0.0141 |
4,554 |
1.663 |
1.295–
2.138 |
<0.0001 |
4,603 |
1.089 |
0.886–
1.341 |
0.4132 |
1,224 |
0.962 |
0.681–
1.358 |
0.8257 |
aAdjusted for age, HDL-C, BMI, smoking, alcohol drinking, SBP, serum creatinine, blood glucose, and uric acid level. b–eAdjusted for age, sex, HDL-C, BMI, smoking, alcohol drinking, SBP, serum creatinine, blood glucose, and uric acid level. Abbreviations as in Tables 1–3.
Discussion
In this cross-sectional study of a Japanese general population, we demonstrated that high TG levels were significantly associated with high baPWV measurements in subjects with LDL-C ≤119 mg/dL, but not in those with LDL-C ≥120 mg/dL. To the best of our knowledge, this is the first study to demonstrate differences in the association between high TG levels and high baPWV measurements according to LDL-C levels.
Elevated LDL-C is an established risk factor for CVD, and LDL-C lowering therapy with statins reduces the risk of cardiovascular events.1,14
However, CVD is not completely prevented even with a potent statin-based LDL-C lowering protocol. One of the possible residual risks of CVD is hypertriglyceridemia.2,3
There are several studies that have investigated the association between TG level and CVD, but the results are controversial. Some studies reported that TG is an independent risk factor for coronary artery disease,6,15
but others reported that the independence of TG was diminished after adjustment for HDL-C levels and other lipids.8
On the other hand, few studies have investigated the association between TG and arterial stiffness. The components of metabolic syndrome, including TG, were positively correlated with arterial stiffness measured by baPWV in 537 middle-aged subjects undergoing health checkups,16
and lower TG levels were significantly associated with decreases in carotid-femoral PWV in 1,447 subjects from a community-based population.17
Conversely, Dabelea et al reported that TG levels were not significantly associated with carotid-femoral PWV in 298 youths with type 1 diabetes.18
Meanwhile, no study has evaluated TG as a cardiovascular risk factor with stratification according to LDL-C levels. The present study’s results are meaningful because we showed that high TG levels in subjects with low LDL-C levels were significantly associated with increased arterial stiffness, which is a recognized strong predictor of CVD as well as cardiovascular death.19,20
In this study, high TG levels were associated with increased baPWV only in subjects with relatively low LDL-C levels. The previous studies reported that elevated TG was independently associated with an increased risk for CVD in non-obese, normotensive, or non-diabetic subjects,21
and that serum TG levels were an independent risk factor for coronary artery disease in those aged less than under 60 years.22
Another report showed that TG was more strongly correlated with baPWV in women than in men.16
We conducted subgroup analyses for those populations reported to have associations between TG levels and CVD. Similar to the analysis of all subjects, there was a significant association between high TG and high baPWV in subjects with LDL-C ≤119 mg/dL in each subgroup. Considering that TG is a weaker risk factor compared with established risk factors, such as aging, obesity, HT, DM, and male sex, and that the influence of TG is hidden in the presence of these stronger risk factors, this result may be acceptable. Similarly, the role of TG as a CVD risk factor may become significant only in subjects with a relatively low risk of CVD, because TG is a weaker risk factor than LDL-C.
The results of this study suggested that TG-lowering therapy may be an additional therapeutic consideration in subjects whose LDL-C levels are excessively high. In fact, it is still unclear whether an intervention to reduce hypertriglyceridemia can reduce cardiovascular events. A previous study reported that on-treatment TG <150 mg/dL affects coronary artery disease after adjustment for LDL-C levels.23
However, several treatments that decrease TG levels, including fibrates and fish oils, have failed to reduce the risk of coronary artery disease in previous randomized controlled trials.24,25
The combined use of statins and fibrates in patients with high LDL and hypertriglyceridemia is known to cause rhabdomyolysis more frequently than statins only,26
and that makes it difficult to treat dyslipidemia. We should make efforts to determine which TG-lowering therapy is effective in reducing CVD events, as well as to identify the patients who are able to benefit from such lipid-lowering therapy.
Study Limitations
First, we were unable to verify a causal relationship between high TG levels and high baPWV measurements and determine the predictive value of high TG on increased baPWV because of the cross-sectional design. Second, the subjects of this study were limited to participants undergoing health checkups at a single facility in Japan. Third, we did not include data regarding medications, such as vasodilators or renin-angiotensin system inhibitors, or menopause, both of which may influence baPWV levels in women. However, our study had certain strengths, including a large population-based sample with very little missing data about habitual behaviors and laboratory measurements, which contributed to reducing selection biases.
In conclusion, we demonstrated an independent association between high TG levels and increased arterial stiffness measured by baPWV in subjects with LDL-C ≤119 mg/dL in a large Japanese general population, suggesting that TG-lowering therapy might be an additional therapeutic consideration for these subjects. Further prospective study is needed to confirm these results.
Conflict of Interest
None declared.
Acknowledgments
We appreciate the medical staff in Kagoshima Kouseiren Medical Health Care Center for their assistance in the data collection.
Funding
This study did not receive any specific funding.
References
- 1.
Nakamura H, Arakawa K, Itakura H, Kitabatake A, Goto Y, Toyota T, et al. Primary prevention of cardiovascular disease with pravastatin in Japan (MEGA Study): A prospective randomized controlled trial. Lancet 2006; 368: 1155–1163.
- 2.
Fruchart JC, Sacks F, Hermans MP, Assmann G, Brown WV, Ceska R, et al. The Residual Risk Reduction Initiative: A call to action to reduce residual vascular risk in patients with dyslipidemia. Am J Cardiol 2008; 102: 1K–34K.
- 3.
Reiner Z. Managing the residual cardiovascular disease risk associated with HDL-cholesterol and triglycerides in statin-treated patients: A clinical update. Nutr Metab Cardiovasc Dis 2013; 23: 799–807.
- 4.
Kon V, Yang H, Fazio S. Residual cardiovascular risk in chronic kidney disease: Role of high-density lipoprotein. Arch Med Res 2015; 46: 379–391.
- 5.
Huang WM, Hsu PF, Cheng HM, Lu DY, Cheng YL, Guo CY, et al. Determinants and prognostic impact of hyperuricemia in hospitalization for acute heart failure. Circ J 2016; 80: 404–410.
- 6.
Criqui MH, Heiss G, Cohn R, Cowan LD, Suchindran CM, Bangdiwala S, et al. Plasma triglyceride level and mortality from coronary heart disease. N Engl J Med 1993; 328: 1220–1225.
- 7.
Tirosh A, Rudich A, Shochat T, Tekes-Manova D, Israeli E, Henkin Y, et al. Changes in triglyceride levels and risk for coronary heart disease in young men. Ann Intern Med 2007; 147: 377–385.
- 8.
Emerging Risk Factors Collaboration, Di Angelantonio E, Sarwar N, Perry P, Kaptoge S, Ray KK, Thompson A, et al. Major lipids, apolipoproteins, and risk of vascular disease. JAMA 2009; 302: 1993–2000.
- 9.
Yamashina A, Tomiyama H, Takeda K, Tsuda H, Arai T, Hirose K, et al. Validity, reproducibility, and clinical significance of noninvasive brachial-ankle pulse wave velocity measurement. Hypertens Res 2002; 25: 359–364.
- 10.
Kubozono T, Miyata M, Kawasoe S, Ojima S, Yoshifuku S, Miyahara H, et al. High pulse wave velocity has a strong impact on early carotid atherosclerosis in a Japanese general male population. Circ J 2017; 81: 310–315.
- 11.
Yamashina A, Tomiyama H, Arai T, Hirose K, Koji Y, Hirayama Y, et al. Brachial-ankle pulse wave velocity as a marker of atherosclerotic vascular damage and cardiovascular risk. Hypertens Res 2003; 26: 615–622.
- 12.
Genest J Jr, McNamara JR, Ordovas JM, Jenner JL, Silberman SR, Anderson KM, et al. Lipoprotein cholesterol, apolipoprotein A-I and B and lipoprotein (a) abnormalities in men with premature coronary artery disease. J Am Coll Cardiol 1992; 19: 792–802.
- 13.
Imano H, Noda H, Kitamura A, Sato S, Kiyama M, Sankai T, et al. Low-density lipoprotein cholesterol and risk of coronary heart disease among Japanese men and women: The Circulatory Risk in Communities Study (CIRCS). Prev Med 2011; 52: 381–386.
- 14.
Mills EJ, Rachlis B, Wu P, Devereaux PJ, Arora P, Perri D. Primary prevention of cardiovascular mortality and events with statin treatments: A network meta-analysis involving more than 65,000 patients. J Am Coll Cardiol 2008; 52: 1769–1781.
- 15.
Laakso M, Lehto S, Penttilä I, Pyorala K. Lipids and lipoproteins predicting coronary heart disease mortality and morbidity in patients with non-insulin-dependent diabetes. Circulation 1993; 88: 1421–1430.
- 16.
Kim HL, Lee JM, Seo JB, Chung WY, Kim SH, Zo JH, et al. The effects of metabolic syndrome and its components on arterial stiffness in relation to gender. J Cardiol 2015; 65: 243–249.
- 17.
Wang X, Ye P, Cao R, Yang X, Xiao W, Zhang Y, et al. Triglycerides are a predictive factor for arterial stiffness: A community-based 4.8-year prospective study. Lipids Health Dis 2016; 15: 97.
- 18.
Dabelea D, Talton JW, D’Agostino R Jr, Wadwa RP, Urbina EM, Dolan LM, et al. Cardiovascular risk factors are associated with increased arterial stiffness in youth with type 1 diabetes: The SEARCH CVD study. Diabetes Care 2013; 36: 3938–3943.
- 19.
van Popele NM, Grobbee DE, Bots ML, Asmar R, Topouchian J, Reneman RS, et al. Association between arterial stiffness and atherosclerosis: The Rotterdam Study. Stroke 2001; 32: 454–460.
- 20.
Laurent S, Boutouyrie P, Asmar R, Gautier I, Laloux B, Guize L, et al. Aortic stiffness is an independent predictor of all-cause and cardiovascular mortality in hypertensive patients. Hypertension 2001; 37: 1236–1241.
- 21.
Kim EH, Lee JB, Kim SH, Jo MW, Hwang JY, Bae SJ, et al. Serum triglyceride levels and cardiovascular disease events in Koreans. Cardiology 2015; 131: 228–235.
- 22.
Castelli WP. The triglyceride issue: A view from Framingham. Am Heart J 1986; 112: 432–437.
- 23.
Miller M, Cannon CP, Murphy SA, Qin J, Ray KK, Braunwald E, et al. Impact of triglyceride levels beyond low-density lipoprotein cholesterol after acute coronary syndrome in the PROVE IT-TIMI 22 trial. J Am Coll Cardiol 2008; 51: 724–730.
- 24.
ACCORD Study Group, Ginsberg HN, Elam MB, Lovato LC, Crouse JR 3rd, Leiter LA, Linz P, et al. Effects of combination lipid therapy in type 2 diabetes mellitus. N Engl J Med 2010; 362: 1563–1574.
- 25.
ORIGIN Trial Investigators, Bosch J, Gerstein HC, Dagenais GR, Díaz R, Dyal L, Jung H, et al. n-3 fatty acids and cardiovascular outcomes in patients with dysglycemia. N Engl J Med 2012; 367: 309–318.
- 26.
Graham DJ, Staffa JA, Shatin D, Andrade SE, Schech SD, La Grenade L, et al. Incidence of hospitalized rhabdomyolysis in patients treated with lipid-lowering drugs. JAMA 2004; 292: 2585–2590.