Abstract
Background:
There are few reports about the differences between drug-eluting stents (DES) and bare metal stents (BMS) in neoatherosclerosis associated with in-stent restenosis (ISR), so we compared the frequency and characteristics of neoatherosclerosis with ISR evaluated by optical coherence tomography (OCT) in the present study.
Methods and Results:
Between March 2009 and November 2016, 98 consecutive patients with ISR who underwent diagnostic OCT were enrolled: 34 patients had a BMS, 34 had a 1st-generation DES, and 30 had a 2nd-generation DES. Neoatherosclerosis was defined as a lipid neointima (including a thin-cap fibroatheroma [TCFA] neointima, defined as a fibroatheroma with a fibrous cap <65 µm) or calcified neointima. As a result, lipid neointima, TCFA neointima and calcified neointima were detected in 39.8%, 14.3%, and 5.1%, respectively, of all patients. The frequency of neoatherosclerosis was significantly greater with DES than BMS (48.4% vs. 23.5%, P=0.018). The minimum fibrous cap thickness was significantly thicker with DES than BMS (110.3±41.1 µm vs. 62.5±17.1 µm, P<0.001). In addition, longitudinal extension of neoatherosclerosis in the stented segment was less with DES than BMS (20.2±15.1% vs. 71.8±27.1%, respectively, P=0.001).
Conclusions:
OCT imaging demonstrated that neoatherosclerosis with ISR was more frequent with DES than BMS and its pattern exhibited a more focal and thick fibrous cap as compared with BMS.
Several randomized clinical trials have demonstrated that drug-eluting stents (DES) dramatically improve angiographic restenosis and the incidence of repeat revascularization.1,2
However, in-stent restenosis (ISR) is still a major problem of percutaneous coronary intervention (PCI), both with bare metal stents (BMS) and DES.3,4
Morphological assessment of the neointimal tissue, including neoatherosclerosis estimated by optical coherence tomography (OCT), is important for clarifying the pathophysiology of ISR lesions. Gonzalo et al investigated and classified the neointimal characteristics of ISR by OCT,5
but there were few reports of the differences between BMS and DES in the tissue characteristics and neoatherosclerosis patterns of ISR lesions evaluated by OCT.6,7
Therefore, we systematically analyzed patients with ISR and compared their OCT findings for BMS and DES.
Methods
Patient Population
We included all consecutive patients with ISR who underwent diagnostic OCT imaging between March 2009 and November 2016. In this study, ISR was defined as an in-stent lesion with both a stenosis diameter of 50–99% by visual assessment and objective signs of myocardial ischemia or symptoms of angina pectoris. The study exclusion criteria were a recurrence of ISR, hemodynamic instability, age less than 18 years, and life expectancy of less than 6 months from a non-cardiac condition (Figure 1). Written informed consent was given by all participating patients and the protocol was approved by the local ethics committees.
OCT Image Acquisition
The OCT system used in this study consisted of a computer, monitor display, and interface unit (Model M2 Cardiology Imaging System, LightLab Imaging, Inc., Westford, MA, USA or C7XR Fourier-Domain System, St. Jude Medical, St. Paul, MN, USA). The patients received heparin intravenously before the OCT procedure. Using the M2 OCT system, an occlusion catheter (Helios, LightLab Imaging, Inc.) was used to remove blood. During image acquisition, the occlusion balloon was inflated to 0.4–0.6 atmospheres, and Ringer’s lactate was continuously infused at 0.3–0.5 mL/s. The imaging catheter was pulled back from distal to proximal with a motorized system at 1.5 mm/s, and continuous images throughout the entire stent segment were digitally stored for subsequent analysis.8
Using the C7 OCT system, a conventional angioplasty guidewire (0.014-inch) was advanced distal to the region of interest, then the 2.7-F FD-OCT catheter (Dragonfly, St. Jude Medical) was advanced over the guidewire beyond the region of interest. During image acquisition, blood was displaced by an injection of iso-osmolar contrast dye.9
In general, in patients presenting with Thrombolysis in Myocardial Infarction (TIMI) flow grade 2 or 3, OCT was performed before any intervention, whereas for those with a TIMI 0 or 1, OCT was performed after predilatation using only small-sized balloons. The images were calibrated by an automated adjustment of the Z-offset and the automated pullback was set at 20 mm/s. Data were acquired using a commercially available OCT system (C7-XR, OCT Imaging System, St. Jude Medical) and were digitally stored.
OCT Image Analysis
The images were analyzed by 2 independent investigators blinded to the angiographic and clinical data. They used dedicated software with an automated contour-detection algorithm (Off-line Review Software, version E.0.2, St. Jude Medical). All cross-sectional images were initially screened by a quality assessment and excluded from the analysis if any portion of the stent was not in view, a side branch occupied >45% of the cross-section, or the image had poor quality caused by residual blood, artifact, or reverberations. A qualitative image assessment was performed for every frame, whereas quantitative measurements were performed every 1 mm along the entire stented segment. For the morphometric analysis, standard definitions of the cross-sectional area and volume measurements were applied as previously reported.8
The cross-sectional areas of the stent, lumen, and neointimal hyperplasia were measured at 1.0-mm axial increments throughout the entire length of the stent. The proximal and distal references were measured at the site with the largest lumen within 5 mm proximal and distal to the stented segment. The strut-lumen distance was based on automated measurements performed from the center of the strut blooming to the luminal contour of the artery wall. Stent underexpansion was defined when the minimum stent area/mean (proximal and distal) reference area was less than 80% if both references were available, less than 90% if only the distal reference was available, or less than 70% if only the proximal reference was available. The neointima was defined as the tissue between the luminal and stent contours. A homogeneous neointima was identified as having signal-rich regions with low attenuation. A calcified neointima had a well-delineated, signal-poor region with sharp borders. A lipid neointima was defined as having signal-poor regions with diffuse borders and high attenuation.9
Neoatherosclerosis was defined as a lipid or calcified neointima.9
In the lipid neointima, the fibrous cap thickness was computed as the mean of 3 evenly distributed measurements along the fibrous cap.10
A thin-cap fibroatheroma (TCFA) neointima was defined as a lipid neointima with a fibrous cap thickness ≤65 µm at the thinnest part. A microvessel was defined as a small vesicular or tubular structure with diameter ≤200 µm.11
Statistical Analysis
All statistical analyses were performed using JMP 11 software (SAS Institute, Inc., Cary, NC, USA). Continuous variables are expressed as the mean±SD or median (interquartile range) and categorical variables as the count (percentage). For continuous variables, the difference between DES and BMS for all patients or patients with neoatherosclerosis was analyzed by a Mann-Whitney U test and categorical variables were compared using Fisher’s exact test.
Results
Clinical and Lesion Characteristics
A total of 115 patients with ISR were deemed suitable for this study. After exclusion of 17 lesions because of recurrent lesion, edge lesion and bad OCT image quality, 98 patients with ISR were enrolled. The patient and lesion characteristics of the BMS and DES are shown in
Table 1
and
Table 2, respectively. There were no significant differences between the 2 groups in the patient and lesion characteristics except for the stent length and diameter. The stent length was significantly longer (25.0±6.0 vs. 20.9±5.9 mm, P=0.028) and stent diameter significantly smaller (2.9±0.4 vs. 3.3±0.4 mm, P<0.001) in the DES group than the BMS. There were no significant differences in the duration between ISR presentation and the implantation of the stent (Table 1). Stent overlapping was observed in 3 cases, while stent fracture was observed in 2 cases.
Table 1.
Patients’ Characteristics
| |
BMS
(n=34) |
DES
(n=64) |
P value |
| Age, years |
70.2±10.3 |
67.3±10.9 |
0.208 |
| Male |
30 (88.2) |
48 (75.0) |
0.187 |
| Smoking |
10 (29.4) |
26 (40.6) |
0.379 |
| Hypertension |
26 (76.4) |
50 (78.1) |
1.000 |
| Diabetes mellitus |
12 (35.2) |
25 (39.0) |
0.828 |
| Dyslipidemia |
21 (61.8) |
36 (56.3) |
0.670 |
| CAD presentation |
|
|
1.000 |
| Stable angina |
32 (94.1) |
61 (95.3) |
|
| Unstable angina |
2 (5.9) |
3 (4.7) |
|
BMS, bare metal stent; CAD, coronary artery disease; DES, drug-eluting stent.
Table 2.
Lesion Characteristics
| |
BMS
(n=34) |
DES
(n=64) |
P value |
| Stent duration, months |
8 (6–84) |
22 (8–48) |
0.076 |
| Stent length, mm |
20.9±5.9 |
25.0±6.0 |
0.028 |
| Stent diameter, mm |
3.3±0.4 |
2.9±0.4 |
<0.001 |
| Lesion location |
|
|
0.159 |
| Left anterior descending |
14 (41.2) |
37 (57.8) |
|
| Right coronary artery |
16 (47.1) |
22 (34.4) |
|
| Left circumflex |
4 (11.8) |
5 (7.8) |
|
| Stent type |
| BMS |
34 (100) |
– |
– |
| Sirolimus-eluting stent |
– |
24 (37.5) |
|
| Paclitaxel-eluting stent |
– |
10 (15.6) |
|
| Zotarolimus-eluting stent |
– |
5 (7.8) |
|
| Everolimus-eluting stent |
– |
19 (29.7) |
|
| Biolimus-eluting stent |
– |
6 (9.4) |
|
BMS, bare metal stent; DES, drug-eluting stent.
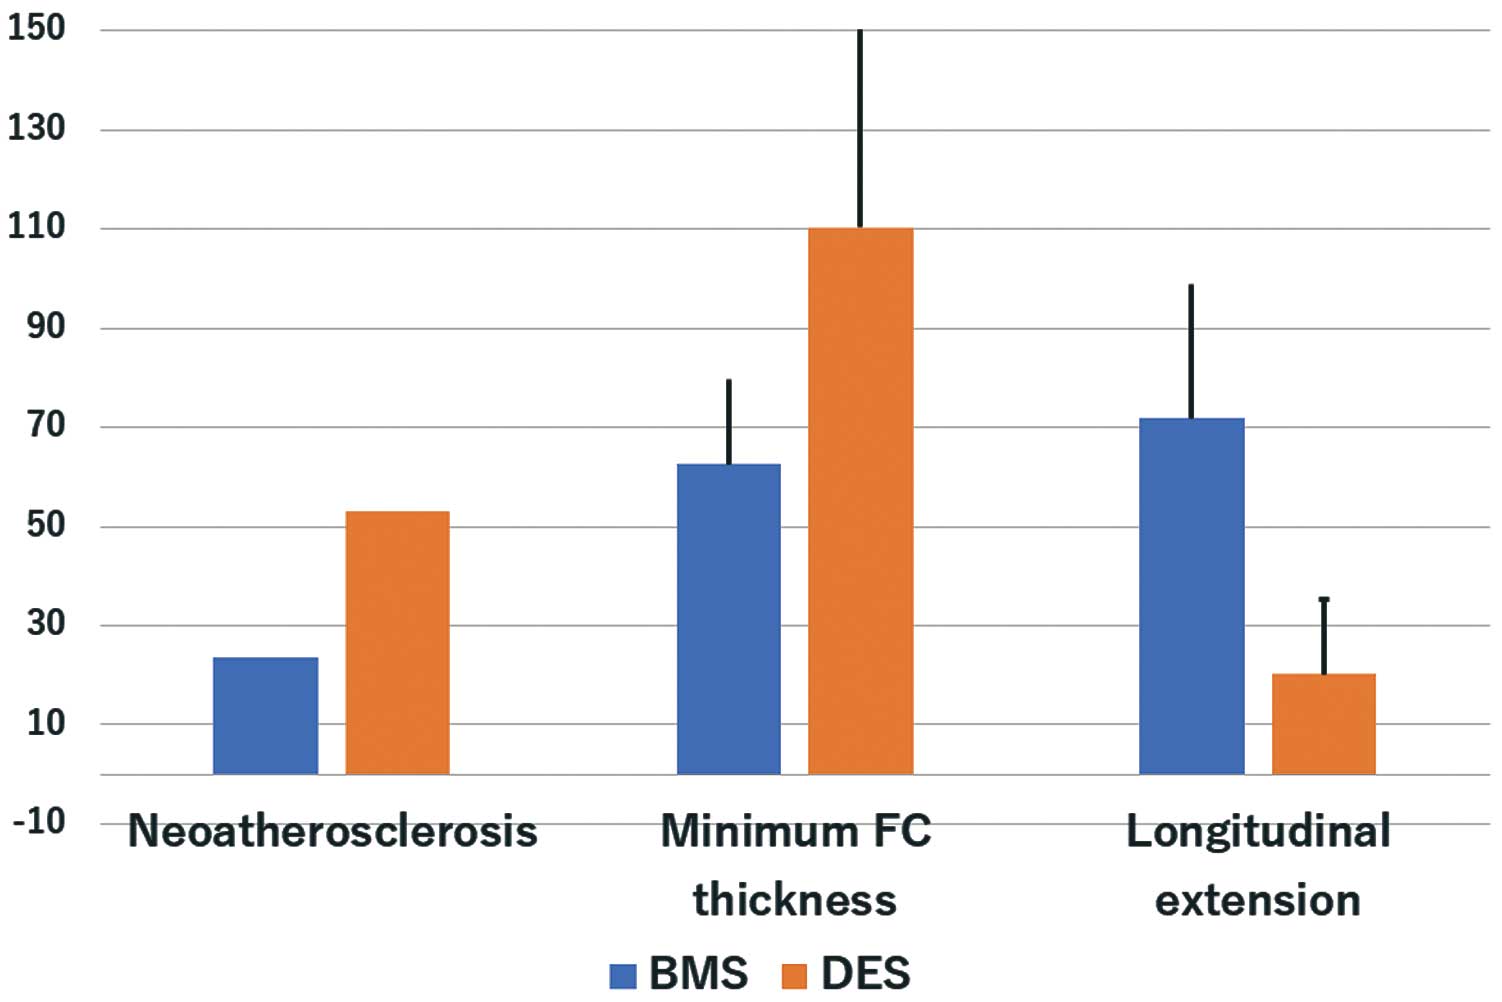
There were no significant differences in the minimum lumen area of the 2 groups. The minimum stent area was significantly lower in the DES group than in the BMS group (5.88±1.50 vs. 6.81±1.71 mm2, P=0.026). Overall, a lipid neointima, TCFA neointima, and calcified neointima were detected in 42.9%, 14.3%, and 5.1% of patients, respectively. The frequency of neoatherosclerosis and a lipid neointima was significantly greater in the DES than the BMS group (53.1% vs. 23.5%, P=0.006 and 53.1% vs. 23.5%, P=0.006). There were no significant differences in calcified neointima (Table 3). The minimum fibrous cap thickness was significantly greater in the DES than in the BMS group (110.3±41.1 vs. 62.5±17.1 µm, respectively, P<0.001). The percentage of frames (longitudinal extension) with neoatherosclerosis in the entire stent segment was significantly lower in the DES than in the BMS group (20.2±15.1% vs. 71.8±27.1%, P=0.001) (Figure 2). We show representative ISR cases after BMS and DES implantation in
Figure 3. Diffuse lipid and calcified neointima were observed in the BMS case, whereas in DES case, lipid neointima was observed only in the distal site.
Table 3.
Analysis of Neointima
| |
BMS
(n=34) |
DES
(n=64) |
P value |
| Minimum lumen area, mm2 |
1.18±0.40 |
1.25±0.52 |
0.556 |
| Minimum stent area, mm2 |
6.81±1.71 |
5.88±1.50 |
0.026 |
| Neointima thickness, mm |
0.56±0.16 |
0.46±0.15 |
0.016 |
| Neointimal characteristics |
| Homogeneous |
9 (26.5) |
13 (20.3) |
0.612 |
| Heterogeneous |
17 (50.0) |
17 (26.6) |
0.026 |
| Neoatherosclerosis |
8 (23.5) |
34 (53.1) |
0.006 |
| Lipid |
8 (23.5) |
34 (53.1) |
0.006 |
| TCFA |
6 (17.6) |
8 (12.5) |
0.550 |
| Calcified |
1 (2.9) |
4 (6.3) |
0.656 |
| Microvessel |
1 (2.9) |
2 (3.1) |
0.725 |
BMS, bare metal stent; DES, drug-eluting stent; TCFA, thin-cap fibroatheroma.
Comparing the BMS, and the 1st- and 2nd-generation DES, stent duration was significantly shorter with 2nd-generation DES compared with the other 2 groups (Table 4). Neoatherosclerosis was most frequent in the 1st-generation DES among the 3 groups (BMS 23.5%, 1st DES 73.5% and 2nd DES 30.0%, P<0.001) and the minimum fibrous cap thickness was least in BMS (BMS 62.5±17.1 µm, 1st DES 101.2±37.3 µm and 2nd DES 131.4±17.3 µm, P=0.002) (Table 4). Focusing only on ISR lesions with stent duration <2 years, neoatherosclerosis was still more frequent in 1st-generation DES (68.4 %) compared with BMS (9.2%) and 2nd-generation DES (30.0 %) (P<0.001). Longitudinal extension of neoatherosclerosis was still significantly greater in BMS and lowest in 2nd-generation DES (BMS 30.0±14.1 %, 1st DES 19.3±4.7% and 2nd DES 7.8 ±12.9%, P=0.041) (Table 5).
Table 4.
Comparison of OCT Data for BMS and 1st- and 2nd-Generation DES
| |
BMS
(n=34) |
1st-generation DES
(n=34) |
2nd-generation DES
(n=30) |
P value |
| Stent duration, months |
50.4±73.1 |
54.0±42.5 |
15.3±8.1 |
0.005 |
| Minimum lumen area, mm2 |
1.18±0.40 |
1.41±0.70 |
1.20±0.40 |
0.146 |
| Minimum stent area, mm2 |
6.81±1.71 |
6.06±1.51 |
5.69±1.51 |
0.063 |
| Neointima thickness, mm |
0.56±0.16 |
0.47±0.15 |
0.45±0.16 |
0.048 |
| Neoatherosclerosis |
8 (23.5) |
25 (73.5) |
9 (30.0) |
<0.001 |
| Fibrous cap thickness, μm |
62.5±17.1 |
101.2±37.3 |
131.4±17.3 |
0.002 |
| Longitudinal extension of neoatherosclerosis, % |
71.8±27.1 |
21.6±15.1 |
7.8±12.9 |
<0.001 |
BMS, bare metal stent; DES, drug-eluting stent; OCT, optical coherence tomography.
Table 5.
Comparison of OCT Data for BMS and 1st- and 2nd-Generation DES If Stent Duration <2 Years
| |
BMS
(n=22) |
1st-generation DES
(n=19) |
2nd-generation DES
(n=30) |
P value |
| Neoatherosclerosis |
2 (9.2%) |
13 (68.4%) |
9 (30.0) |
<0.001 |
| Fibrous cap thickness, μm |
85.0±17.1 |
113.0±42.0 |
131.4±17.3 |
0.375 |
| Longitudinal extension of neoatherosclerosis, % |
30.0±14.1 |
19.3±4.7 |
7.8±12.9 |
0.041 |
BMS, bare metal stent; DES, drug-eluting stent; OCT, optical coherence tomography.
The target lesion revascularization (TLR) at 1-year follow up was significantly more frequent in ISR lesions with neoatherosclerosis compared with those without neoatherosclerosis (43.9% vs. 23.6%, P=0.039). TLR rates was higher in both BMS and DES with neoatherosclerosis, but did not reach statistical significance (28.6% vs. 11.5%, P=0.294 in BMS and 41.2% vs. 27.6%, P=0.253 in DES).
Discussion
The present study had a large number of cases of ISR analyzed by OCT. The major findings were: (1) the frequency of neoatherosclerosis was significantly greater in the DES than in the BMS group, (2) longitudinal extension of neoatherosclerosis in the stent segment was significantly less in the DES than in the BMS group, and (3) the minimum fibrous cap thickness was significantly greater in the DES than in the BMS group.
The mechanism of the ISR lesions in BMS and 1st-generation DES has been investigated in several papers. A recent intravascular ultrasound and OCT study demonstrated that ISR was mainly caused by stent underexpansion.12,13
A pathological study showed that neoatherosclerosis associated with ISR was an important factor in both the BMS and DES groups.14
Moreover, neoatherosclerosis has been consistently correlated with late thrombotic events post stent implantation.14–18
One pathological study demonstrated that in-stent neoatherosclerosis was significantly more frequent with 1st-generation DES than with BMS,14
which was consistent with the results of the present study.
The present study showed that neoatherosclerosis had a more diffuse pattern in the BMS group than the DES group, which was consistent with a previous study that demonstrated a difference between BMS and DES in the neoatherosclerosis patterns of very late stent thrombosis.9
This might be caused by different mechanisms of neoatherosclerosis in DES and BMS. In-stent neoatherosclerosis is observed years after stent implantation and more rapidly with DES as compared with BMS.19
It has been demonstrated that accelerated neoatherosclerosis after DES implantation is likely to be a direct consequence of delayed vascular healing and inflammation caused by the antiproliferative drug and polymer; however, a continuous correlation of the magnitude with the degree of delayed vascular healing cannot be concluded to date.20
On the other hand, longitudinal extension of neoatherosclerosis in BMS correlates with the time after implantation.9
Our data supported the concept that neoatherosclerosis with DES is more aggressive and progresses to acute coronary syndrome earlier than with BMS.10
The present study demonstrated that the minimum fibrous cap thickness was significantly greater in the DES than in the BMS group. One of the reasons could be differences between BMS and DES in the mechanism of neoatherosclerosis. One histological paper demonstrated that accelerated neoatherosclerosis after DES is likely a direct consequence of delayed vascular healing and inflammation caused by the antiproliferative drug and polymer, whereas in BMS the neoatherosclerotic change might be similar to the mechanism of atherosclerosis in the native vessel.6
The other reason is the relatively long duration between stent implantation and ISR with BMS, which allows degeneration of the neointima to lipid-rich lesions.14
A yellow color of the luminal surface, found on angioscopy, generally represents superficial lipid and vulnerability, and corresponds to TCFA.21,22
Because it has been reported that the fibrous cap thickness measured by OCT is significantly less in yellow plaques than in white plaques detected by angioscopy,23
neoatherosclerosis with BMS might be more vulnerable than that with DES.
For interventional cardiologists, the therapeutic strategy for ISR still remains a challenge and there is no current consensus on how to treat ISR. However, getting an accurate diagnosis based on the characteristics of ISR is important for appropriate therapy. The present findings might be helpful for deciding the treatment strategy for ISR. The differences in the frequency, longitudinal extension, and vulnerability of neoatherosclerosis are clinically important to potentially help customize the interventional strategy in this setting. For example, the required extension (diffuse vs. focal) and type of intervention (i.e., plain-balloon, drug-eluting balloon and stent implantation) may differ between BMS and DES. Tanaka et al demonstrated that inadequate angiographic results, defined as residual stenosis or major neointimal dissections, were significantly more frequent with the diffuse type of ISR as compared with the focal type, and resulted in TLR.24
Accordingly, a DES implantation strategy might be selected in patients with ISR and a BMS because it has a more diffuse neoatherosclerotic pattern than a DES implantation.
Study Limitations
First, this was an observational study and the population size was underpowered. Second, there were no serial OCT data at the time of stent implantation. Third, there was no control group and no long-term clinical outcome data. Fourth, only ISR lesions with OCT imaging were enrolled, so there was a possible selection bias.
Conclusions
OCT imaging demonstrated that neoatherosclerosis associated with ISR was more frequent with DES than with BMS and there was a more focal and thick fibrous cap.
Acknowledgment
The authors thank Mr. John Martin for his linguistic assistance.
References
- 1.
Morice MC, Serruys PW, Sousa JE, Fajadet J, Ban Hayashi E, Perin M, et al. A randomized comparison of a sirolimus-eluting stent with a standard stent for coronary revascularization. N Engl J Med 2002; 346: 1773–1780.
- 2.
Stone GW, Rizvi A, Newman W, Mastali K, Wang JC, Caputo R, et al. Everolimus-eluting versus paclitaxel-eluting stents in coronary artery disease. N Engl J Med 2010; 362: 1663–1674.
- 3.
Doi H, Maehara A, Mintz GS, Yu A, Wang H, Mandinov L, et al. Impact of post-intervention minimal stent area on 9-month follow-up patency of paclitaxel-eluting stents: An integrated intravascular ultrasound analysis from the Taxus IV, V, and VI and Taxus Atlas Workhorse, Long Lesion, and Direct Stent trials. JACC Cardiovasc Interv 2009; 2: 1269–1275.
- 4.
Song HG, Kang SJ, Ahn JM, Kim WJ, Lee JY, Park DW, et al. Intravascular ultrasound assessment of optimal stent area to prevent in-stent restenosis after zotarolimus-, everolimus-, and sirolimus-eluting stent implantation. Catheter Cardiovasc Interv 2014; 83: 873–878.
- 5.
Gonzalo N, Serruys PW, Okamura T, van Beusekom HM, Garcia-Garcia HM, van Soest G, et al. Optical coherence tomography patterns of stent restenosis. Am Heart J 2009; 158: 284–293.
- 6.
Otsuka F, Byrne RA, Yahagi K, Mori H, Ladich E, Fowler DR, et al. Neoatherosclerosis: Overview of histopathologic findings and implications for intravascular imaging assessment. Eur Heart J 2015; 36: 2147–2159.
- 7.
Stettler R, Dijkstra J, Raber L, Torii R, Zhang YJ, Karanasos A, et al. Neointima and neoatherosclerotic characteristics in bare metal and first- and second-generation drug-eluting stents in patients admitted with cardiovascular events attributed to stent failure: An optical coherence tomography study. EuroIntervention 2018; 13: e1831–e1840.
- 8.
Nakamura D, Lee Y, Yoshimura T, Taniike M, Makino N, Kato H, et al. Different serial changes in the neointimal condition of sirolimus-eluting stents and paclitaxel-eluting stents: An optical coherence tomographic study. EuroIntervention 2014; 10: 924–933.
- 9.
Nakamura D, Attizzani GF, Toma C, Sheth T, Wang W, Soud M, et al. Failure mechanisms and neoatherosclerosis patterns in very late drug-eluting and bare-metal stent thrombosis. Circ Cardiovasc Interv 2016; 9: e003785.
- 10.
Guagliumi G, Capodanno D, Saia F, Musumeci G, Tarantini G, Garbo R, et al. Mechanisms of atherothrombosis and vascular response to primary percutaneous coronary intervention in women versus men with acute myocardial infarction: Results of the OCTAVIA study. JACC Cardiovasc Interv 2014; 7: 958–968.
- 11.
De Cock D, Bennett J, Ughi GJ, Dubois C, Sinnaeve P, Dhooge J, et al. Healing course of acute vessel wall injury after drug-eluting stent implantation assessed by optical coherence tomography. Eur Heart J Cardiovasc Imaging 2014; 15: 800–809.
- 12.
Goto K, Zhao Z, Matsumura M, Dohi T, Kobayashi N, Kirtane AJ, et al. Mechanisms and patterns of intravascular ultrasound in-stent restenosis among bare metal stents and first- and second-generation drug-eluting stents. Am J Cardiol 2015; 116: 1351–1357.
- 13.
Kang SJ, Mintz GS, Park DW, Lee SW, Kim YH, Whan Lee C, et al. Mechanisms of in-stent restenosis after drug-eluting stent implantation: Intravascular ultrasound analysis. Circ Cardiovasc Interv 2011; 4: 9–14.
- 14.
Nakazawa G, Otsuka F, Nakano M, Vorpahl M, Yazdani SK, Ladich E, et al. The pathology of neoatherosclerosis in human coronary implants bare-metal and drug-eluting stents. J Am Coll Cardiol 2011; 57: 1314–1322.
- 15.
Jang IK, Tearney GJ, MacNeill B, Takano M, Moselewski F, Iftima N, et al. In vivo characterization of coronary atherosclerotic plaque by use of optical coherence tomography. Circulation 2005; 111: 1551–1555.
- 16.
Hou J, Qi H, Zhang M, Ma L, Liu H, Han Z, et al. Development of lipid-rich plaque inside bare metal stent: Possible mechanism of late stent thrombosis? An optical coherence tomography study. Heart 2010; 96: 1187–1190.
- 17.
Yamaji K, Inoue K, Nakahashi T, Noguchi M, Domei T, Hyodo M, et al. Bare metal stent thrombosis and in-stent neoatherosclerosis. Circ Cardiovasc Interv 2012; 5: 47–54.
- 18.
Kang SJ, Mintz GS, Park DW, Lee SW, Kim YH, Lee CW, et al. Tissue characterization of in-stent neointima using intravascular ultrasound radiofrequency data analysis. Am J Cardiol 2010; 106: 1561–1565.
- 19.
Parodi G, La Manna A, Di Vito L, Valgimigli M, Fineschi M, Bellandi B, et al. Stent-related defects in patients presenting with stent thrombosis: Differences at optical coherence tomography between subacute and late/very late thrombosis in the mechanism of stent thrombosis (most) study. EuroIntervention 2013; 9: 936–944.
- 20.
Attizzani GF, Capodanno D, Ohno Y, Tamburino C. Mechanisms, pathophysiology, and clinical aspects of incomplete stent apposition. J Am Coll Cardiol 2014; 63: 1355–1367.
- 21.
Ueda Y, Ohtani T, Shimizu M, Hirayama A, Kodama K. Assessment of plaque vulnerability by angioscopic classification of plaque color. J Am Coll Cardiol 2004; 148: 333–335.
- 22.
Ohtani T, Ueda Y, Mizote I, Oyabu J, Okada K, Hirayama A, et al. Number of yellow plaques detected in a coronary artery is associated with future risk of acute coronary syndrome: Detection of vulnerable patients by angioscopy. J Am Coll Cardiol 2006; 47: 2194–2200.
- 23.
Takano M, Jang IK, Inami S, Yamamoto M, Murakami D, Okamatsu K, et al. In vivo comparison of optical coherence tomography and angioscopy for the evaluation of coronary plaque characteristics. Am J Cardiol 2008; 101: 471–476.
- 24.
Tanaka A, Latib A, Jabbour RJ, Kawamoto H, Giannini F, Ancona M, et al. Impact of angiographic result after predilatation on outcome after drug-coated balloon treatment of in-stent coronary restenosis. Am J Cardiol 2016; 118: 1460–1465.


