Abstract
Background:
Patients with severe aortic stenosis (AS) and an extra-large annulus (ELA) area (>683 mm2) can rarely be treated by transcatheter aortic valve replacement (TAVR) because of the size limitation of the transcatheter heart valves. This study aimed to evaluate the feasibility of TAVR using a 29-mm SAPIEN3 (S3) valve in patients with ELA and S3-dimensions by post-procedural computed tomography (post-CT).
Methods and Results:
We included 261 patients undergoing TAVR using a 29-mm S3: 30 patients with ELA and 231 with non-ELA were identified. S3-dimensions were evaluated at the S3 inflow and annulus level by post-CT in 129 patients. The ELA group had a greater aortic annulus area measured by pre-procedural CT (737.3±54.7 vs. 578.4±41.9 mm2, P<0.0001), higher balloon inflation volume (36 vs. 33 mL, P<0.0001), a larger S3 area at inflow by post-CT (729.6±42.2 vs. 682.2±35.0 mm2, P<0.001), and a correlation between the inflation volume and S3 area (r=0.71, P=0.0005). No differences were observed between groups in paravalvular aortic regurgitation (PAR) ≥mild (43.3% vs. 27.6%, P=0.09), PAR ≥moderate (3.3% vs. 1.3%, P=0.39) or 1-year mortality (10.0% vs. 9.1%, P=0.87).
Conclusions:
TAVR using a 29-mm S3 with extra inflation of the delivery balloon can be considered as a treatment option for patients with severe AS and ELA.
Transcatheter aortic valve replacement (TAVR) is an alternative treatment to surgical aortic valve replacement in patients with severe symptomatic aortic stenosis (AS) deemed to be at intermediate or high risk for surgery.1–4
The transcatheter heart valve (THV) and the relevant procedure have been developed for >20 years.5
However, because of the size limitation of the THV device, certain patients with severe AS have not been able to benefit from TAVR. For example, for the SAPIEN 3 (S3) valve, the most commonly used balloon-expandable THV among the newer generation,6–9
there are only 4 available sizes: 20, 23, 26 and 29 mm. The selection of the size of the device is based on the size of the patient’s aortic annulus and the sizing charts provided by the manufacturer. Thus, TAVR is limited by the currently available THV and the annulus size of the patients. According to the sizing chart, the lower limit of the annulus for 20-mm S3 is 273 mm2, while the upper limit for the 29-mm S3 is 683 mm2.10
Patients with an extra-large annulus (ELA) area >683 mm2
are more frequently encountered vs. those with an extremely small annulus. Therefore, the lack of information regarding the outcome of TAVR in patients with ELA is a concern in clinical practice. Despite the potential demand for TAVR in patients with ELA, the evidence available on the procedural and clinical outcomes is limited, which restricts the potential benefit of TAVR for patients with ELA.
A possible concern regarding TAVR using the S3 in patients with ELA is under-expansion of the THV in relation to the native aortic annulus, causing valve embolization or paravalvular aortic valve regurgitation (PAR).10,11
Although a few ex vivo studies showed that the S3 could be expanded beyond 683 mm2,12,13
there is not an in-vivo study showing the over-expanded S3 dimensions assessed by post-procedural computed tomography (CT) in patients with ELA. The safety of TAVR using the S3 in ELA patients has not been determined.
The objective of the present study was to investigate procedural outcomes, short-term mortality and THV dimensions of the 29-mm S3 according to post-procedural CT in patients with ELA who underwent TAVR for the treatment of severe AS.
Methods
Study Population
We included 261 consecutive patients who had undergone pre-procedural assessment by contrast-enhanced multidetector CT and then TAVR for severe AS using the 29-mm S3 at Cedars-Sinai Medical Center in Los Angeles, CA, USA, between October 2013 and November 2017. Follow-up post-procedural CT was performed in 129 patients. The present study complied with the principles of the Declaration of Helsinki and a locally appointed ethics committee approved the research protocol. Informed consent was given by all subjects.
Procedure
The Heart Team determined the inflation volume of the delivery balloon in consideration of the following: aortic annulus dimensions measured by pre-procedural CT and/or 3D transesophageal echocardiography, and the degree of calcification of the aortic valve leaflet and left ventricular outlet tract (LVOT).
Echocardiographic Assessment
Post-procedural transthoracic echocardiography was performed at the 30-day follow-up visit. In cases of patients lacking echocardiography results at the 30-day follow-up, the echocardiography findings prior to discharge or at the 3–6-month follow-up were used.
MDCT Image Analysis
The CT protocol is summarized in
Supplementary Methods. For annular and aortic valve complex and THV dimensions, curved multiplanar reconstruction (CMPR) analyses were performed using the 3Mensio ValvesTM
software (version 9.0, Pie Medical Imaging, Maastricht, the Netherlands) in a CT core laboratory.14
The measurement method of annular and aortic valve complex dimensions15–17
and LVOT calcium definition11,18,19
are also described in
Supplementary Methods.
THV Analysis on Post-Procedural CT
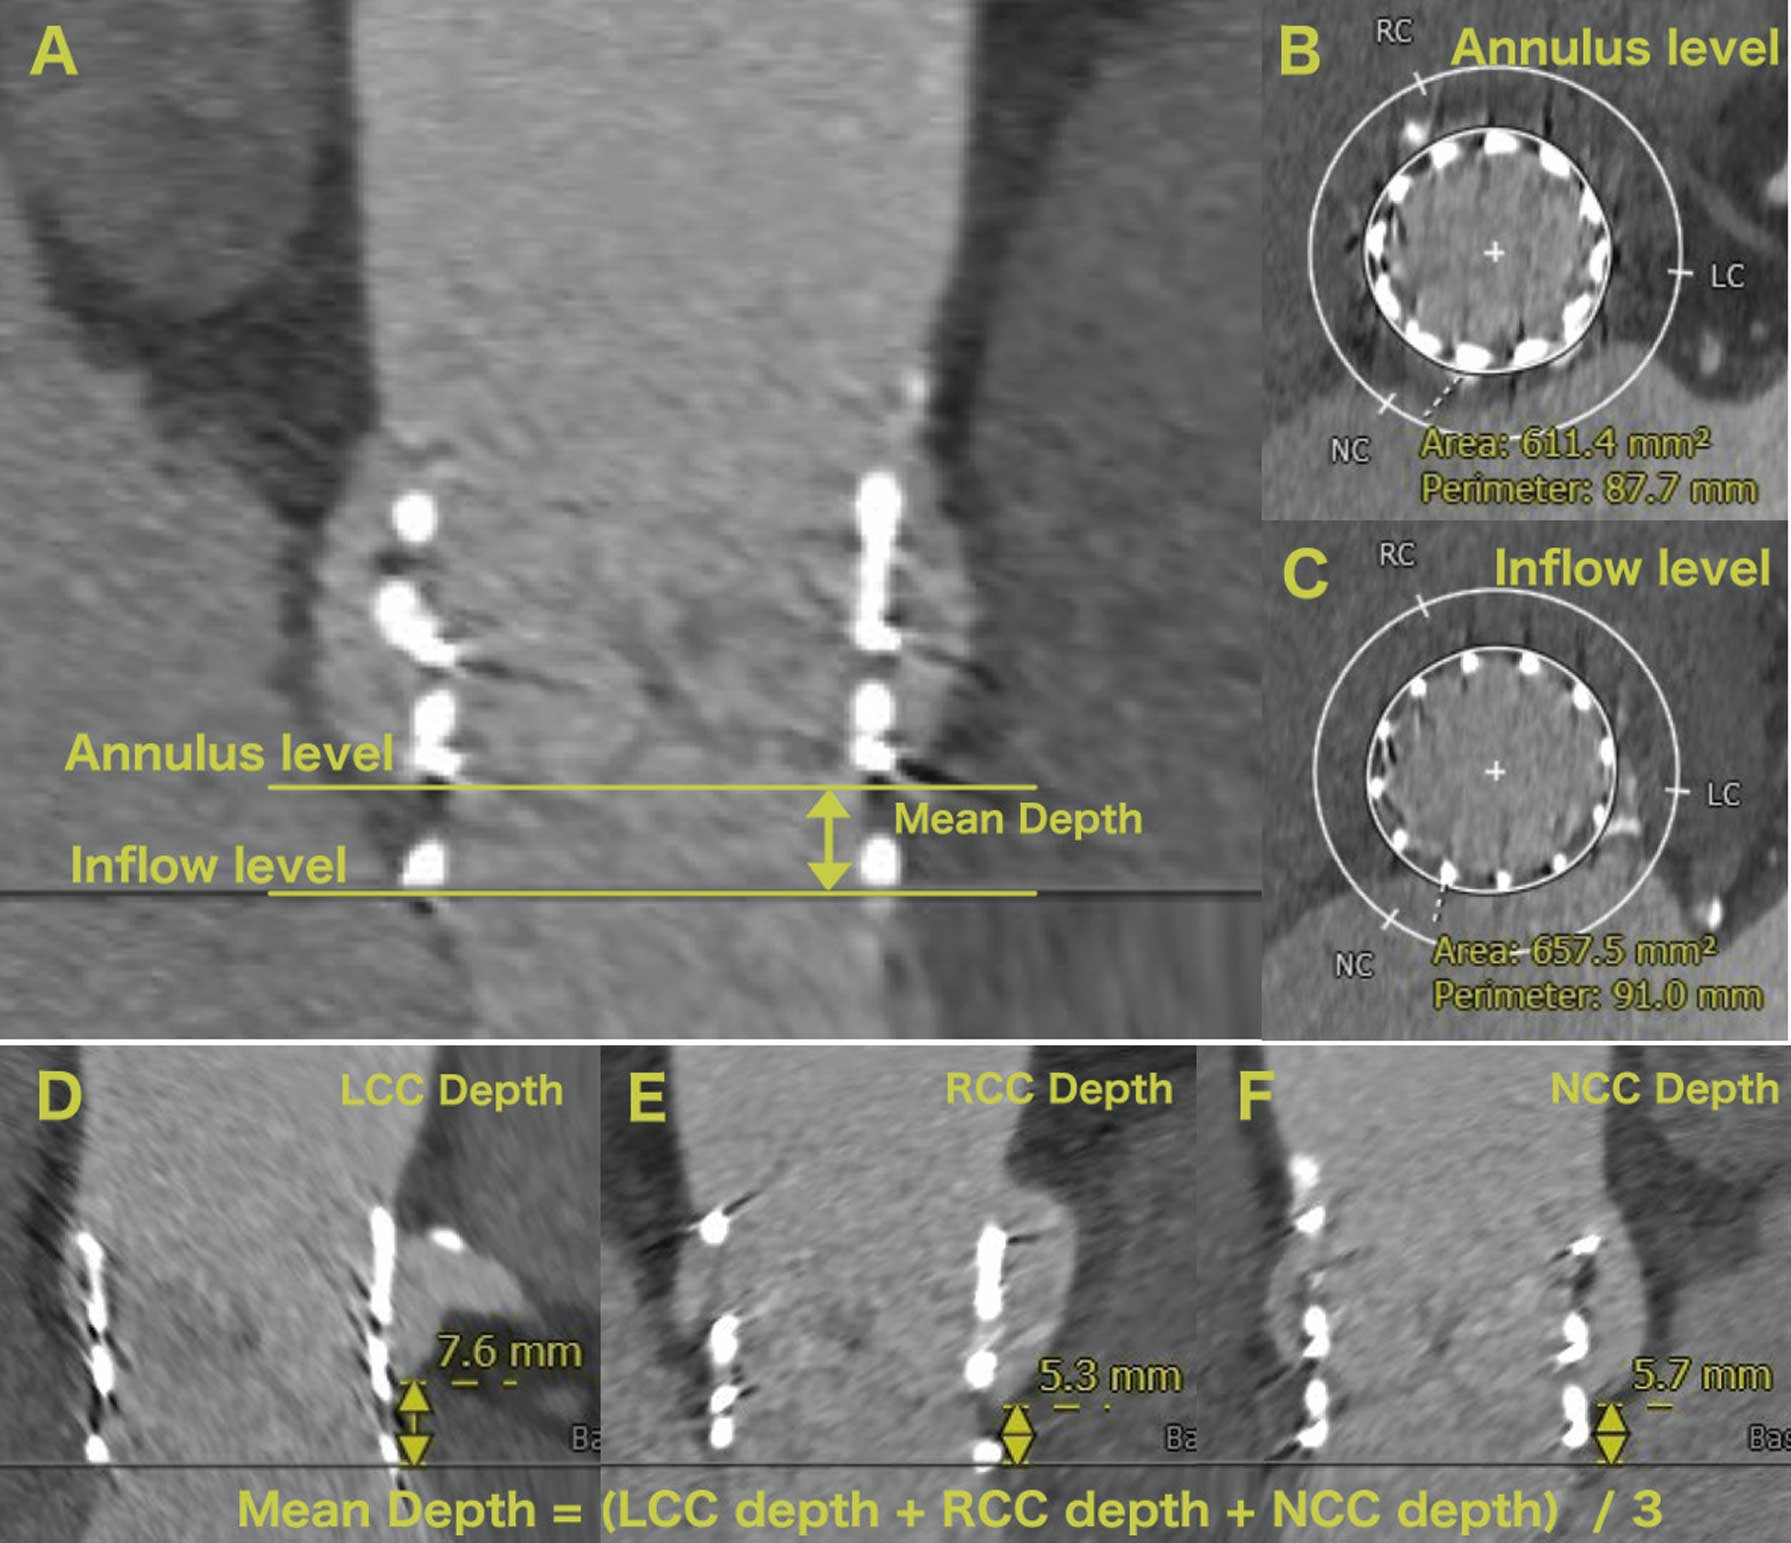
Using post-procedural CT, the THV dimensions were assessed at 2 cross-sectional levels, namely, the inflow and annulus. The annulus level was defined as the plane with a mean THV depth above the inflow level (Figure 1).20,21
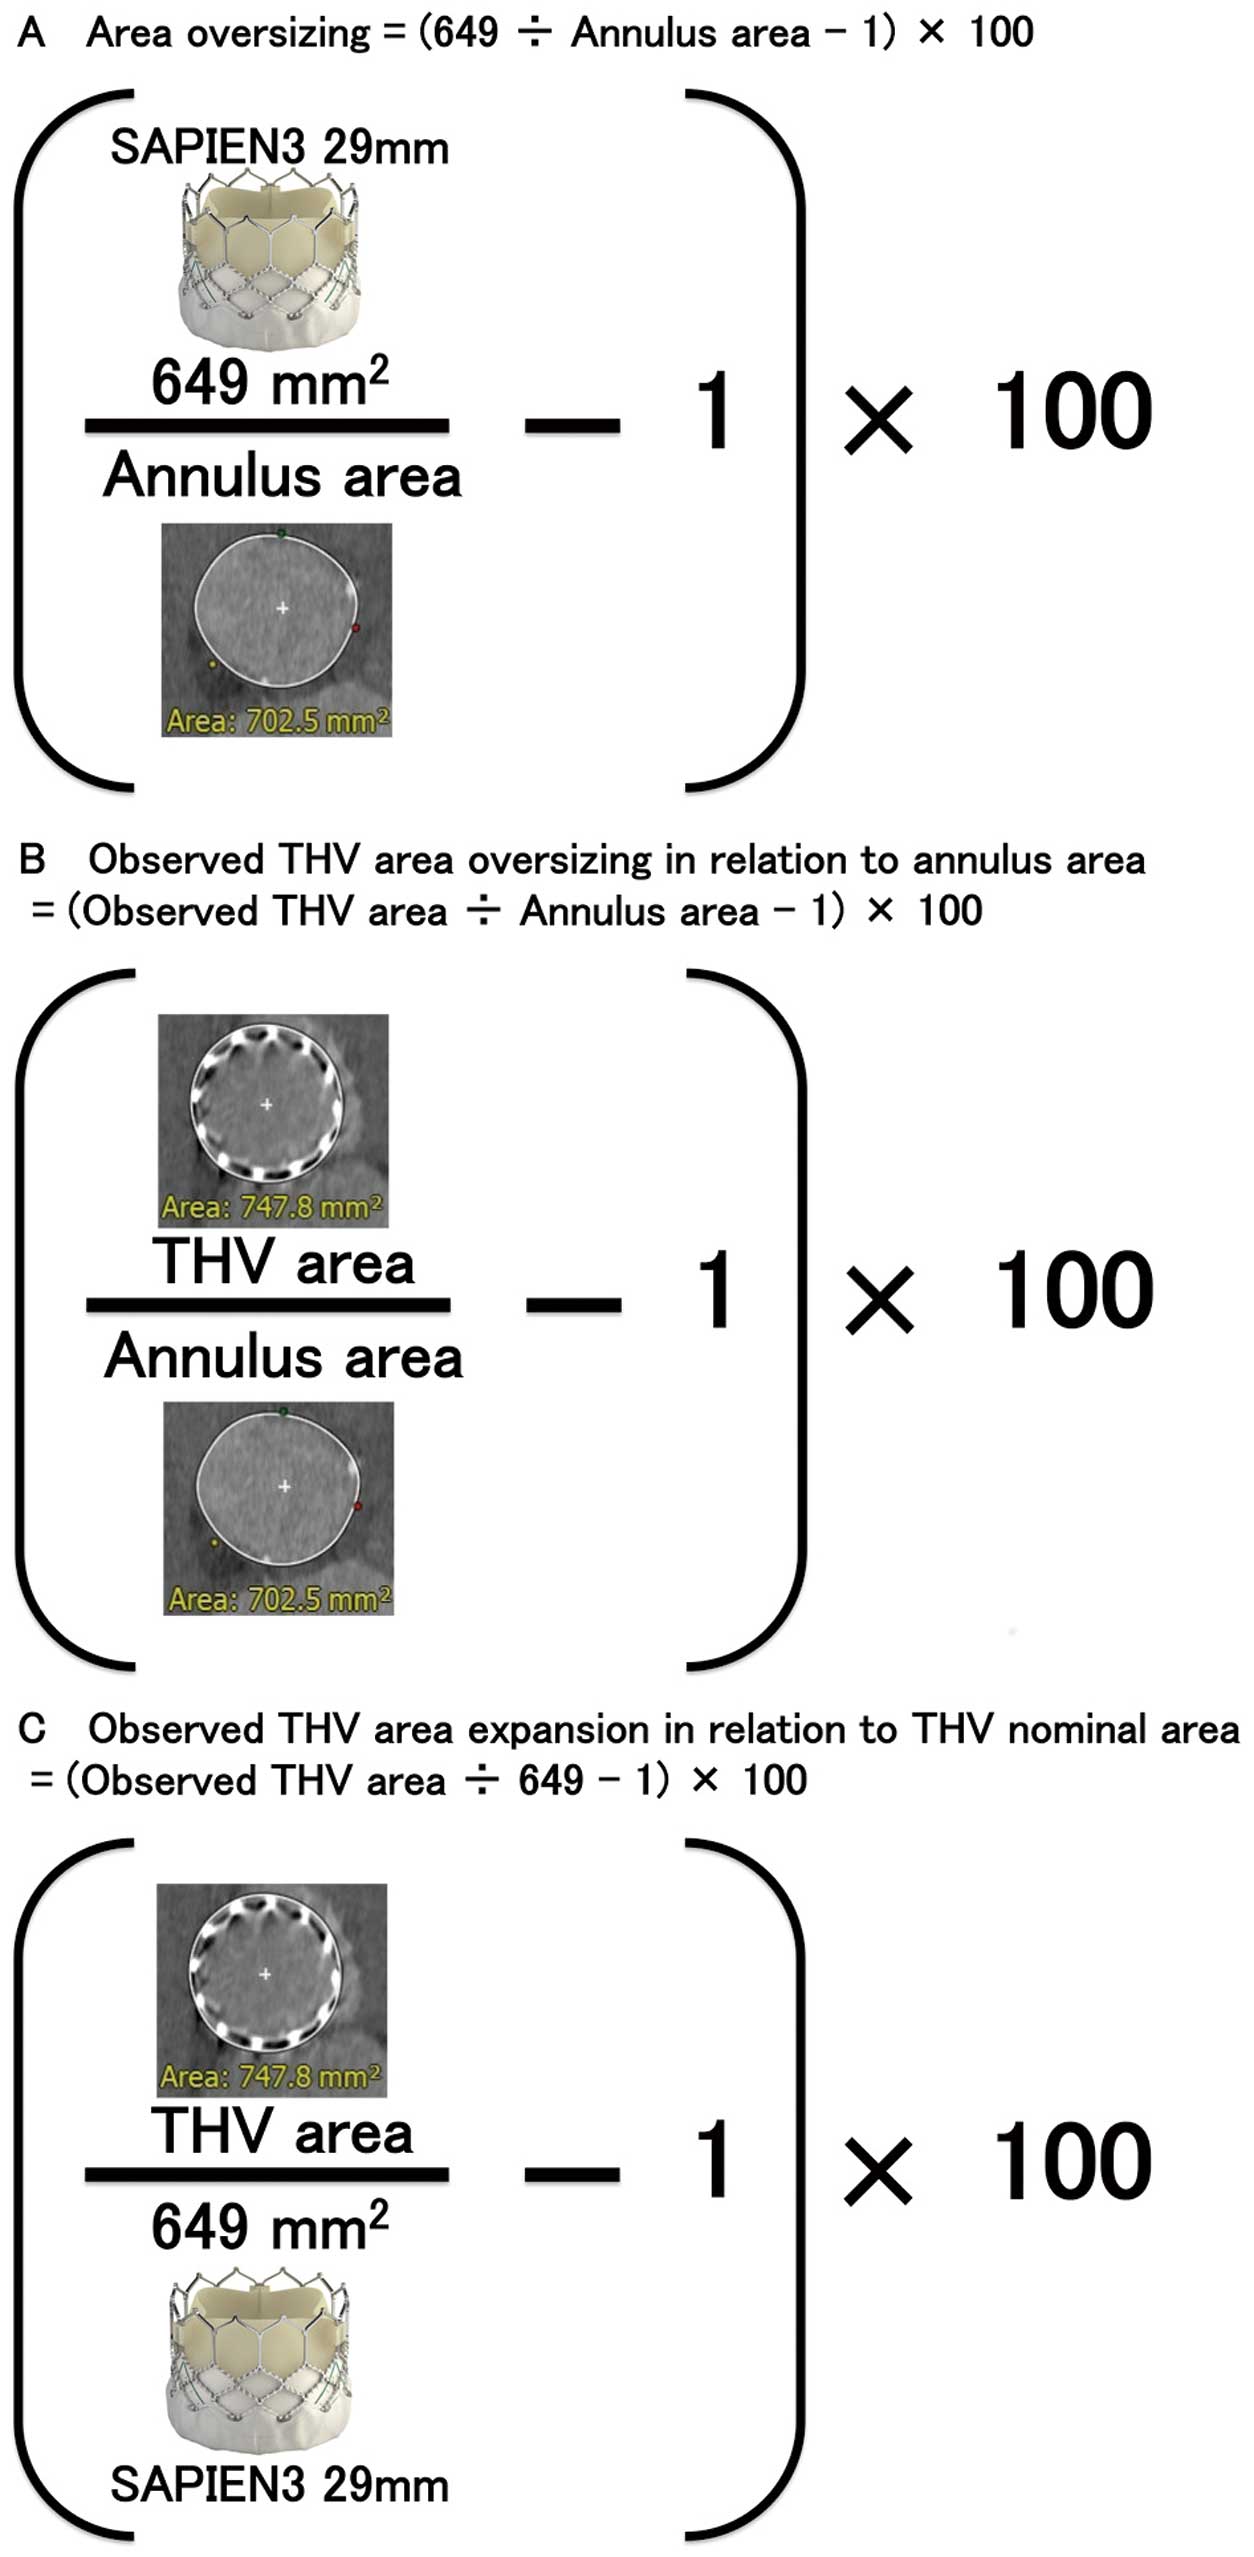
These THV assessments were performed by observers in the CT core laboratory. Inter- and intra-observer reproducibility of THV area at the THV-inflow level (interobserver: intraclass correlation coefficient [ICC] 0.95, P<0.001; intra-observer: ICC 0.97, P<0.001) and the THV-annulus level (interobserver: ICC 0.95, P<0.001; intra-observer: ICC 0.95, P<0.001) were satisfactory. The definition of area oversizing, observed THV area oversizing in relation to the annulus area, and observed THV area expansion in relation to the THV nominal area are described in
Figure 2. The LVOT cover index was defined as: (29-mm S3 nominal area [649 mm2]/LVOT area−1)×100.
Statistical Analysis
The quantitative variables were assessed for normal distribution using the Shapiro-Wilk test, and are expressed as the mean±standard deviation or as the median and interquartile range (IQR 25–75%), as appropriate. In addition, qualitative variables are expressed as numeric values and percentages. The quantitative variables were compared using the unpaired Student’s t-test or the Wilcoxon rank-sum test, depending on the distribution of the variables. The chi-square or Fisher’s exact test was used to compare the qualitative variables. Logistic regression analyses were performed to identify the risk factors for mild PAR. Cumulative survival rates were analyzed using the Kaplan-Meier method, and the differences were assessed with the log-rank test. Cox proportional hazards regression models were performed to assess the effect of variables on all-cause death. All of the analyses were considered statistically significant at a 2-tailed P-value <0.05. The JMP Pro software (version 12.1.0., SAS Institute Inc., Cary, NC, USA) and SPSS Statistics (version 24.0, SPSS, Inc., Chicago, IL, USA) were used to analyze the data.
Results
Among the 261 patients, we identified 30 (11.5%) with an aortic annulus area >683 mm2. These 30 patients comprised the ELA group, while the remaining 231 patients were the non-ELA group.
Table 1
presents the baseline characteristics. The median age of the entire study cohort was 81 years (IQR 73–85); only 1.5% of the patients were female, and the mean STS score was 4.2±2.7. As expected, the ELA group were younger, all males, and had larger weight, and body surface area than the non-ELA group (Table 1). The prevalence of bicuspid valve and diabetes mellitus was lower in the ELA group than in the non-ELA group. The native aortic annulus area ranged from 683.4 mm2
to 904 mm2
in the ELA group. The patients in the ELA group had a higher prevalence of ≥mild LVOT calcium and of ≥moderate LVOT calcium, and had a greater calcium volume of the aortic valve complex (Table 1).
Table 1.
Baseline Characteristics of the Patients With and Without an ELA
| |
ELA
(n=30) |
Non-ELA
(n=231) |
P value |
| Clinical characteristics |
| Age, years |
75 (71~81) |
81 (74~86) |
0.04 |
| Female |
0 (0) |
4 (1.7) |
1.00 |
| Height, m |
1.83 (1.78~1.87) |
1.78 (1.72~1.85) |
0.05 |
| Weight, kg |
89.1 (80.5~109.3) |
81.6 (71.6~94.3) |
0.01 |
| Body mass index, kg/m2 |
28.4 (26.3~34.7) |
26.5 (23.3~30.1) |
0.02 |
| Body surface area, m2 |
2.1 (2.0~2.3) |
2.0 (1.9~2.2) |
0.002 |
| Hypertension |
26 (86.7) |
210 (90.9) |
0.46 |
| Diabetes mellitus |
4 (13.3) |
82 (35.5) |
0.01 |
| Dyslipidemia |
24 (80.0) |
195 (84.4) |
0.60 |
| PAD |
4 (13.3) |
50 (21.6) |
0.35 |
| Prior MI |
3 (10) |
34 (14.7) |
0.78 |
| Prior PCI |
5 (16.7) |
68 (29.4) |
0.19 |
| Prior CVA |
5 (16.7) |
41 (17.7) |
1.00 |
| Prior CABG |
8 (26.7) |
65 (28.1) |
1.00 |
| Prior CAD |
22 (73.3) |
169 (74.1) |
0.93 |
| Prior pacemaker implantation |
4 (13.3) |
35 (15.2) |
1.00 |
| COPD |
6 (20.0) |
40 (17.3) |
0.80 |
| Chronic atrial fibrillation |
9 (30.0) |
49.0 (21.2) |
0.35 |
| eGFR, mL/min/1.73 m2 |
51.9 (36.8~56.2) |
48.7 (37.4~59.9) |
0.78 |
| NYHA class, III or IV |
28 (93.3) |
212 (92.2) |
0.82 |
| STS score |
3.2±2.7 |
4.3±2.6 |
0.04 |
| Logistic EuroSCORE, % |
17.2±18.7 |
18.0±14.6 |
0.77 |
| Bicuspid aortic valve |
8 (26.7) |
21 (9.1) |
0.01 |
| Echocardiographic data |
| LVEF, % |
52.5 (36.5~63.0) |
55.0 (37.7~62.1) |
0.76 |
| AVA, cm2 |
0.60 (0.5~0.8) |
0.7 (0.6~0.8) |
0.13 |
| Peak velocity, cm/s |
416 (381~447) |
411 (364~443) |
0.70 |
| Mean gradient, mmHg |
43.5 (40.0~49.5) |
42.0 (31.3~46.0) |
0.16 |
| AR ≥moderate |
5 (16.7) |
29 (12.6) |
0.54 |
| MR ≥moderate |
8 (26.7) |
58 (25.2) |
0.86 |
| PAP, mmHg |
36.0 (25.0~45.0) |
33.0 (27.0~45.3) |
0.91 |
| CT data |
| Annular area, mm2 |
721.7 (701.4~759.9) |
576.4 (551.4~602.7) |
<0.0001 |
| Perimeter, mm |
96.7 (94.7~98.9) |
86.4 (84.3~88.8) |
<0.0001 |
| Mean annulus diameter, mm |
30.6 (30.1~31.4) |
27.3 (26.5~28.0) |
<0.0001 |
| Ratio of short-axis to long-axis diameter |
0.84 (0.81~0.89) |
0.82 (0.78~0.85) |
0.01 |
| Mean SOV diameter, mm |
39.4 (37.5~40.4) |
35.9 (34.4~37.7) |
<0.0001 |
| LVOT area, mm2 |
715.5 (667.1~769.9) |
576.0 (529.5~631.1) |
<0.0001 |
| Ratio of annulus to LVOT area |
1.03 (0.97~1.07) |
0.99 (0.93~1.06) |
0.33 |
| LVOT calcium ≥mild |
20 (69.0) |
89 (38.4) |
0.002 |
| LVOT calcium ≥moderate |
11 (37.9) |
46.0 (19.9) |
0.03 |
| AVC calcium volume, mm3 |
35.9 (20.4~68.7) |
23.1 (12.3~37.3) |
0.003 |
Data are median (interquartile range), mean±SD or n (%). AR, aortic valve regurgitation; AVA, aortic valve area; AVC, aortic valve complex; CABG, coronary artery bypass grafting; CAD, coronary artery disease; COPD, chronic obstructive pulmonary disease; CVA, cerebrovascular accident; eGFR, estimated glomerular filtration rate; ELA, extra-large annulus; EuroSCORE, European System for Cardiac Operative Risk Evaluation; LVEF, left ventricular ejection fraction; LVOT, left ventricular outflow tract; MI, myocardial infarction; MR, mitral valve regurgitation; NYHA, New York Heart Association; PAD, peripheral artery disease; PAP, pulmonary artery pressure; PCI, percutaneous coronary intervention; SOV, the Sinus of Valsalva; STS, Society of Thoracic Surgeons.
Table 2
summarizes the procedural characteristics. The percentage of area oversizing was significantly smaller, and the inflation volume in the delivery balloon was greater in the ELA group than in the non-ELA group (Table 2). The highest inflation volume in the delivery balloon was 43 mL. There were no differences between groups in terms of balloon post-dilatation, or the need for an additional procedure such as second valve implantation or closure device to treat significant PAR (Table 2).
Table 2.
Procedural Characteristics and Clinical Outcomes of Patients With and Without ELA
| |
ELA
(n=30) |
Non-ELA
(n=231) |
P value |
| Procedural characteristics |
| Approach |
|
|
0.67 |
| Transfemoral |
30 (100.0) |
225 (97.4) |
|
| Transaortic |
0 |
1 (0.4) |
|
| Trans-subclavian |
0 |
5 (2.2) |
|
| Percentage of area oversizing, % |
−10.1 (−14.6~−7.5) |
12.6 (7.7~17.8) |
<0.0001 |
| LVOT cover index, % |
−9.3 (−15.7~−2.7) |
12.7 (2.8~22.6) |
<0.0001 |
| Balloon inflation volume, mL |
36.0 (36.0~37.0) |
33.0 (33.0~33.0) |
<0.0001 |
| Balloon pre-dilatation |
7 (23.3) |
56 (24.2) |
0.91 |
| Balloon post-dilatation |
2 (6.7) |
7 (3.0) |
0.28 |
| Contrast volume, mL |
70 (46~100) |
70 (50~100) |
0.95 |
| Fluoroscopy time, min |
12.3 (8.0~16.3) |
12.0 (8.5~18.0) |
0.92 |
| Need for 2nd valve or PVL closure |
1 (3.3) |
2.0 (0.9) |
0.31 |
| Aortic root injury |
0 (0) |
4 (1.7) |
1.00 |
| Coronary obstruction |
0 (0) |
1 (0.4) |
1.00 |
| CVA |
1 (3.3) |
4 (1.7) |
0.46 |
| Pacemaker implantation |
1 (3.3) |
25.0 (10.9) |
0.33 |
| Post-procedural echocardiographic data at 30 day |
| LVEF, % |
55 (37~64) |
59 (45~64) |
0.40 |
| Mean gradient, mmHg |
10.0 (7.0~12.2) |
9.0 (7.0~12.0) |
0.29 |
| Mean PG ≥20 mmHg |
2 (6.7) |
5 (2.2) |
0.19 |
| Paravalvular AR ≥trace |
22 (73.3) |
125 (54.1) |
0.05 |
| Paravalvular AR ≥mild |
13 (43.3) |
64 (27.7) |
0.09 |
| Paravalvular AR ≥moderate |
1 (3.3) |
3 (1.3) |
0.39 |
| Mitral regurgitation ≥moderate |
4 (14.3) |
30 (13.6) |
1.00 |
Data are median (interquartile range), mean±SD or n (%). PG, pressure gradient; PVL, paravalvular leak. Other abbreviations as in Table 1.
Table 2
lists the post-procedural echocardiography data. The median time of performing post-procedural echocardiography after TAVR was 31 days (IQR 25–36 days). The incidence of ≥mild PAR in the ELA group was numerically higher than that observed in the non-ELA group [13 (43.3%) vs. 64 (27.6%), P=0.09]; however, this difference did not reach statistical significance. No difference was observed in the incidence of at least moderate PAR [1 (3.3%) vs. 3 (1.3%), P=0.39]. Severe PAR was not reported in either group.
Because of the potential impact of bicuspid aortic valve morphology on adverse outcomes, we performed a subgroup analysis for patients with a tricuspid aortic valve, but there were no differences between the ELA and non-ELA groups in terms of procedure-related complications and post-procedural echocardiographic data (Supplementary Table 1).
THV Dimensions by Post-TAVI MDCT
A total of 129 patients (49.6%) underwent post-procedural CT at a median of 35 days (31–82 days) after TAVR. The ELA group had greater THV dimensions than the non-ELA group (Table 3). The observed THV area oversizing at the inflow and annulus levels was significantly less in the ELA group than in the non-ELA group, whereas the observed THV area expansion at the inflow and annulus levels was significantly greater in the ELA group than in the non-ELA group. THV depth was similar between groups (Table 3).
Table 3.
THV Measurements by MDCT After TAVR in Patients With and Without ELA
| |
ELA
(n=12) |
Non-ELA
(n=117) |
P value |
| THV dimensions |
| THV area at inflow, mm2 |
729.6±42.2 |
682.7±34.7 |
<0.0001 |
| THV perimeter at inflow, mm |
95.9±2.7 |
92.7±2.3 |
<0.0001 |
| THV mean diameter at inflow, mm |
30.6±0.8 |
29.6±0.8 |
<0.0001 |
| THV short-axis diameter/long-axis diameter at inflow |
0.97 (0.95~0.98) |
0.98 (0.96~0.99) |
0.10 |
| THV area at annulus level, mm2 |
687.3±56.8 |
644.2±38.9 |
0.0007 |
| THV perimeter at annulus level, mm |
93.07±3.74 |
90.1±2.82 |
0.001 |
| THV mean diameter at annulus level, mm |
30.2 (28.5~30.5) |
28.7 (28.2~29.3) |
0.01 |
| THV short-axis diameter/ long-axis diameter at annulus level |
0.96 (0.94~0.99) |
0.97 (0.95~0.99) |
0.62 |
Observed THV area oversizing at inflow, %
(in relation to native annulus area) |
−1.2±7.0 |
18.2±7.6 |
<0.0001 |
Observed THV area expansion at inflow, %
(in relation to S3 nominal area) |
12.4±6.5 |
5.2±5.4 |
<0.0001 |
Observed THV area oversizing at annulus level, %
(in relation to native annulus area) |
−6.9±8.8 |
11.6±8.2 |
<0.0001 |
Observed THV area expansion at annulus level, %
(in relation to S3 nominal area) |
5.9±8.8 |
−0.8±6.0 |
0.0007 |
| THV depth, mm |
5.7 (3.3~7.5) |
4.5 (3.1~5.9) |
0.15 |
Data are median (interquartile range), mean±SD. ELA, extra-large annulus; S3, SAPIEN 3 valve; THV, transcatheter heart valve.
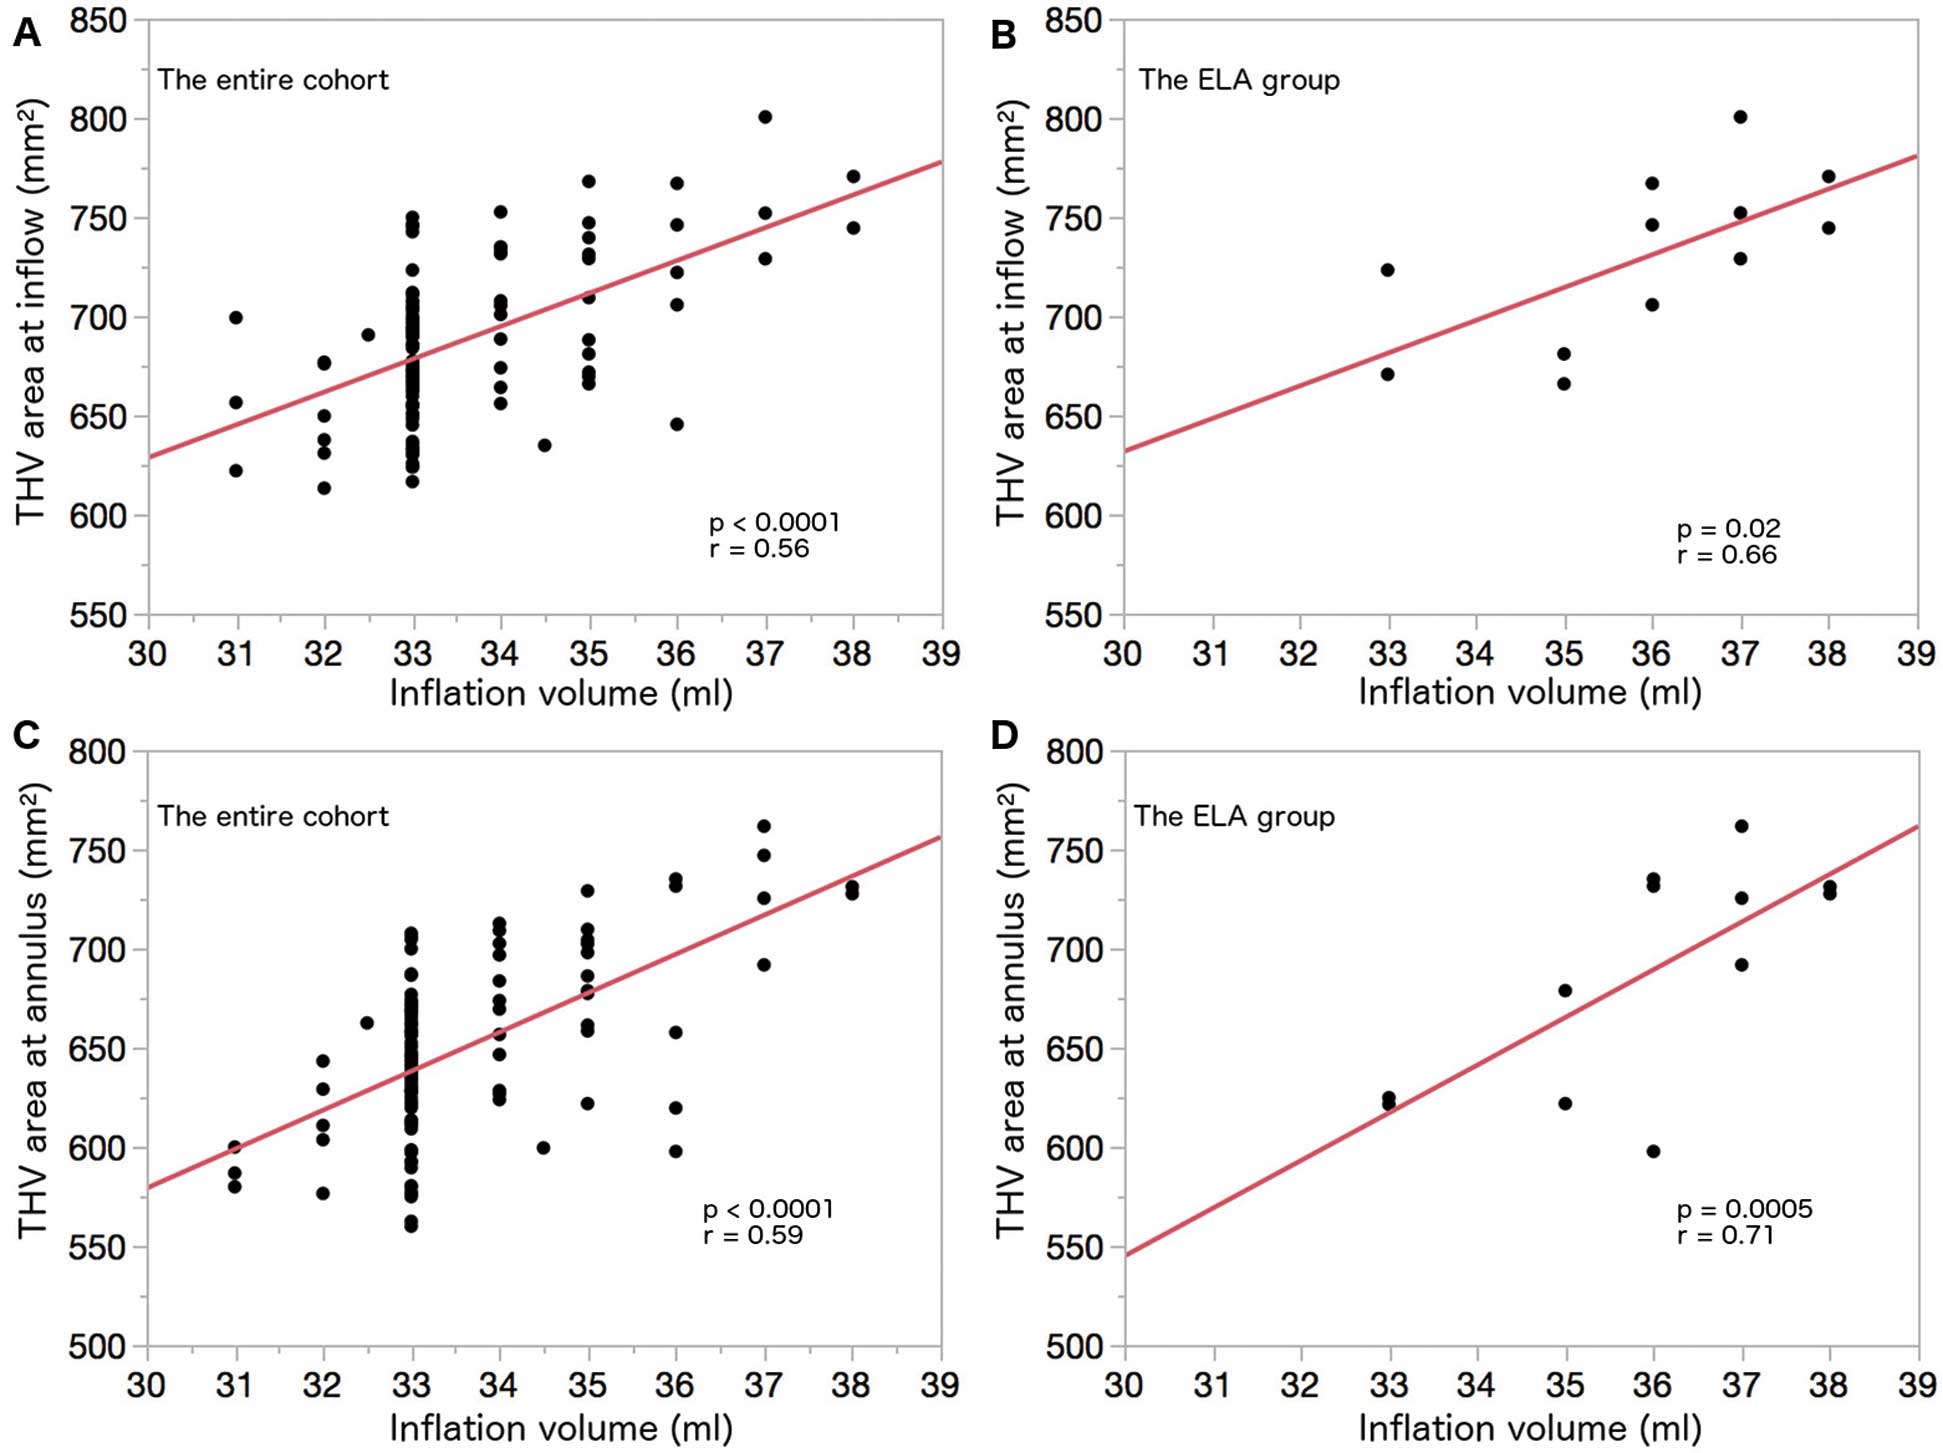
The inflation volume of the delivery balloon correlated with the observed THV area at the inflow (r=0.56, P<0.0001) and the annulus (r=0.59, P<0.0001) (Figure 3A,C). Interestingly, the inflation volume of the delivery balloon correlated with the observed THV area at the inflow (r=0.66, P=0.02) and at annulus (r=0.71, P=0.0005) even in the ELA group (Figure 3B,D). The anatomic characteristics, inflation volume in the delivery balloon, and THV dimensions on the post-procedural CT of each ELA patient who underwent post-procedural CT are summarized in
Supplementary Table 2.
Predictive Factors for PAR
Supplementary Table 3
presents the results of logistic regression analysis to identify predictors for PAR. ELA was not a predictor of ≥mild PAR. Neither the ratio of the annulus to LVOT area in the entire cohort nor that in the subset of ELA predicted ≥mild PAR (in the entire cohort: odds ratio [OR] 0.42, 95% confidence interval [CI] 0.04–4.46, P=0.47; in the ELA group: OR 0.76, 95% CI 0.0001–3730.0, P=0.95). The multivariate logistic regression analysis identified the calcium volume of the aortic valve complex (per 10 mm3) (OR 1.16, 95% CI 1.06–1.29, P=0.001) and percent area oversizing (OR 0.17, 95% CI 0.03–0.97, P=0.046) as independent predictors of ≥mild PAR in this population (Supplementary Table 3).
Cumulative Mortality and Predictors of All-Cause Mortality
The median follow-up was 389 days (IQR 110–588 days). A total of 37 patients died: 4 and 33 patients in the ELA and non-ELA groups, respectively. No deaths were reported at 30-day follow-up in the ELA group.
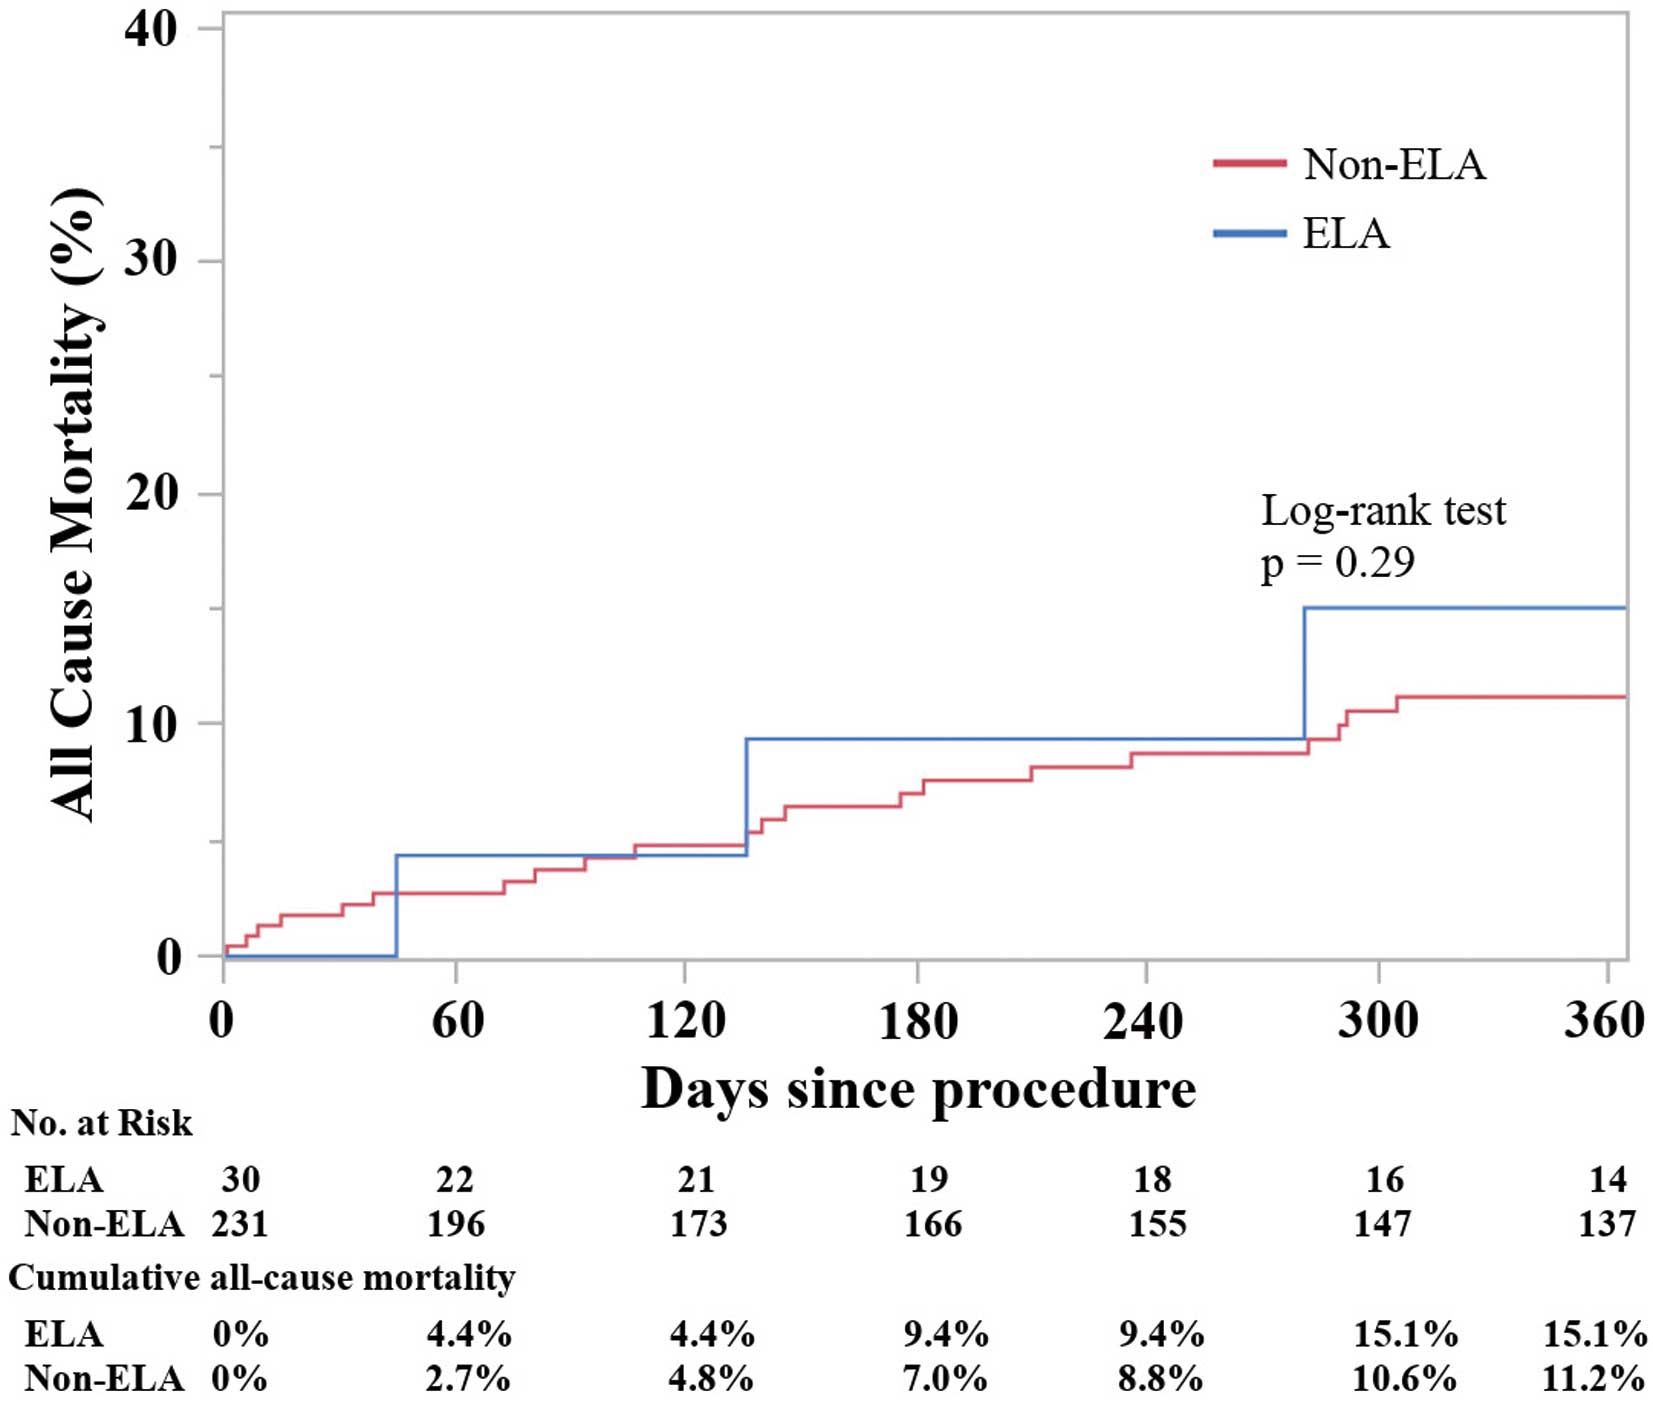
Figure 4
shows the Kaplan-Meier estimates of cumulative all-cause death in the 2 groups, on the basis of the presence of ELA. There was no difference in the probability of cumulative mortality between the groups during the entire follow-up period after TAVR (log-rank, P=0.29).
Supplementary Table 4
presents the predictors of all-cause death. The multivariate Cox proportional hazards analysis revealed that ELA was not a predictive factor of all-cause death (Supplementary Table 4).
Discussion
In this study, the ELA and non-ELA groups had a similar rate of procedural complications and similar 1-year mortality. In addition, a positive correlation between the delivery balloon volume and observed THV area by post-procedural CT was revealed in both the total study population and the ELA group.
The current study results indicated that TAVR using the S3 is feasible in patients with ELA, with similar incidences of procedural complications and similar short-term mortality to those of patients without ELA. It is noteworthy that the TAVR procedure was performed successfully in the ELA group, despite the large aortic annulus (median annulus area, 721.7 mm2). A recent study in which only ELA patients were included showed that TAVR can be safely conducted with no procedural deaths and an incidence of ≥mild PAR of 29.2%,22
which further supports our findings. Differences in the baseline characteristics of the 2 groups should be taken into consideration when interpreting the similar mortality. Overall, patients in the ELA group had a higher prevalence of bicuspid valve and they had a younger median age compared with those in the non-ELA group. Accordingly, ELA was not shown to be a predictor of death even after adjusting the baseline characteristics of the 2 groups (Supplementary Table 4). Furthermore, in the multivariate analysis, the presence of a bicuspid valve in this cohort was not a risk factor of PAR or death (Supplementary Tables 3,4). This result was consistent with previous findings demonstrating that the procedural and clinical outcomes of TAVR using newer generation THV such as the S3 in patients with severe AS and a bicuspid valve were similar to those in patients with a non-bicuspid valve.20,23
The association between inflation volume and THV dimensions on post-procedural CT in patients with ELA has not been previously investigated. Interestingly, the result of the present study demonstrated a positive correlation in both groups between the inflation volume in the delivery balloon and THV dimensions by post-procedural CT (Figure 3). This correlation has not been reported previously, although an in-vitro study suggested a similar association between inflation volume in the delivery balloon and the size of an inflated delivery balloon with bench testing using the 29-mm S3.13
Our result showed that, compared with the non-ELA group, the ELA group had a smaller observed THV area oversizing in relation to the native annulus. These findings indicated that the stent frame of the S3 can be over-expanded, exceeding the upper limit of the recommended annulus area (683 mm2) with extra inflation volume. Nevertheless, it cannot be expanded to the optimal degree of THV expansion. In addition to the similar incidence of procedural complications and short-term mortality between the 2 groups, the linear relationship between inflation volume and observed THV dimensions in patients with ELA may encourage clinicians to conduct TAVR in cases of severe AS with ELA, in the absence of other treatment options.
Despite the observed similarities, caution should be taken because the difference between the groups in ≥mild PAR tended to be significant. Although previous studies confirmed moderate PAR as a risk factor of death in patients who underwent TAVR, the negative effect of mild PAR on clinical outcomes remains controversial.24–28
However, the presence of mild PAR cannot be overlooked for the following reasons. First, long-term (>10 years) mortality data for patients with mild PAR are not available.29
Second, it is undeniable that ≥mild PAR interferes with left ventricular mass regression after TAVR.30,31
Third, regression of PAR following TAVR with the S3 was observed at 1-year follow-up in the PARTNER 2 study,28
and this regression may contribute to improved survival in patients with mild PAR at 30 days. However, regression of PAR after TAVR with the S3 has not been investigated in patients with ELA. In the present study, the multivariate analysis revealed that the percent area oversizing and calcium volume of the aortic valve complex were independent predictive factors of ≥mild PAR. These results are consistent with those of previous studies.10,11,18
The incidence of ≥mild PAR was 43.3% in the ELA group. In the literature, the incidence of ≥mild PAR ranges from 19.7% to 48.5% of patients who underwent TAVR with the S3.10,18,28,32,33
Considering the significant negative oversizing (−10.1%) in the ELA group and the fact that less oversizing inversely correlates with the occurrence of PAR in TAVR using the S3,10,11,18
the rate of PAR in the ELA group is comparable and seems to be relatively low. The reason for this finding is unclear but a possible explanation is that the inflation volume in the delivery balloon was increased aggressively and the THV was over-expanded in this study (Table 3, Figure 3).
The similar procedural and short-term outcomes between the 2 groups and the positive correlation between the delivery balloon and observed THV area measured by post-procedural CT may be important for patients with ELA without other treatment options because of their high surgical risk. Other than the SAPIEN 3, the other option would be a large-sized, self-expandable THV, the 34-mm EvolutR. However, it could not be over-expanded or anchored to the ELA because of the shape-memory material of the self-expandable THV. Both developing larger THV devices and conducting appropriate pivotal trials in the future is warranted. In the meantime, TAVR using the 29-mm S3 with extra inflation of the delivery balloon may be a treatment option for patients with ELA.
Study Limitations
First, this was a retrospective, single-center study. Second, the small sample size of this study may be responsible for the failure to detect a statistically significant difference in the incidence of ≥mild PAR between the 2 groups. Third, we exclusively included patients with ELA who underwent TAVR and, thus a possible patient selection bias may be present. Finally, post-procedural CT results were available for only half of the study cohort. However, we believe that these data from patients with ELA provide valuable information in the absence of other similar trials.
Conclusions
TAVR using the 29-mm S3 with extra inflation of the delivery balloon can be considered as a treatment option for patients with severe AS and ELA.
Conflict of Interest Statement
R.P.S. is a consultant for Edwards Lifesciences Corporation, Abbott Vascular, Keystone Heart, and Boston Scientific. R.M. has received grant support from Edwards Lifesciences Corporation; and is a consultant for Abbott Vascular, Cordis, and Medtronic, and holds equity in Entourage Medical. All other authors do not have potential conflicts of interest to declare.
Funding
Nothing to declare.
Supplementary Files
Please find supplementary file(s);
http://dx.doi.org/10.1253/circj.CJ-18-1059
References
- 1.
Leon MB, Smith CR, Mack M, Miller DC, Moses JW, Svensson LG, et al. Transcatheter aortic-valve implantation for aortic stenosis in patients who cannot undergo surgery. N Engl J Med 2010; 363: 1597–1607.
- 2.
Leon MB, Smith CR, Mack MJ, Makkar RR, Svensson LG, Kodali SK, et al. Transcatheter or surgical aortic-valve replacement in intermediate-risk patients. N Engl J Med 2016; 374: 1609–1620.
- 3.
Adams DH, Popma JJ, Reardon MJ, Yakubov SJ, Coselli JS, Deeb GM, et al. Transcatheter aortic-valve replacement with a self-expanding prosthesis. N Engl J Med 2014; 370: 1790–1798.
- 4.
Reardon MJ, Van Mieghem NM, Popma JJ, Kleiman NS, Sondergaard L, Mumtaz M, et al. Surgical or transcatheter aortic-valve replacement in intermediate-risk patients. N Engl J Med 2017; 376: 1321–1331.
- 5.
Cribier A. Development of transcatheter aortic valve implantation (TAVI): A 20-year odyssey. Arch Cardiovasc Dis 2012; 105: 146–152.
- 6.
Grover FL, Vemulapalli S, Carroll JD, Edwards FH, Mack MJ, Thourani VH, et al. 2016 Annual Report of The Society of Thoracic Surgeons/American College of Cardiology Transcatheter Valve Therapy Registry. Ann Thorac Surg 2017; 103: 1021–1035.
- 7.
Miyasaka M, Tada N, Taguri M, Kato S, Enta Y, Otomo T, et al. Incidence, predictors, and clinical impact of prosthesis-patient mismatch following transcatheter aortic valve replacement in Asian patients: The OCEAN-TAVI Registry. JACC Cardiovasc Interv 2018; 11: 771–780.
- 8.
Auffret V, Lefevre T, Van Belle E, Eltchaninoff H, Iung B, Koning R, et al. Temporal trends in transcatheter aortic valve replacement in France: FRANCE 2 to FRANCE TAVI. J Am Coll Cardiol 2017; 70: 42–55.
- 9.
Werner N, Zeymer U, Schneider S, Bauer T, Gerckens U, Linke A, et al. Incidence and clinical impact of stroke complicating transcatheter aortic valve implantation: Results FROM the German TAVI Registry. Catheter Cardiovasc Interv 2016; 88: 644–653.
- 10.
Blanke P, Pibarot P, Hahn R, Weissman N, Kodali S, Thourani V, et al. Computed tomography-based oversizing degrees and incidence of paravalvular regurgitation of a new generation transcatheter heart valve. JACC Cardiovasc Interv 2017; 10: 810–820.
- 11.
Maeno Y, Abramowitz Y, Jilaihawi H, Israr S, Yoon S, Sharma RP, et al. Optimal sizing for SAPIEN 3 transcatheter aortic valve replacement in patients with or without left ventricular outflow tract calcification. EuroIntervention 2017; 12: e2177–e2185.
- 12.
Sathananthan J, Sellers S, Barlow A, Fraser R, Stanova V, Cheung A, et al. Overexpansion of the SAPIEN 3 transcatheter heart valve: An ex vivo bench study. JACC Cardiovasc Interv 2018; 11: 1696–1705.
- 13.
Mathur M, McCabe JM, Aldea G, Pal J, Don CW. Overexpansion of the 29 mm SAPIEN 3 transcatheter heart valve in patients with large aortic annuli (area > 683 mm2): A case series. Catheter Cardiovasc Interv 2018; 91: 1149–1156.
- 14.
Jilaihawi H, Kashif M, Fontana G, Furugen A, Shiota T, Friede G, et al. Cross-sectional computed tomographic assessment improves accuracy of aortic annular sizing for transcatheter aortic valve replacement and reduces the incidence of paravalvular aortic regurgitation. J Am Coll Cardiol 2012; 59: 1275–1286.
- 15.
Jilaihawi H, Makkar RR, Kashif M, Okuyama K, Chakravarty T, Shiota T, et al. A revised methodology for aortic-valvar complex calcium quantification for transcatheter aortic valve implantation. Eur Heart J Cardiovasc Imaging 2014; 15: 1324–1332.
- 16.
Khalique OK, Hahn RT, Gada H, Nazif TM, Vahl TP, George I, et al. Quantity and location of aortic valve complex calcification predicts severity and location of paravalvular regurgitation and frequency of post-dilation after balloon-expandable transcatheter aortic valve replacement. JACC Cardiovasc Interv 2014; 7: 885–894.
- 17.
Seiffert M, Fujita B, Avanesov M, Lunau C, Schon G, Conradi L, et al. Device landing zone calcification and its impact on residual regurgitation after transcatheter aortic valve implantation with different devices. Eur Heart J Cardiovasc Imaging 2016; 17: 576–584.
- 18.
Yang TH, Webb JG, Blanke P, Dvir D, Hansson NC, Norgaard BL, et al. Incidence and severity of paravalvular aortic regurgitation with multidetector computed tomography nominal area oversizing or undersizing after transcatheter heart valve replacement with the Sapien 3: A comparison with the Sapien XT. JACC Cardiovasc Interv 2015; 8: 462–471.
- 19.
Barbanti M, Yang TH, Rodes Cabau J, Tamburino C, Wood DA, Jilaihawi H, et al. Anatomical and procedural features associated with aortic root rupture during balloon-expandable transcatheter aortic valve replacement. Circulation 2013; 128: 244–253.
- 20.
Kawamori H, Yoon SH, Chakravarty T, Maeno Y, Kashif M, Israr S, et al. Computed tomography characteristics of the aortic valve and the geometry of SAPIEN 3 transcatheter heart valve in patients with bicuspid aortic valve disease. Eur Heart J Cardiovasc Imaging 2018; 19: 1408–1418.
- 21.
Kazuno Y, Maeno Y, Kawamori H, Takahashi N, Abramowitz Y, Babak H, et al. Comparison of SAPIEN 3 and SAPIEN XT transcatheter heart valve stent-frame expansion: Evaluation using multi-slice computed tomography. Eur Heart J Cardiovasc Imaging 2016; 17: 1054–1062.
- 22.
Tang GHL, Zaid S, George I, Khalique OK, Abramowitz Y, Maeno Y, et al. Impact of aortic root anatomy and geometry on paravalvular leak in transcatheter aortic valve replacement with extremely large annuli using the Edwards SAPIEN 3 valve. JACC Cardiovasc Interv 2018; 11: 1377–1387.
- 23.
Yoon SH, Bleiziffer S, De Backer O, Delgado V, Arai T, Ziegelmueller J, et al. Outcomes in transcatheter aortic valve replacement for bicuspid versus tricuspid aortic valve stenosis. J Am Coll Cardiol 2017; 69: 2579–2589.
- 24.
Kodali SK, Williams MR, Smith CR, Svensson LG, Webb JG, Makkar RR, et al. Two-year outcomes after transcatheter or surgical aortic-valve replacement. N Engl J Med 2012; 366: 1686–1695.
- 25.
Kodali S, Pibarot P, Douglas PS, Williams M, Xu K, Thourani V, et al. Paravalvular regurgitation after transcatheter aortic valve replacement with the Edwards Sapien valve in the PARTNER trial: Characterizing patients and impact on outcomes. Eur Heart J 2015; 36: 449–456.
- 26.
Van Belle E, Juthier F, Susen S, Vincentelli A, Iung B, Dallongeville J, et al. Postprocedural aortic regurgitation in balloon-expandable and self-expandable transcatheter aortic valve replacement procedures: Analysis of predictors and impact on long-term mortality: Insights from the FRANCE2 Registry. Circulation 2014; 129: 1415–1427.
- 27.
Athappan G, Patvardhan E, Tuzcu EM, Svensson LG, Lemos PA, Fraccaro C, et al. Incidence, predictors, and outcomes of aortic regurgitation after transcatheter aortic valve replacement: Meta-analysis and systematic review of literature. J Am Coll Cardiol 2013; 61: 1585–1595.
- 28.
Pibarot P, Hahn RT, Weissman NJ, Arsenault M, Beaudoin J, Bernier M, et al. Association of paravalvular regurgitation with 1-year outcomes after transcatheter aortic valve replacement with the SAPIEN 3 valve. JAMA Cardiol 2017; 2: 1208–1216.
- 29.
Deutsch MA, Erlebach M, Burri M, Hapfelmeier A, Witt OG, Ziegelmueller JA, et al. Beyond the five-year horizon: Long-term outcome of high-risk and inoperable patients undergoing TAVR with first-generation devices. EuroIntervention 2018; 14: 41–49.
- 30.
Kim SJ, Samad Z, Bloomfield GS, Douglas PS. A critical review of hemodynamic changes and left ventricular remodeling after surgical aortic valve replacement and percutaneous aortic valve replacement. Am Heart J 2014; 168: 150–159.e151–157.
- 31.
Pibarot P, Weissman NJ, Stewart WJ, Hahn RT, Lindman BR, McAndrew T, et al. Incidence and sequelae of prosthesis-patient mismatch in transcatheter versus surgical valve replacement in high-risk patients with severe aortic stenosis: A PARTNER trial cohort – a analysis. J Am Coll Cardiol 2014; 64: 1323–1334.
- 32.
Wendler O, Schymik G, Treede H, Baumgartner H, Dumonteil N, Ihlberg L, et al. SOURCE 3 Registry: Design and 30-day results of the European Postapproval Registry of the latest generation of the SAPIEN 3 transcatheter heart valve. Circulation 2017; 135: 1123–1132.
- 33.
Mauri V, Kim WK, Abumayyaleh M, Walther T, Moellmann H, Schaefer U, et al. Short-term outcome and hemodynamic performance of next-generation self-expanding versus balloon-expandable transcatheter aortic valves in patients with small aortic annulus: A multicenter propensity-matched comparison. Circ Cardiovasc Interv 2017; 10: e005013.