Abstract
Background:
Although the subclinical left ventricular (LV) dysfunction caused by diabetes mellitus (DM) results in a high risk of death and heart failure, the details of cardiac dysfunction across a wide age range remain unclear. The aim of this study was to assess LV dysfunction in patients with type 1 DM (T1DM) using layer-specific strain analysis by echocardiography.
Methods and Results:
The 52 patients (median age: 23 [range: 5–40] years) with T1DM were divided into 3 age groups (D1: 5–14 years, D2: 15–24 years, D3: 25–40 years); 78 age- and sex-similar controls were divided into 3 corresponding groups (C1, C2, and C3). Layer-specific longitudinal strain (LS) and circumferential strain (CS) of the 3 myocardial layers (endocardium, midmyocardium, and epicardium) were determined using echocardiography. Strains did not decrease in D1. Epicardial and midmyocardial CS at the basal level and LS in all layers were decreased in D2 compared with C2. CS at the basal level and LS in all layers were lower in D3 than in C3. The strains correlated with the duration of T1DM and LV wall thickness.
Conclusions:
In patients with T1DM, longitudinal deformation in all layers and epicardial and midmyocardial circumferential deformation at the basal level decreased from the late teens, which correlated with the duration of the disease and LV hypertrophy.
Patients with type 1 diabetes mellitus (T1DM) have a high incidence of heart failure (HF), as evidenced in a large-scale study of over 20,000 T1DM patients.1
Furthermore, in T1DM patients, the mortality rate of cardiovascular disease (CVD) increases over time, and when disease duration is >20 years, CVD becomes the primary cause of death.2
In patients with T1DM, the risk of death from CVD is increased between 6- and 12-fold compared with the general population.3
Furthermore, the risk of CVD in T1DM patients under the age of 40 years is increased up to 40-fold.4
Although ischemic heart disease has been the most researched form of CVD in patients with T1DM,4
diabetic cardiomyopathy (DCM) has recently attracted a great deal of attention.5–9
DCM is defined as myocardial dysfunction independent of coronary artery disease and hypertension.10
The development of DCM is associated with structural and functional alterations in cardiomyocytes, coronary microangiopathy, and autonomic neuropathy. These factors lead to hypertrophy and subclinical cardiac dysfunction and then to symptomatic HF.10,11
The pathogenesis of DCM is caused by multifactorial factors such as hyperinsulinemia, insulin resistance, hyperglycemia, increased free fatty acids, and inflammatory cytokines, which change the cellular metabolic pathways in cardiomyocytes and impair cardiac function.12,13
A previous study reported that an increase in the E/e’ ratio in diabetic patients was associated with subsequent HF and increased mortality independent of hypertension, coronary disease, or other echocardiographic parameters.14
This result suggests that diabetic patients with DCM have a higher risk of HF and higher mortality rate than diabetic patients without DCM.
However, the pathophysiological mechanisms of myocardial impairment in T1DM are slightly different because they are mainly related to hyperglycemia. In contrast to T1DM, the main harmful factor in T2DM is hyperinsulinemia and insulin resistance. Insulin resistance in T2DM may independently affect myocardial structure. Moreover, T2DM is often associated with hypertension and obesity, which additionally influence cardiac function. Therefore, DCM in T1DM should be treated as a different subject that requires separate assessment.
Recently, there have been studies using echocardiography to evaluate the cardiac dysfunction related to DCM in patients with T1DM.15,16
Studies of animal models of T1DM have also demonstrated LV dysfunction.6–8
Some studies indicated that cardiac dysfunction begins during childhood or adolescence,9,17,18
but the long-term changes of DCM in patients with T1DM, especially between childhood and adulthood, remain unknown.
A recent development in the detection of cardiac dysfunction is layer-specific strain analysis, which allows separate quantification of the deformation of the endocardial, midmyocardial, and epicardial layers of the myocardium.19
The usefulness of this new sensitive indicator for detecting cardiac dysfunction in various cardiac diseases has been reported.19–21
To the best of our knowledge, no previous study has analyzed the layer-specific deformation of the left ventricle (LV) in patients with T1DM.
Methods
Study Population
In this prospective study, we recruited 52 patients (age, 5–40 years) with T1DM at Juntendo University. The following data were collected from the medical records: age of onset and duration of follow-up, treatment of diabetes, presence of diabetic complications, symptoms and signs of HF, and cardiac medications. We excluded patients who had a history of heart disease, hypertension, and any other diseases that affect cardiac function, and who were taking cardioprotective agents such as β-blockers, angiotensin-converting enzyme inhibitors (ACEIs), and angiotensin-receptor blockers (ARBs). LV strain analysis was performed in all patients. Age- and sex-similar healthy individuals were recruited from Juntendo University and Shizuoka Children’s Hospital as normal controls for LV myocardial mechanical analysis. They were either healthy volunteers or children undergoing echocardiography for the evaluation of innocent murmurs. None had a history of cardiovascular disease and all showed normal sinus rhythm on ECG and normal findings on echocardiography. All participants or their guardians provided written informed consent, as established by the Institutional Review Board at Juntendo University and Shizuoka Children’s Hospital. In children, cardiac function dramatically changes with age. Therefore, to more clearly identify the characteristics of myocardial deformation in patients with T1DM, patients were divided into 3 age groups: D1, <15 years old; D2, 15–24 years old; and D3, 25–40 years old. Normal controls were also divided into the same 3 age groups (C1, C2, and C3).
Baseline Characteristics and Laboratory Measurements
The baseline measurements of blood pressure, weight, and height were recorded, and body mass index (BMI) was calculated as the ratio of the individual’s body weight to the square of the height.
Blood samples were taken on the day of echocardiographic evaluation. Glycated hemoglobin (HbA1c) was measured with a high-performance liquid chromatography method using ADAMS A1c HA-8182 (ARKRAY Inc., Kyoto, Japan).
Echocardiography
Echocardiography was performed using a Vivid E9 ultrasound system (GE Healthcare, Milwaukee, WI, USA) with an M5S or 6S probe as appropriate for patient size. Images were optimized for gain, compression, depth, and sector width and acquired at frame rates of 70–125frames/s. Apical 4- and 2-chamber views, parasternal long-axis views, and parasternal short-axis views at the basal, papillary, and apical ventricular levels were acquired. In each plane, images from 3 consecutive cardiac cycles were acquired during a breath hold at end-expiration, if possible. For younger children, we selected 3 cardiac cycles at end-expiration on the respiratory trace.
Chamber quantification was performed in accordance with the recommendations of the European Association of Cardiovascular Imaging. LV end-diastolic diameter (LVEDD), LV wall thickness (WT), interventricular septum end-diastolic diameter (IVSd), and posterior wall end-diastolic diameter (PWd) were measured from the parasternal long-axis views. Mean WT was calculated as (IVSd+PWd)/2. LV mass (LVM) was calculated according to the Devereux formula and indexed to body surface area (BSA). The mitral inflow E-wave, A-wave, and E/A ratio were measured. LV end-diastolic volume (LVEDV) and LV end-systolic volume (LVESV) were calculated from the apical 4-chamber and 2-chamber views using the modified Simpson rule. LVEF was calculated as (LVEDV−LVESV)/LVEDV. LV diastolic function was quantified using the ratio between the E-wave velocity of the pulsed-wave Doppler mitral flow and the early diastolic velocity of the septum and LV free wall at the mitral annulus level (e′ wave) on tissue Doppler imaging.
LV Deformation Analysis
Analysis was performed offline with the aid of a commercially available software package (EchoPAC 113 1.0; GE Vingmed Ultrasound AS, Horton, Norway). Strain analysis was performed by 2 observers (T.I. and M.I.) who were unaware of the clinical data. Strain was measured using 2D speckle-tracking echocardiography as described in previous reports (Figure 1).22,23
All data were measured at least 3 times, and the averages are reported.
Statistical Analysis
Normally distributed continuous variables are expressed as mean±standard deviation (SD); non-normally distributed variables as median (range). All group differences were assessed using a one-factor analysis of variance with a post-hoc comparison using the Tukey-Kramer method for normally distributed data or the Steel-Dwass test for non-normally distributed data. After evaluating the data for normality, the correlations between the duration of T1DM, HbA1c, insulin dose, LVM index, mean WT, and each peak strain were evaluated using either Spearman’s correlation coefficient for data with non-normal distributions or Pearson’s correlation coefficient for data with normal distributions, which were expressed as ρ or r, respectively.
Intraobserver and interobserver agreements for the LV layer-specific strain were calculated using the Bland-Altman approach, including the calculation of mean bias (average difference between measurements), and the lower and upper limits of agreement (95% limits of agreement of mean bias) in 6 randomly selected patients and 6 controls at more than 2 months apart. The coefficient of variation was also determined (i.e., the SD of the difference of paired samples divided by the average of the paired samples). Statistical analyses were performed using JMP software (version 9.0.2; SAS Institute Inc., Cary, NC, USA). A P-value <0.05 was considered statistically significant.
Results
Feasibility
Table 1
and
Table 2
show the clinical characteristics of the study participants. The median age of the 52 patients (18 males) was 22.7 years (range, 5.3–40.3 years) at echocardiography. The median diagnosis age of T1DM patients was 12.1 years (range, 2.1–36.8 years). The mean duration of diabetes was 10.4 years (range, 0.7–35.0 years). The body weight, BMI, systolic blood pressure (SBP), and diastolic blood pressure (DBP) were similar between patients and controls. All diabetic patients were treated with insulin; 27% of patients used an insulin pump and 73% were on multiple daily injections. The median insulin dose was 40.7±17.6U/24 h. No participants were treated with statins, ACEIs, ARBs, or β-blockers. As shown in
Table 2, the age of T1DM diagnosis was significantly younger in the D1 group than in the D2 and D3 groups. The median duration of T1DM was significantly longer in the D3 group than in the D1 and D2 groups. No patients had overt clinical HF at the time of the study.
Table 1.
Baseline Characteristics of Study Groups of Patients With Type 1 Diabetes Mellitus and Healthy Controls
| |
D1 |
D2 |
D3 |
C1 |
C2 |
C3 |
| Total number(males) |
15 (11) |
16 (1) |
21 (6) |
23 (17) |
24 (2) |
31 (9) |
| Age (years) |
10.2
(5.3–14.8)†† |
20.4
(15.2–24.7) |
33.4
(27.9–40.3)†† |
10.2
(5.4–14.5)†† |
20.4
(15.7–24.8) |
31.9
(26.2–40.7)†† |
| HR (beats/min) |
74.8
(46.8–92.2) |
72.2
(55.8–88.3) |
70.3
(55.5–106.3) |
74.3
(49.6–104.6)†† |
62.2
(39.6–73.5) |
63.4
(48.5–75.3)‡‡ |
| Height (cm) |
139.5
(102.0–176.3)†† |
156.8
(147.8–163.6) |
163.2
(153.0–180.0)‡‡ |
138.7
(106.9–166.4)†† |
158.4
(152.0–170.0) |
162.0
(150.0–181.0)‡‡ |
| Weight (kg) |
36.3
(14.8–66.3)†† |
57.5
(48.0–77.3) |
61.1
(49.0–76.2)‡‡ |
34.8
(16.0–55.1)†† |
54.5
(48.0–70.0) |
56.1
(39.0–75.0)‡‡ |
| BMI (kg/m2) |
17.7±2.6†† |
23.4±3.0 |
22.9±2.3‡‡ |
17.4±2.6†† |
21.7±2.2 |
21.3±2.6‡‡ |
| SBP (mmHg) |
99±11 |
111±11 |
115±14‡‡ |
103±11 |
111±9 |
115±13‡‡ |
| DBP (mmHg) |
58±11 |
67±8 |
68±9‡ |
60±9 |
68±9 |
71±11‡‡ |
| LVEDV/BSA (mL/m2) |
58.7±6.8 |
56.7±6.9 |
59.3±12.8* |
58.7±9.7 |
57.4±12.2 |
49.8±7.6‡ |
| LVESV/BSA (mL/m2) |
20.2±2.4 |
20.2±3.6 |
23.1±5.2* |
20.1±3.8 |
20.9±4.9 |
17.0±4.1‡ |
| IVSd (mm) |
5.9
(4.2–7.8) |
6.9
(4.8–9.8) |
8.5
(6.1–11.8)**,††,‡‡ |
5.4
(4.2–7.7)†† |
6.6
(4.4–8.3) |
6.7
(5.5–9.0)‡‡ |
| PWd (mm) |
5.8
(4.5–7.2)†† |
7.2
(6.7–8.5) |
7.8
(6.0–10.7)**,‡‡ |
5.7
(3.6–7.5)†† |
7.0
(5.6–9.3) |
6.8
(5.2–9.0)‡‡ |
| Mean wall thickness (mm) |
5.9
(4.3–7.4)†† |
7.1
(5.8–8.1) |
8.2
(6.1–9.6)**,††,‡‡ |
5.6
(4.1–7.1)†† |
6.8
(5.3–8.2) |
6.8
(5.5–9.0)‡‡ |
| LVIDd (mm) |
40.5±4.0 |
41.2±3.0 |
43.8±3.4 |
42.2±4.8 |
44.3±4.2 |
44.4±5.0 |
| LVM index (g/m2) |
57.5±11.6 |
54.9±9.7 |
68.9±12.3 |
58.6±9.8 |
59.8±10.2 |
58.6±9.7 |
| LVEF (%) |
65.3
(61.0–70.4) |
64.3
(58.5–71.4) |
61.7
(56.7–68.4)*,‡ |
66.2
(62.0–72.0) |
63.7
(55.0–69.5) |
65.1
(56.6–72.4) |
| E-wave velocity (cm/s) |
107±13†† |
88±13 |
87±17‡‡ |
106±15†† |
90±16 |
90±12‡‡ |
| A-wave velocity (cm/s) |
50±9 |
51±7 |
60±11**,†,‡ |
50±11 |
43±12 |
49±8 |
| E/A ratio |
2.20
(1.65–3.13) |
1.73
(1.18–2.61) |
1.50
(0.96–2.80)‡‡ |
2.16
(1.43–3.39) |
2.26
(1.46–4.41) |
1.89
(1.18–3.05) |
| Septal e’ (cm/s) |
13.8
(11.0–17.7) |
13.2
(11.0–15.0) |
11.2
(7.0–14.3)‡ |
14.6
(10.0–21.3) |
13.5
(10.0–18.0) |
13.2
(7.0–19.0) |
| LV FW e’ (cm/s) |
17.9±2.7 |
17.8±1.6 |
14.9±3.0†,‡ |
18.2±3.4 |
17.4±2.9 |
16.2±2.4 |
| Mean e’ (cm/s) |
15.9±2.0 |
15.5±1.0 |
13.0±2.3* |
16.4±3.1 |
15.4±2.2 |
14.7±2.3 |
| E/e’ |
6.97
(5.31–8.37) |
5.90
(4.73–7.35) |
6.94
(5.00–9.55) |
6.78
(4.70–9.58) |
6.04
(4.26–8.57) |
6.39
(3.71–10.6) |
*Patients with T1DM vs. controls in corresponding age groups, P<0.05. **Patients with T1DM vs. controls in corresponding age groups, P<0.01. †Significant difference between next to age groups , P<0.05. ††Significant difference between next to age groups, P<0.01. ‡Significant difference between D1 and D3 or C1 and C3, P<0.05. ‡‡Significant difference between D1 and D3 or C1 and C3, P<0.01. D1, 5–14 years old; D2, 15–24 years old; D3, 25–40 years old; C1–C3, control groups of similar ages. BMI, body mass index; BSA, body surface area; DBP, diastolic blood pressure; EF, ejection fraction; FW, free wall; HR, heart rate; IVSd, intraventricular septum end-diastolic diameter; LV, left ventricular; LVEDV, LV end-diastolic volume; LVESV, LV end-systolic volume; LVM, LV mass; PWd, posterior wall end-diastolic diameter; SBP, systolic blood pressure; T1DM, type 1 diabetes mellitus.
Table 2.
Characteristics of Study Patients With Type 1 Diabetes Mellitus (T1DM)
| Characteristic |
D1 |
D2 |
D3 |
| Age at diagnosis of T1DM (years) |
6.4 (1.7–14.1)† |
12.2 (7.8–18.8) |
16.2 (3.0–36.8)‡‡ |
| Duration of T1DM (years) |
3.8 (0.7–12.3) |
8.2 (0.1–13.8) |
16.8 (2.1–35.0)††,‡‡ |
| HbA1c (%) |
8.18±1.00 |
8.48±1.00 |
7.62±1.10† |
| Insulin dose (U/day) |
28.0±18.4†† |
52.3±18.6 |
41.0±8.3†,‡ |
†Significant difference between next to age groups, P<0.05. ††Significant difference between next to age groups, P<0.01. ‡Significant difference between D1 and D3, P<0.05. ‡‡Significant difference between D1 and D3, P<0.01. D1, 5–14 years old; D2, 15–24 years old; D3, 25–40 years old.
No significant differences were found in E-wave velocity, E/A, e′ (septal, LV free wall, and mean), and E/e′ between patients and controls (Table 1). On the other hand, the LVEDV/BSA, LVESV/BSA, IVSd, PWd, mean WT, LVM/BSA, and A-velocity were significantly higher in the D3 group. Furthermore, the LVEF and e′(mean) were significantly lower in the D3 group than in the C3 group.
LV Strain Patterns
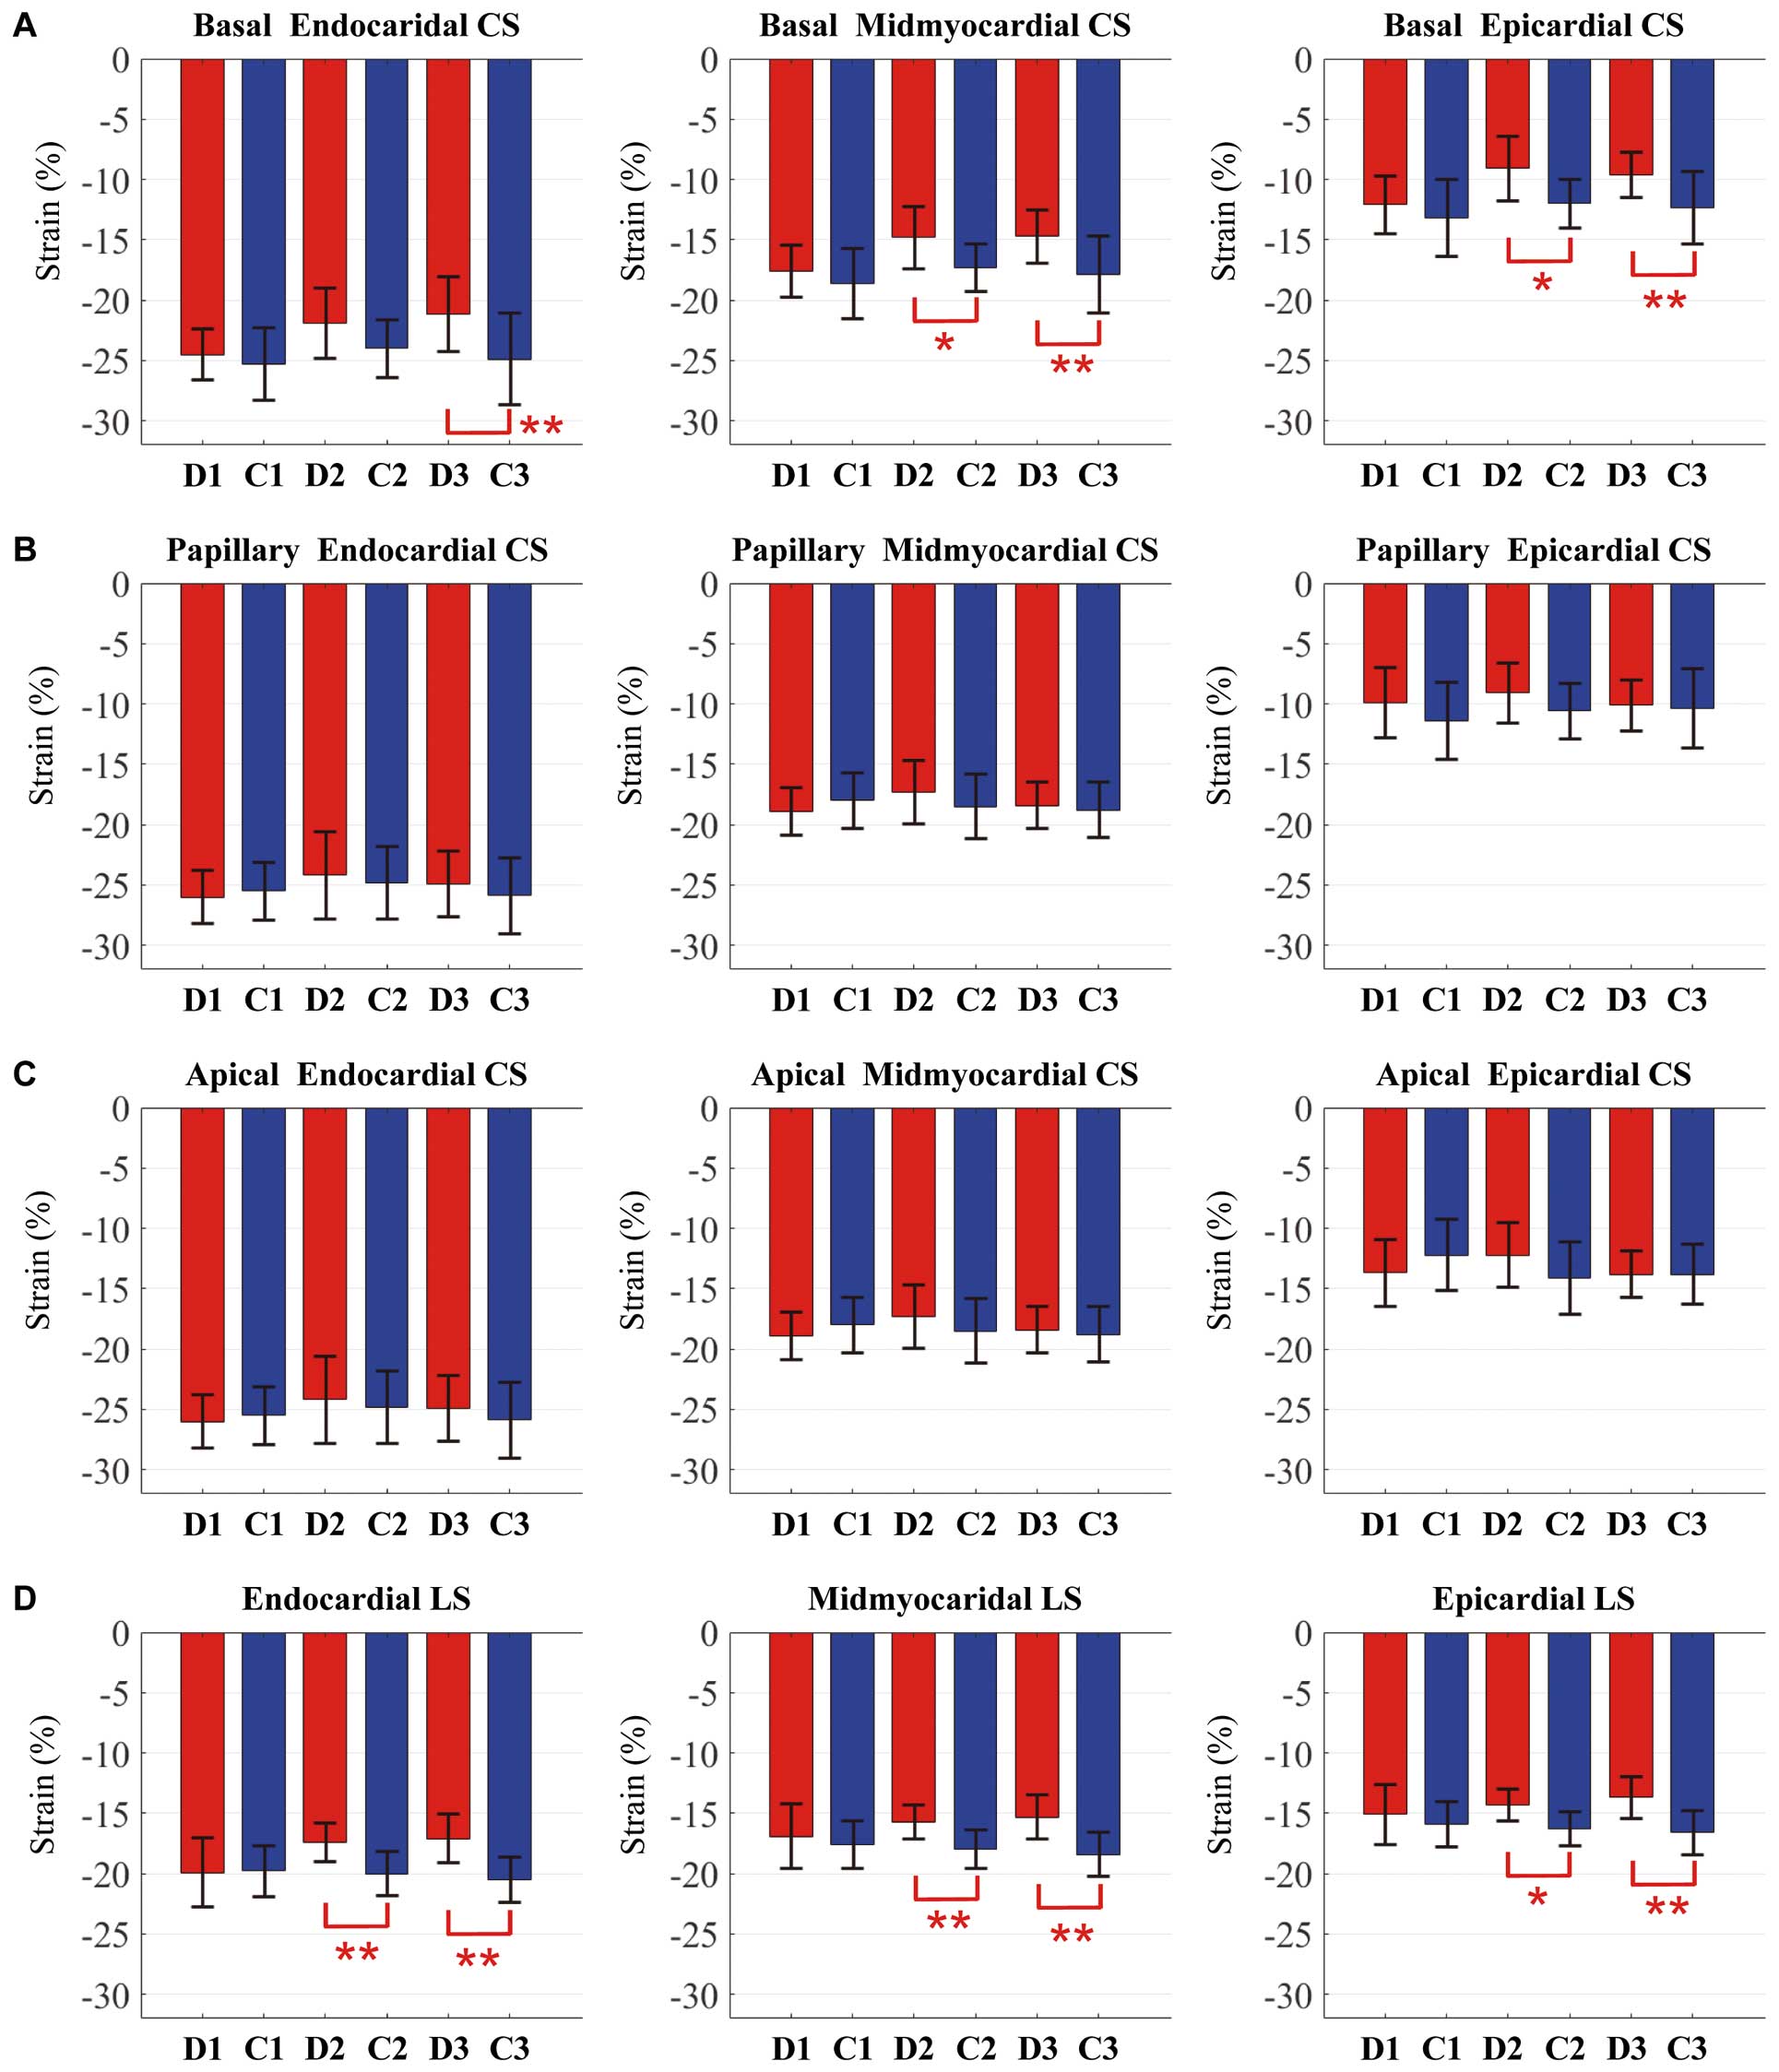
Basal CS
Peak epicardial and midmyocardial basal CS were decreased in the D2 and D3 groups compared with the C2 and C3 groups (Figure 2,
Supplementary Table). Peak endocardial basal CS was also decreased in the D3 group compared with the C3 group. Significant differences were not found in the basal CS in the D1 group compared with the C1 group. Furthermore, peak epicardial and midmyocardial basal CS were decreased in the D2 group compared with the D1 group, and peak midmyocardial and endocardial basal CS were decreased in the D3 group compared with the D1 group.
Papillary CS
Peak papillary CS in all 3 layers was not significantly different between patients and controls (Figure 2,
Supplementary Table).
Apical CS
Peak apical CS in all 3 layers was not significantly different between patients and controls (Figure 2,
Supplementary Table).
LS
Peak LS in all 3 layers was decreased in the D2 and D3 groups compared with the C2 and C3 groups (Figure 2,
Supplementary Table).
Relationship Between Strain Values and Clinical and Echocardiographic Parameters
The basal CS value in all 3 layers correlated significantly with the duration of T1DM (endocardial, ρ=0.332, P=0.016; midmyocardial, ρ=0.407, P=0.003; epicardial, ρ=0.408, P=0.003). The endomyocardial LS value also correlated significantly with the duration of T1DM (ρ=0.285, P=0.041) (Supplementary Figure 1). The midmyocardial and epicardial LS values correlated significantly with the LVM index (midmyocardial, r=0.179, P=0.042; epicardial, r=0.196, P=0.026). There were significant correlations between the mean WT and endocardial CS at the apical (ρ=0.183, P=0.037) and papillary levels (ρ=0.192, P=0.029), the basal CS in all 3 layers (endocardial, ρ=0.272, P=0.002; midmyocardial, ρ=0.265, P=0.002; epicardial, ρ=0.217, P=0.013), and LS in all 3 layers (endocardial, ρ=0.326, P<0.001; midmyocardial, ρ=0.304, P<0.001; epicardial, ρ=0.298, P<0.001) (Supplementary Figure 2). No correlations were noted with HbA1c.
Reproducibility
Table 3
presents the results for intra- and interobserver variability. Important differences were not observed in the variability scores of the endocardial, midmyocardial, and epicardial CS at the basal, papillary, and apical levels, or of LS.
Table 3.
Intraobserver and Interobserver Variability of Layer-Specific Strain
| Variable |
Bias |
LLA |
ULA |
CV |
| Intraobserver |
| Endocardial basal CS |
−0.539 |
−2.742 |
1.664 |
4.31 |
| Midmyocardial basal CS |
−0.228 |
−1.590 |
1.135 |
3.57 |
| Epicardial basal CS |
−0.038 |
−1.485 |
1.409 |
5.25 |
| Endocardial papillary CS |
−0.289 |
−2.075 |
1.498 |
3.49 |
| Midmyocardial papillary CS |
0.056 |
−1.278 |
1.389 |
3.60 |
| Epicardial papillary CS |
0.317 |
−1.357 |
1.990 |
6.62 |
| Endocardial apical CS |
−0.247 |
−2.793 |
2.299 |
4.88 |
| Midmyocardial apical CS |
−0.183 |
−1.823 |
1.457 |
4.28 |
| Epicardial apical CS |
−0.184 |
−2.447 |
2.078 |
8.18 |
| Endocardial LS |
−0.642 |
−2.582 |
1.299 |
4.87 |
| Midmyocardial LS |
−0.578 |
−2.856 |
1.701 |
6.40 |
| Epicardial LS |
−0.506 |
−3.208 |
2.197 |
8.46 |
| Interobserver |
| Endocardial basal CS |
0.525 |
−1.671 |
2.712 |
4.38 |
| Midmyocardial basal CS |
0.328 |
−0.952 |
1.608 |
3.40 |
| Epicardial basal CS |
0.159 |
−1.447 |
1.765 |
5.86 |
| Endocardial papillary CS |
0.836 |
−1.167 |
2.839 |
4.00 |
| Midmyocardial papillary CS |
1.092 |
−0.441 |
2.624 |
4.26 |
| Epicardial papillary CS |
1.261 |
−0.917 |
3.439 |
8.95 |
| Endocardial apical CS |
0.372 |
−2.179 |
2.923 |
4.95 |
| Midmyocardial apical CS |
−0.181 |
−1.847 |
1.486 |
4.35 |
| Epicardial apical CS |
−0.593 |
−3.441 |
2.255 |
10.15 |
| Endocardial LS |
0.017 |
−2.221 |
2.255 |
5.71 |
| Midmyocardial LS |
−0.141 |
−1.860 |
1.577 |
4.88 |
| Epicardial LS |
−0.273 |
−1.741 |
1.196 |
4.63 |
CS, circumferential strain; CV, coefficient of variation; LLA, 95% lower limit of agreement; LS, longitudinal strain; ULA, 95% upper limit of agreement.
Discussion
To our knowledge, the present study is the first to examine the characteristics of cardiac dysfunction in patients with T1DM using layer-specific strain analysis. The 2 key findings of this study are as follows. (1) Despite the wide range of age of onset, abnormal myocardial deformation did not occur in childhood, but the epicardial and midmyocardial CS at the basal level and the LS in all 3 layers decreased from the late teens, and conventional cardiac parameters decreased only after the late 20s. Additionally, the endocardial CS at the basal level decreased after the late 20 s. (2) Almost all strain values, which decreased significantly compared with the same aged control groups, correlated with the duration of T1DM.
The mechanisms of the development of DCM appear to be a direct result of cellular damage caused by hyperglycemia, leading to increases in cardiac oxidative stress, inflammation, and myocardial fibrosis, as well as detrimental changes in Ca2+
handling and mitochondrial function. The formation of advanced glycation endproducts leads to irreversible changes in myocardial structure.12,24–26
Conventional Parameters
In this study, although LVEF decreased in the D3 group compared with the C3 group, no patients showed abnormal LVEF, defined as <55%. In another study with a median duration of T1DM reaching 25.5 years and a mean patient age of 49.6 years, 1.7% of 1,001 T1DM patients had an abnormal LVEF; however, the abnormal LVEF limit was set as <45%.27
In previous studies, LVEF was not found to be significantly different in T1DM patients compared with normal controls.15–18,28
These findings suggest that LVEF decreases in the late period after the onset of T1DM. On color Doppler echocardiography, the A-wave velocity and e’ in the D3 group decreased compared with the C3 group, which was similar to the results from previous reports.15,16
Furthermore, our study showed thickening of the LV wall and increasing LVM index in D3 compared with C3. Wai et al reported that 38% of adult patients with T1DM had LV hypertrophy.29
In addition, Carugo et al reported that the LV of young patients with T1DM showed evidence of thickening, increasing LVM index and decreasing LV function over the course of 2 years.30
These findings suggest that myocardial hypertrophy and cardiac function in patients with T1DM are closely related. Therefore, the data obtained using conventional parameters in the present study correspond to those reported in the previous studies.
Layer-Specific Strain
In the present study, significant differences in conventional cardiac indices were shown only in D3. In contrast, the strain values were already decreased in D2. Namely, strain was an early marker of cardiac dysfunction compared with conventional parameters in patients with T1DM. Jedrzejewska et al reported that the LV global LS (GLS) and CS, especially the basal CS, were lower in patients with T1DM compared with normal subjects,15
which is comparable to our results. Other previous studies also showed that a reduction in strain values occurred before changes in conventional parameters, such as LVEF and diastolic parameters derived by pulse wave Doppler and tissue Doppler imaging.17,18
However, those studies evaluated strain using monolayer analysis. The recently introduced speckle-tracking echocardiographic technology allows assessment of layer-specific myocardial deformation.31,32
Several studies have demonstrated the usefulness of endocardial layer strain as a sensitive marker of cardiac damage or as a powerful predictor of cardiac events in patients with other cardiac diseases, such as chronic ischemia,20
anthracycline-treated survivors,21
and myocardial infarction,19
using layer-specific strain analysis. Furthermore, we previously reported the usefulness of layer-specific strain as an early marker of cardiac dysfunction in patients with repaired tetralogy of Fallot22
and in anthracycline-treated survivors;23
impaired myocardial deformation increases with age, extending from the endocardium to the epicardium. In contrast to those reports, in the present study we demonstrated that epicardial and midmyocardial strain decreased earlier than endocardial strain at the basal level in patients with T1DM.
Okada et al showed that endocardial CS did not decrease despite decreasing epicardial and midmyocardial CS in patients with hypertrophic cardiomyopathy (HCM) or preserved EF.33
Furthermore, those reductions in CS correlated with thickening of the LV wall. The reduction in midmyocardial and epicardial CS values observed in their study suggested impaired myocardial function, and the preserved endocardial CS revealed a compensatory effect of an increase in the relative WT. Aurigemma et al reported that LV endocardial fractional shortening (FS) was preserved despite decreases in both the FS at the mid wall and LV long-axis shortening in hypertensive patients with LV hypertrophy and a normal LVEF.34
In addition, a concentric LV geometric change causes an increasing magnitude of systolic wall thickening and the resultant endocardial shift towards the cavity’s center with less myocardial fiber shortening in patients with hypertensive LV hypertrophy.35
In our study, LV WT increased, which correlated with the decrease in the basal CS and LS. However, as the magnitude of the LV WT in patients with T1DM in our study was less compared with that reported in patients with HCM, compensatory mechanisms did not maintain normal endocardial CS in the D3 group because of the long-term myocardial damage.
Impairment of Basal CS Before Apical CS
Streeter et al reported the rate of circumferentially to longitudinally oriented fibers to be 10:1, with this ratio increasing towards the base and decreasing towards the apex.36
This suggests that the effect of impaired contraction in the circumferential direction is more prominent at the basal level than at the apex, as the base constitutes a considerable fraction of the LV wall. Furthermore, Laplace’s law supports the idea that the larger cavity radius at the base than at the apex of the LV is more affected by interventricular pressure in the heart with subclinical myocardial damage.37
These findings support our results that impairment in the basal CS occurs without the papillary and apical CS.
Correlation Between the Reduction in Myocardial Deformation and the Duration of T1DM
In previous reports, the relationship between the decline in cardiac function and the duration of T1DM has been controversial. Yoldas et al showed that the GCS and GLS correlated with the duration of T1DM in T1DM children and adolescents who had good glycemic control with a mean HbA1c <7.5%.28
Importantly, Nakai et al indicated that the duration of T1DM was the only independent confounder for the reduction of LS by multivariate linear regression analysis.38
In our study, basal CS decreased, which correlated with the duration of T1DM, corresponding to the previous reports. These results indicate that the myocardium may accumulate damage caused by exposure to hyperglycemia even if the patients are treated with insulin,39–41
which would be reasonable even for DCM.
Clinical Implications
The LS in all 3 layers and the epicardial and midmyocardial CS at the basal level are considered to be useful and sensitive indicators of cardiac dysfunction caused by T1DM compared with conventional parameters. There is the possibility that each layer may play an important role as an early marker of cardiac dysfunction, which should be evaluated in future studies with a longitudinal follow-up and larger number of patients with T1DM, as shown in our previous studies.22,23
Our findings in this study have important clinical implications because these parameters may allow early therapeutic intervention at the stage of subclinical LV dysfunction using drugs, such as β-blockers, ACEIs, and ARBs to reduce wall stress and potentially improve the impairment of myocardial deformation. Furthermore, those parameters could allow more accurate evaluation of the therapeutic effects. In addition, T1DM patients with a longer duration of the disease should be monitored more carefully for cardiac function, even when HF is not occurring.
Study Limitations
First, the design of the study was cross-sectional. A longitudinal follow-up study would have yielded a more accurate time course of cardiac dysfunction. Second, this study included a wide range of age of onset, and various degrees of the frequency and level of hypoglycemic attacks and insulin therapy despite the small number of patients. Future studies with a larger sample size are necessary to provide a robust conclusion with regard to the time course of cardiac dysfunction. Third, although coupling with arterial function in considered as cardiac function, we did not evaluate this. A previous study documented abnormal arterial function in patients with T1DM aged around 20 years.42
Therefore, we should examine arterial function in our study subjects and consider which decreased earlier when compared with layer-specific strain. Finally, HbA1c did not correlate with the cardiac parameters despite the importance of the clinical outcomes.1
The lack of correlation between HbA1c and myocardial function may be explained by the fact that HbA1c reflects the glucose level only of the preceding 4 months. As an indicator of short-term hyperglycemia, it cannot show the relationship between glycemic control and cardiac function in long-disease-duration diabetic patients.
Conclusions
In patients with T1DM, the longitudinal deformation in all layers and the epicardial and midmyocardial circumferential deformation at the basal level decreased in patients aged from the late teens, which correlated with the duration of the disease and LV hypertrophy. The present findings are a novel insight into the characteristics of DCM in T1DM.
Acknowledgments
We thank the staff of Shizuoka Children’s Hospital for collecting the echocardiographic data for normal children and adults.
Supplementary Files
Please find supplementary file(s);
http://dx.doi.org/10.1253/circj.CJ-18-1245
References
- 1.
Lind M, Bounias I, Olsson M, Gudbjörnsdottir S, Svensson AM, Rosengren A. Glycaemic control and incidence of heart failure in 20,985 patients with type 1 diabetes: An observational study. Lancet 2011; 378: 140–146.
- 2.
Morimoto A, Onda Y, Nishimura R, Sano H, Utsunomiya K, Tajima N, et al. Cause-specific mortality trends in a nationwide population-based cohort of childhood-onset type 1 diabetes in Japan during 35 years of follow-up: The DERI Mortality Study. Diabetologia 2013; 56: 2171–2175.
- 3.
Soedamah-Muthu SS, Fuller JH, Mulnier HE, Raleigh VS, Lawrenson RA, Colhoun HM. High risk of cardiovascular disease in patients with type 1 diabetes in the UK: A cohort study using the general practice research database. Diabetes Care 2006; 29: 798–804.
- 4.
Laing SP, Swerdlow AJ, Slater SD, Burden AC, Morris A, Waugh NR, et al. Mortality from heart disease in a cohort of 23,000 patients with insulin-treated diabetes. Diabetologia 2003; 46: 760–765.
- 5.
Theilade S, Rossing P, Jensen JS, Jensen MT. Arterial-ventricular coupling in type 1 diabetes: Arterial stiffness is associated with impaired global longitudinal strain in type 1 diabetes patients: The Thousand & 1 Study. Acta Diabetol 2018; 55: 21–29.
- 6.
Zhou Y, Xiao H, Wu J, Zha L, Zhou M, Li Q, et al. Type I diabetic akita mouse model is characterized by abnormal cardiac deformation during early stages of diabetic cardiomyopathy with speckle-tracking based strain imaging. Cell Physiol Biochem 2018; 45: 1541–1550.
- 7.
Shepherd DL, Nichols CE, Croston TL, McLaughlin SL, Petrone AB, Lewis SE, et al. Early detection of cardiac dysfunction in the type 1 diabetic heart using speckle-tracking based strain imaging. J Mol Cell Cardiol 2016; 90: 74–83.
- 8.
Qiao YY, Zeng M, Li RJ, Leng ZT, Yang J, Yang Y. Layer-specific myocardial strain analysis: Investigation of regional deformation in a rabbit model of diabetes mellitus during different stages. Med Ultrason 2016; 18: 339–344.
- 9.
Bjornstad P, Truong U, Pyle L, Dorosz JL, Cree-Green M, Baumgartner A, et al. Youth with type 1 diabetes have worse strain and less pronounced sex differences in early echocardiographic markers of diabetic cardiomyopathy compared to their normoglycemic peers: A RESistance to InSulin in Type 1 ANd Type 2 diabetes (RESISTANT) Study. J Diabetes Complications 2016; 30: 1103–1110.
- 10.
Voulgari C, Papadogiannis D, Tentolouris N. Diabetic cardiomyopathy: From the pathophysiology of the cardiac myocytes to current diagnosis and management strategies. Vasc Health Risk Manag 2010; 6: 883–903.
- 11.
Miki T, Yuda S, Kouzu H, Miura T. Diabetic cardiomyopathy: Pathophysiology and clinical features. Heart Fail Rev 2013; 18: 149–166.
- 12.
Bugger H, Abel ED. Molecular mechanisms of diabetic cardiomyopathy. Diabetologia 2014; 57: 660–671.
- 13.
Poornima IG, Parikh P, Shannon RP. Diabetic cardiomyopathy: The search for a unifying hypothesis. Circ Res 2006; 98: 596–605.
- 14.
From AM, Scott CG, Chen HH. The development of heart failure in patients with diabetes mellitus and pre-clinical diastolic dysfunction. J Am Coll Cardiol 2010; 55: 300–305.
- 15.
Jedrzejewska I, Krol W, Swiatowiec A, Wilczewska A, Grzywanowska-Laniewska I, Dluzniewski M, et al. Left and right ventricular systolic function impairment in type 1 diabetic young adults assessed by 2D speckle tracking echocardiography. Eur Heart J Cardiovasc Imaging 2016; 17: 438–446.
- 16.
Gul K, Celebi AS, Kacmaz F, Ozcan OC, Ustun I, Berker D, et al. Tissue Doppler imaging must be performed to detect early left ventricular dysfunction in patients with type 1 diabetes mellitus. Eur J Echocardiogr 2009; 10: 841–846.
- 17.
Hodzic A, Ribault V, Maragnes P, Milliez P, Saloux E, Labombarda F. Decreased regional left ventricular myocardial strain in type 1 diabetic children: A first sign of diabetic cardiomyopathy? J Transl Int Med 2016; 4: 81–87.
- 18.
Labombarda F, Leport M, Morello R, Ribault V, Kauffman D, Brouard J, et al. Longitudinal left ventricular strain impairment in type 1 diabetes children and adolescents: A 2D speckle strain imaging study. Diabetes Metab 2014; 40: 292–298.
- 19.
Becker M, Ocklenburg C, Altiok E, Futing A, Balzer J, Krombach G, et al. Impact of infarct transmurality on layer-specific impairment of myocardial function: A myocardial deformation imaging study. Eur Heart J 2009; 30: 1467–1476.
- 20.
Hamada S, Schroeder J, Hoffmann R, Altiok E, Keszei A, Almalla M, et al. Prediction of outcomes in patients with chronic ischemic cardiomyopathy by layer-specific strain echocardiography: A proof of concept. J Am Soc Echocardiogr 2016; 29: 412–420.
- 21.
Yu W, Li SN, Chan GC, Ha SY, Wong SJ, Cheung YF. Transmural strain and rotation gradient in survivors of childhood cancers. Eur Heart J Cardiovasc Imaging 2013; 14: 175–182.
- 22.
Yamada M, Takahashi K, Kobayashi M, Yazaki K, Takayasu H, Akimoto K, et al. Mechanisms of left ventricular dysfunction assessed by layer-specific strain analysis in patients with repaired tetralogy of Fallot. Circ J 2017; 81: 846–854.
- 23.
Yazaki K, Takahashi K, Shigemitsu S, Yamada M, Iso T, Kobayashi M, et al. In-depth insight into the mechanisms of cardiac dysfunction in patients with childhood cancer after anthracycline treatment using layer-specific strain analysis. Circ J 2018; 82: 715–723.
- 24.
Westermeier F, Riquelme JA, Pavez M, Garrido V, Diaz A, Verdejo HE, et al. New molecular insights of insulin in diabetic cardiomyopathy. Front Physiol 2016; 7: 125.
- 25.
Murarka S, Movahed MR. Diabetic cardiomyopathy. J Card Fail 2010; 16: 971–979.
- 26.
Schilling JD, Mann DL. Diabetic cardiomyopathy: Bench to bedside. Heart Fail Clin 2012; 8: 619–631.
- 27.
Jensen MT, Sogaard P, Andersen HU, Bech J, Hansen TF, Galatius S, et al. Prevalence of systolic and diastolic dysfunction in patients with type 1 diabetes without known heart disease: The Thousand & 1 Study. Diabetologia 2014; 57: 672–680.
- 28.
Yoldas T, Orun UA, Sagsak E, Aycan Z, Kaya O, Ozgur S, et al. Subclinical left ventricular systolic and diastolic dysfunction in type 1 diabetic children and adolescents with good metabolic control. Echocardiography 2018; 35: 227–233.
- 29.
Wai B, Patel SK, Ord M, MacIsaac RJ, Jerums G, Srivastava PM, et al. Prevalence, predictors and evolution of echocardiographically defined cardiac abnormalities in adults with type 1 diabetes: An observational cohort study. J Diabetes Complications 2014; 28: 22–28.
- 30.
Carugo S, Giannattasio C, Calchera I, Paleari F, Gorgoglione MG, Grappiolo A, et al. Progression of functional and structural cardiac alterations in young normotensive uncomplicated patients with type 1 diabetes mellitus. J Hypertens 2001; 19: 1675–1680.
- 31.
Ishizu T, Seo Y, Enomoto Y, Sugimori H, Yamamoto M, Machino T, et al. Experimental validation of left ventricular transmural strain gradient with echocardiographic two-dimensional speckle tracking imaging. Eur J Echocardiogr 2010; 11: 377–385.
- 32.
Adamu U, Schmitz F, Becker M, Kelm M, Hoffmann R. Advanced speckle tracking echocardiography allowing a three-myocardial layer-specific analysis of deformation parameters. Eur J Echocardiogr 2009; 10: 303–308.
- 33.
Okada K, Yamada S, Iwano H, Nishino H, Nakabachi M, Yokoyama S, et al. Myocardial shortening in 3 orthogonal directions and its transmural variation in patients with nonobstructive hypertrophic cardiomyopathy. Circ J 2015; 79: 2471–2479.
- 34.
Aurigemma GP, Silver KH, Priest MA, Gaasch WH. Geometric changes allow normal ejection fraction despite depressed myocardial shortening in hypertensive left ventricular hypertrophy. J Am Coll Cardiol 1995; 26: 195–202.
- 35.
Desimone G, Devereux R. Rationale of echocardiographic assessment of left ventricular wall stress and midwall mechanics in hypertensive heart disease. Eur J Echocardiogr 2002; 3: 192–198.
- 36.
Streeter DD Jr, Spotnitz HM, Patel DP, Ross J Jr, Sonnenblick EH. Fiber orientation in the canine left ventricle during diastole and systole. Circ Res 1969; 24: 339–347.
- 37.
Attias D, Macron L, Dreyfus J, Monin JL, Brochet E, Lepage L, et al. Relationship between longitudinal strain and symptomatic status in aortic stenosis. J Am Soc Echocardiogr 2013; 26: 868–874.
- 38.
Nakai H, Takeuchi M, Nishikage T, Lang RM, Otsuji Y. Subclinical left ventricular dysfunction in asymptomatic diabetic patients assessed by two-dimensional speckle tracking echocardiography: Correlation with diabetic duration. Eur J Echocardiogr 2009; 10: 926–932.
- 39.
Krolewski AS. The changing natural history of nephropathy in type I diabetes. Am J Med 1985; 78: 785–794.
- 40.
Porta M, Sjoelie AK, Chaturvedi N, Stevens L, Rottiers R, Veglio M, et al. Risk factors for progression to proliferative diabetic retinopathy in the EURODIAB Prospective Complications Study. Diabetologia 2001; 44: 2203–2209.
- 41.
Tesfaye S, Chaturvedi N, Eaton SEM, Ward JD, Manes C, Ionescu-Tirgoviste C, et al. Vascular risk factors and diabetic neuropathy. N Engl J Med 2005; 352: 341–350.
- 42.
Heier M, Stensaeth KH, Brunborg C, Seljeflot I, Margeirsdottir HD, Hanssen KF, et al. Increased arterial stiffness in childhood onset diabetes: A cardiovascular magnetic resonance study. Eur Heart J Cardiovasc Imaging 2018; 19: 694–700.