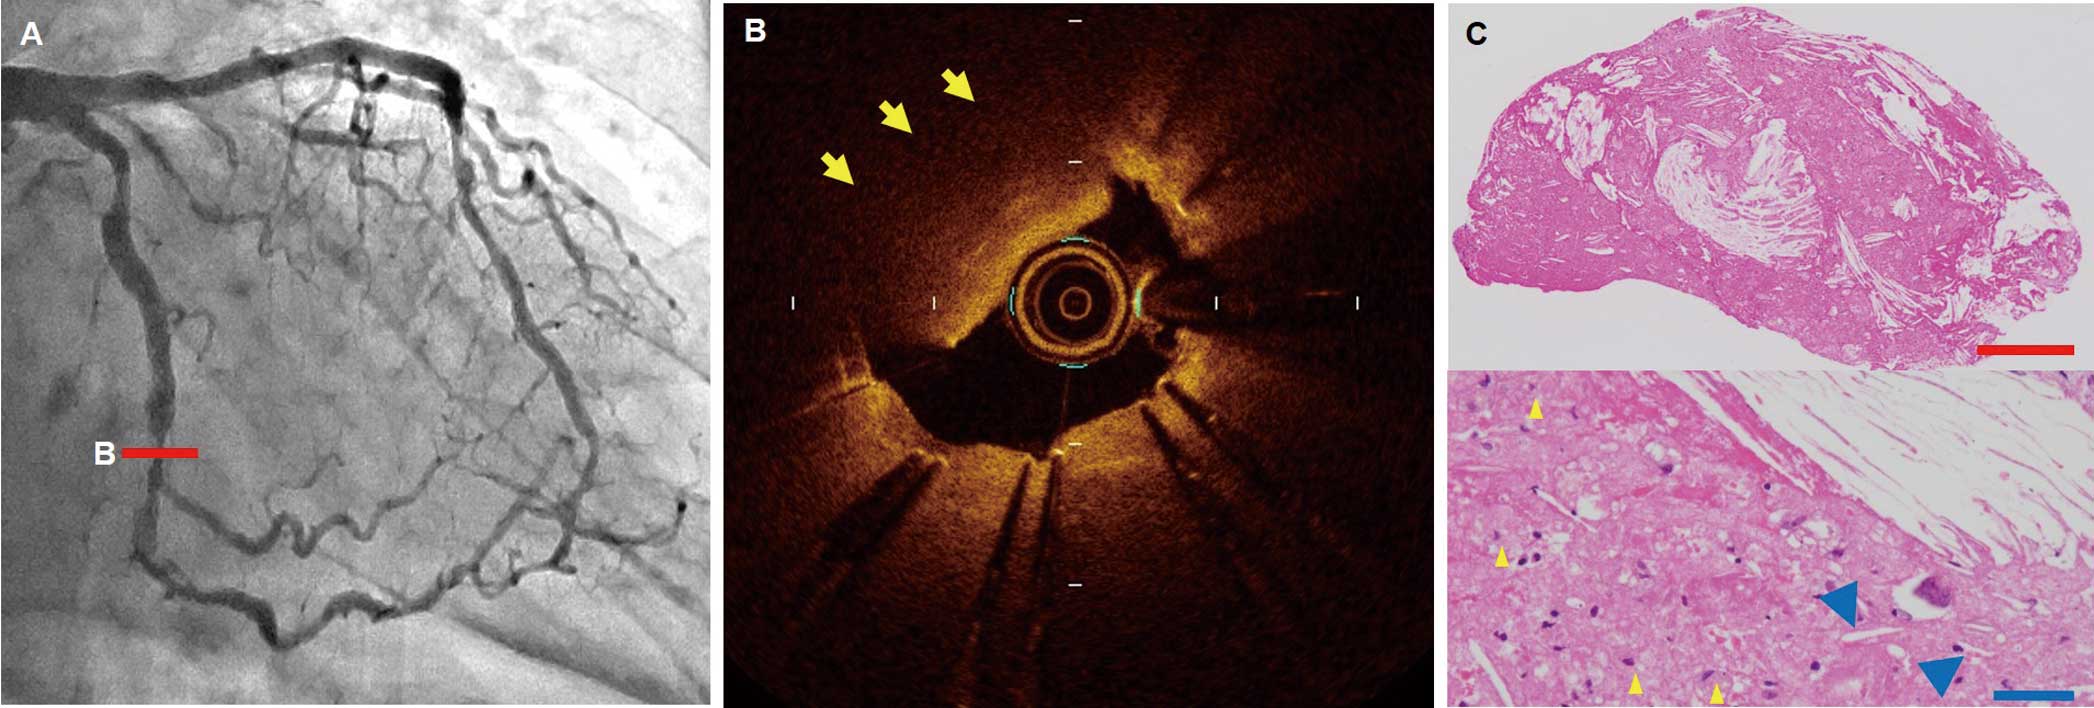
An 81-year-old man underwent percutaneous coronary intervention in the left circumflex coronary artery with 2 third-generation drug-eluting stents (Supplementary Figure A–C). Final intravascular ultrasound showed neither tissue protrusion nor malapposition (Supplementary Figure D). The patient was maintained on dual-antiplatelet therapy with aspirin and prasugrel. One month later, repeat coronary angiogram showed an 80% stenosis in the middle of the stents (Figure A). Optical coherence tomography (OCT) indicated a high-backscattering protruding mass with an irregular surface in the stent (Figure B; Supplementary Movie). Manual aspiration was attempted, and the mass was successfully removed. On histology the mass consisted of cholesterin crystals, foam cells, and necrotic debris (Figure C). Histological analysis confirmed that the removed tissue consisted of atheromatous materials. Neoatherosclerosis has previously been shown to develop in the late phase (>3 years) after stenting.1
Therefore, a potential mechanism for the acute development of atherosclerotic tissue early after stenting may be delayed protrusion of the underlying necrotic core beyond the stent struts into the lumen.
Disclosures
The authors declare no conflicts of interest.
Supplementary Files
Supplementary Movie.
Optical coherence tomography pull-back before the second treatment.
Please find supplementary file(s);
http://dx.doi.org/10.1253/circj.CJ-18-1248
