Clinical Implications of Ventricular Repolarization Parameters on Long-Term Risk of Atrial Fibrillation ― Longitudinal Follow-up Data From a General Ambulatory Korean Population ―
Article ID: CJ-19-1151

Details
Article ID: CJ-19-1151
Background: This study investigated 12-lead electrocardiogram (ECG) predictors associated with atrial fibrillation (AF) or flutter (AFL), specifically whether ventricular repolarization abnormalities in surface ECG (i.e., non-specific ST-T abnormalities [NSSTTA], QT prolongation, early repolarization [ER]) were associated with the development of AF or AFL.
Methods and Results: This study included 16,793 ambulatory Koreans (mean age 48.2 years, 62.3% male) who underwent medical check-ups at Asan Medical Center in 2002 (NSSTTA, n=1,037 [6.2%]; ER, n=1,493 [8.9%]). The primary outcome was the incidence of ECG-documented AF or AFL. During follow-up, new-onset AF or AFL was documented in 334 subjects (2.0%). The incidence of AF or AFL at the 10-year follow-up was higher in patients with than without NSSTTA (3.5% vs. 1.6%; hazard ratio [HR] 1.79, 95% confidence interval [CI] 1.28–2.50). The QT interval was associated with a higher risk of AF or AFL (HR 1.12 [95% CI 1.07–1.17] per 10 ms), and the risk was even higher in patients with multiple-region NSSTTA (HR 2.30; 95% CI 1.64–3.21) and NSSTTA with QT prolongation (HR 4.06; 95% CI 2.14–7.69). ER was not associated with a higher risk of AF or AFL (HR 1.02; 95% CI 0.71–1.46).
Conclusions: NSSTTA and QT prolongation, but not ER, were associated with a higher risk of future AF or AFL in a general ambulatory population after adjusting for parameters of atrial depolarization.
Atrial fibrillation (AF) is the most common form of cardiac arrhythmia and, as the average life expectancy in developed countries increases, the clinical importance of AF also increases.1–3 Because AF is associated with increased cardiovascular morbidities and higher mortalities, early detection and proper management of AF are crucial in terms of improving general health care. In this regard, more intuitive and objective predictors of AF are required.4,5 However, because the small amplitude of atrial electrical activity is obscured by ventricular depolarization, abnormalities in atrial depolarization or repolarization are difficult to detect.
Generally, the ST segment and T wave in the electrocardiogram (ECG) reflect the status of ventricular repolarization.6 Non-specific ST-T abnormality (NSSTTA) is a well-evaluated repolarization parameter related to ventricular arrhythmia and long-term mortality.7–12 Similarly, QT prolongation13 and early repolarization (ER) patterns14 are associated with adverse cardiovascular outcomes. However, the specific relevance of these parameters to atrial arrhythmia has not been investigated in depth. A previous study by Watanabe et al showed a possible link between ST segment abnormalities and AF, but various repolarization abnormalities, such as T wave abnormality, QT prolongation, or ER patterns, were not addressed in detail.15 Therefore, in the present study we investigated the hypothesis that ECG ventricular repolarization parameters could be related to the structural and functional changes of the atrial substrate because they are anatomically and functionally interrelated, and that they could be associated with future atrial arrhythmia. The hypothesis was tested by analyzing the occurrence of AF in a large-sized longitudinal follow-up data set of the Korean general population.
In all, 26,951 people visited the Health Promotion Center of Asan Medical Center for a routine health check-up from January 2002 through December 2002. The overall characteristics and long-term outcomes of the cohort have been published elsewhere.16 Considering that the ST and T waves are affected by a range of structural and functional disorders, patients with self-reported cardiovascular diseases or pathologic ECG patterns associated with ST-T changes were excluded from the study. Specifically, patients with QRS changes including pre-excitation or bundle branch block (n=578), paced rhythm (n=5), pathologic Q wave (n=11), spontaneous Type 1 Brugada syndrome (n=2), a history of coronary artery disease (n=423), and electrocardiographic left ventricular hypertrophy according to Sokolow-Lyon criteria (n=1,037) were excluded from the analysis. Patients with AF rhythm on the baseline ECG (n=66) were also excluded. Of the remaining patients (n=24,819), follow-up ECGs were available for 16,793 (67.7%), who comprised the final study population.
ElectrocardiographyRepresentative repolarization parameters, including QT interval, ER patterns, and ST-T wave abnormality, were evaluated. A diagnosis of NSSTTA was made according to the Minnesota Codes (MC) 4-1 to 4-4 and 5-1 to 5-4.17 Briefly, ST segment abnormalities were defined as horizontal or downward-sloping STJ depression ≥1 mm in Leads I, II, aVL, aVF or V1–V6 (MC 4-1); STJ depression ≥0.5 and <1 mm in Leads I, II, aVL, aVF, or V1–V6 (MC 4-2); ST segment downward sloping and ST segment or T wave nadir ≥0.5 mm below the P–R baseline in Leads I, II, aVL, or V1–V6 (MC 4-3); and upward-sloping STJ depression ≥1 mm in Leads I, II, aVL, or V1–V6 (MC 4-4). T wave abnormalities were defined as a negative T wave ≥5 mm in Leads I, II, or V2–V6 (MC 5-1); negative or diphasic T waves with a negative phase at least ≥1 mm, but not as deep as 5 mm, in Leads I, II, or V2–V6 (MC 5-2); flat or negative or diphasic (negative-positive) T waves with a <1.0 mm negative phase in Leads I, II, aVL, or V3–V6 (MC 5-3); and a positive T wave amplitude and a T/R amplitude ratio <1/20 in Leads I, II, aVL, or V3–V6 (MC 5-4). Patients were defined as having major NSSTTA if they had any of components of MC 4-1, 4-2, 5-1, and 5-2; minor NSSTTA was defined as MC 4-3, 4-4, 5-3, and 5-4. The distribution of these repolarization parameters was classified as anterolateral (Leads I, aVL, V6), posterior (Leads II, III, aVF), or anterior (Leads V1–V5). The number of ECG regions showing NSSTTA was counted for further analysis.
We also assessed the association of the ER pattern with future risk of AF, because the ER pattern is related to the early phase of ventricular repolarization and future cardiovascular risk.14 The diagnosis of ER patterns was in line with the recent consensus paper:18 (1) a QRS notch or slur on the downward slope of an R wave; and (2) a J wave peak ≥0.1 mV in 2 contiguous leads, which is similar to the definition proposed by Haissaguerre et al.19
To evaluate the association of atrial depolarization parameters with the future development of AF, we compared the effects of right and left atrial enlargement as defined by the Physician’s guide to Marquette Electronics Resting ECG Analysis (Marquette Electronics, Milwaukee, WI, USA).20 Right atrial enlargement was diagnosed when P wave amplitude was >250 µV in any of Leads II, III, aVF, V1, or V2. A diagnosis of left atrial enlargement was made if the P terminal force amplitude was less than −100 µV, duration was ≥60 ms, and amplitude area was ≥4,000 µV · ms in Leads V1 or V2.
Digital ECG signals were acquired with a filter set at 0.16–150 Hz. All ECG intervals, including the QT interval, were measured automatically by the MUSE system algorithm (Marquette Medical Systems, Milwaukee, WI, USA). QT prolongation was defined as QTc interval corrected by Bazett’s formula (>450 ms in men, >470 ms in women).13 For analysis of ER and NSSTTA, morphologic parameters of ECGs were interpreted by 2 cardiologists (MSC and G-BN) blinded to the baseline characteristics and clinical outcomes. Intra- and interobserver agreements from 100 random samples showed κ values of 0.95 and 0.91, respectively, for NSSTTA and 0.93 and 0.90, respectively, for the ER pattern. Cases with discordant interpretation were resolved by consensus with an opinion from a third cardiologist.
Study Outcome and Follow-upThe primary outcome of the study was documented AF or atrial flutter (AFL) lasting more than 30 s on Holter monitoring or sufficiently long for a 12-lead ECG to be recorded.21 All forms of documented ECGs (e.g., standard 12-lead ECG, Holter monitoring, or telemetry monitoring during admission) were reviewed to denote the development of AF or AFL. Patients were followed-up to the time of last ECG documentation or the development of study outcomes.
Statistical AnalysisAll statistical analyses were performed using R version 3.3.1 (http://cran.r-project.org/). Continuous variables are expressed as the mean±SD, and categorical variables are expressed as percentages. Comparisons between 2 groups were conducted using Student’s t-test or the Wilcoxon rank sum test for continuous variables, and Chi-squared or Fisher’s exact tests, as appropriate. Unadjusted event rates during follow-up were estimated using the Kaplan-Meier method and compared using the log-rank test.
Three 3 Cox proportional hazards models were used to assess the association of repolarization parameters with the risk of AF or AFL. In Model 1, repolarization parameter alone was included. Model 2 was further adjusted for age and sex. Model 3 was adjusted for all clinical and ECG variables to evaluate the independent association of repolarization parameters with AF risk. The proportional hazards assumption was tested by log-log survival curves and partial Schoenfeld residuals, and no significant violation was noted.
In all, 16,793 patients met the study criteria for inclusion and were included in the analysis (Figure 1). The baseline characteristics of the patients with NSSTTA (n=1,037, 6.2%) are summarized in Table 1. Compared with patients without NSSTTA, those with NSSTTA had were older age, a higher proportion had hypertension, and lower proportions were male and smokers.
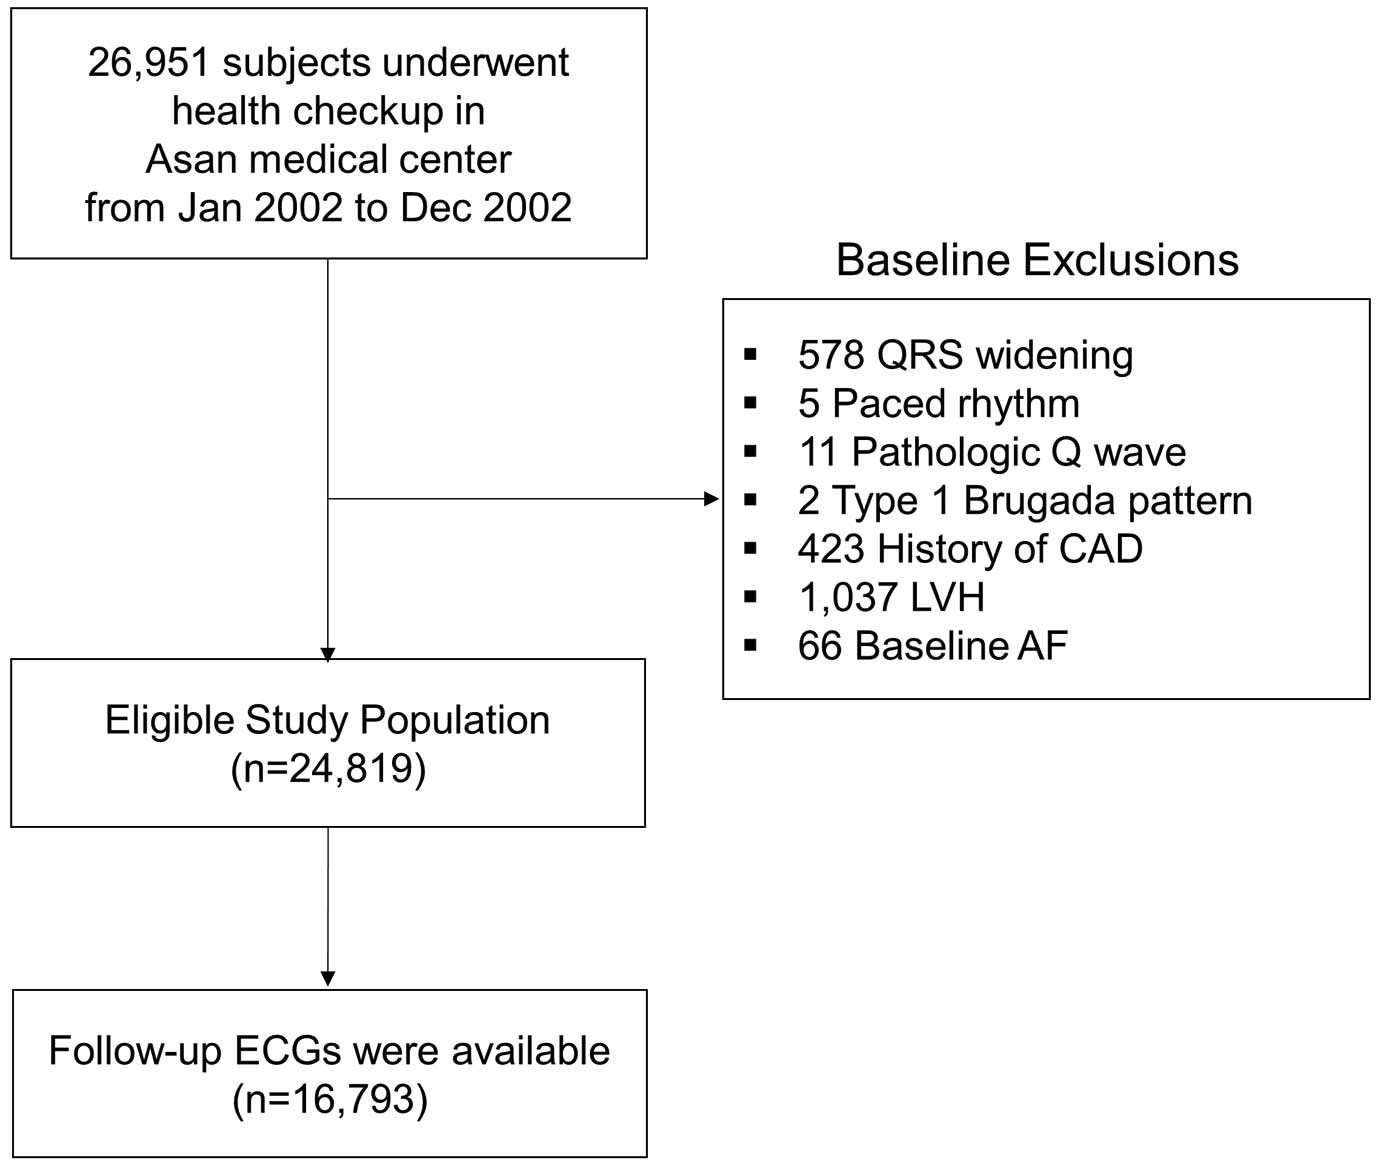
Study flow diagram. AF, atrial fibrillation; CAD, coronary artery disease; ECG, electrocardiography; LVH, left ventricular hypertrophy.
| Total population (n=16,793) |
NSSTTA | QT prolongation | ER pattern | |||||||
|---|---|---|---|---|---|---|---|---|---|---|
| No (n=15,756) |
Yes (n=1,037) |
P-value | No (n=16,263) |
Yes (n=530) |
P-value | No (n=15,300) |
Yes (n=1,493) |
P-value | ||
| Age (years) | 48.2± 9.4 |
48.0± 9.3 |
50.4± 10.4 |
<0.001 | 48.0± 9.4 |
52.9± 10.0 |
<0.001 | 48.2± 9.4 |
48.1± 9.3 |
0.783 |
| Male sex | 10,456 (62.3) |
9,982 (63.4) |
474 (45.7) |
<0.001 | 10,087 (62.0) |
369 (69.6) |
<0.001 | 9,252 (60.5) |
1,204 (80.6) |
<0.001 |
| Hypertension | 2,330 (13.9) |
2,098 (13.3) |
232 (22.4) |
<0.001 | 2,191 (13.5) |
139 (26.2) |
<0.001 | 2,107 (13.8) |
223 (14.9) |
0.229 |
| Diabetes | 999 (5.9) |
924 (5.9) |
75 (7.2) |
0.083 | 950 (5.8) |
49 (9.2) |
0.002 | 898 (5.9) |
101 (6.8) |
0.181 |
| Current smoker | 4,249 (25.3) |
4,041 (25.6) |
208 (20.1) |
<0.001 | 4,117 (25.3) |
132 (24.9) |
0.871 | 3,723 (24.3) |
526 (35.2) |
<0.001 |
| HR (beats/min) | 64.7± 10.4 |
64.6± 10.3 |
64.9± 10.9 |
0.565 | 64.3± 10.0 |
76.4± 13.4 |
<0.001 | 64.8± 10.4 |
63.2± 10.3 |
<0.001 |
| Atrial enlargement |
315 (1.9) |
284 (1.8) |
31 (3.0) |
0.009 | 282 (1.7) |
33 (6.2) |
<0.001 | 290 (1.9) |
25 (1.7) |
0.617 |
| PR interval (ms) | 164.1± 22.4 |
164.1± 22.3 |
163.3± 23.6 |
0.269 | 164.0± 22.4 |
165.1± 22.5 |
0.283 | 163.9± 22.3 |
166.0± 23.4 |
0.001 |
| QRS width (ms) | 92.9± 10.0 |
92.9± 10.0 |
93.7± 10.5 |
0.016 | 92.8± 10.0 |
95.4± 10.3 |
<0.001 | 92.8± 10.1 |
94.3± 9.7 |
<0.001 |
| QTc (ms) | 404.8± 30.1 |
416.5± 19.6 |
423.8± 24.7 |
<0.001 | 415.3± 17.5 |
470.0± 21.0 |
<0.001 | 404.7± 30.1 |
405.3± 30.9 |
0.474 |
| NSSTTA | 1,037 (6.2) |
– | – | – | 966 (5.9) |
71 (13.4) |
<0.001 | 972 (6.4) |
65 (4.4) |
0.003 |
| QT prolongation | 530 (3.2) |
459 (2.9) |
71 (6.8) |
<0.001 | – | – | – | 491 (3.2) |
39 (2.6) |
0.237 |
| ER | 1,493 (8.9) |
1,428 (9.1) |
65 (6.3) |
0.003 | 1,454 (8.9) |
39 (7.4) |
0.237 | – | – | – |
Unless indicated otherwise, data are given as the mean±SD or n (%). ER, early repolarization; HR, heart rate; NSSTA, non-specific ST-T abnormality.
ECG characteristics and the distribution of NSSTTA are shown in Figures 2 and 3. Most patients (95.3%) with NSSTTA had any ECG changes indicating minor NSSTTA in any lead, whereas only 15.9% of patients with NSSTTA had changes indicating major abnormalities. T wave abnormalities (95.3%) were more frequent than ST segment abnormalities (40.7%). In terms of location, NSSTTA was more frequently found in the inferior leads (67.3%) than in the anterior (31.8%) or lateral (34.1%) leads. NSSTTA was found in multiple regions in 26.9% of patients, and in single regions in the remaining patients.

Representative examples of electrocardiogram (ECG) patterns for non-specific ST-T wave abnormalities. (A) Major T wave abnormality (negative T wave ≥5 mm); (B) minor T wave abnormality (T/R amplitude ratio <1/20); (C) major ST segment abnormality (horizontal ST depression ≥1 mm) with major T wave abnormality; (D) minor ST segment abnormality (downward-sloping ST segment) with major T wave abnormality; (E) early repolarization pattern (J wave peak ≥0.1 mV in 2 contiguous leads).

Characteristics and distribution of non-specific ST-T wave abnormalities (NSSTTA). Ant, anterior lead; Inf, inferior lead; Lat, lateral lead; Major, major NSSTTA (see text for definition); Minor, minor NSSTTA (see text for definition); Multi, NSSTTA in multiple regions; Single, NSSTTA in single regions; ST, ST segment abnormalities; T, T wave abnormalities.
The mean QTc interval of the overall population was 404.8±30.1 ms and QT prolongation was identified in 3.2% of the overall population (n=530). ER pattern ECGs were found in 9.0% (n=1,493) of the overall population. The mean age did not differ significantly between patients with and without ER, although the ER group contained more males and smokers (Table 1).
Implication of Repolarization Abnormalities on Long-Term Risk of AFThe median follow-up duration of the overall population was 8.5 years (interquartile range 3.9–12.9 years). During the follow-up period, new-onset AF or AFL was diagnosed in 334 patients (2.0%). Most patients presented with AF (n=300; 89.8%) rather than AFL (n=34; 10.2%). In terms of the ECG mode used, 76.9% (n=257) of patients were diagnosed with a 12-lead ECG, 18.3% (n=61; including 47 documented on 12-lead ECG) were diagnosed with Holter monitoring, and 51.2% (n=171; including 108 documented on 12-lead ECG) were diagnosed with telemetry monitoring during admission. In the Kaplan-Meier analysis, the 10-year overall incidence of new-onset AF or AFL was significantly higher in patients with than without NSSTTA (3.5±0.7% vs. 1.6±0.1%, respectively; P<0.001; Figure 4). The prognostic significance of NSSTTA on future AF or AFL was further evaluated using Cox proportional hazard models (Table 2; Supplementary Table). In crude analysis, NSTTA was significantly associated with a higher risk of future AF or AFL (hazard ratio [HR] 2.28; 95% confidence interval [CI] 1.64–3.16; P<0.001). This trend was consistent after adjusting for age and sex (Model 2; HR 2.15; 95% CI 1.55–3.00; P<0.001) and all other clinical or ECG variables (Model 3; HR 1.79; 95% CI 1.28–2.50; P<0.001). Further subgroup analysis demonstrated that major NSSTTA (HR 2.25; 95% CI 1.19–4.24; P=0.012), NSSTTA in multiple regions (HR 2.52; 95% CI 1.57–4.04; P<0.001), and NSSTTA in anterior (HR 2.50; 95% CI 1.56–4.02; P<0.001) or lateral (HR 2.41; 95% CI 1.58–3.68; P<0.001) leads were associated with a higher risk of developing AF or AFL than in control subjects (Table 3). The increased risk was consistently observed when the outcome was restricted to the development of AF (Model 1: HR 2.50, 95% CI 1.79–3.49, P<0.001; Model 2: HR 2.31, 95% CI 1.65–3.24, P<0.001; Model 3: HR 1.94, 95% CI 1.38–2.74, P<0.001).

Ten-year incidence rates of atrial fibrillation (AF) or atrial flutter (AFL) according to the presence or absence of (A) non-specific ST-T abnormalities (NSSTTA), (B) QT prolongation, and (C) the early repolarization (ER) pattern on baseline electrocardiography.
| Outcomes | HR (95% CI) | P-value |
|---|---|---|
| By NSSTTA | ||
| Model 1: adjusted for NSSTTA | 2.28 (1.64–3.16) | <0.001 |
| Model 2: adjusted for NSSTTA, age, sex | 2.15 (1.55–3.00) | <0.001 |
| Model 3: adjusted for NSSTTA and all other variables | 1.79 (1.28–2.50) | <0.001 |
| By QTc interval (per 10-ms increment) | ||
| Model 1: adjusted for QTc | 1.14 (1.10–1.19) | <0.001 |
| Model 2: adjusted for QTc, age, sex | 1.14 (1.09–1.19) | <0.001 |
| Model 3: adjusted for QTc and all other variables | 1.12 (1.07–1.17) | <0.001 |
| By QTc prolongation | ||
| Model 1: adjusted for QTc prolongation | 4.18 (3.02–5.80) | <0.001 |
| Model 2: adjusted for QTc prolongation, age, sex | 2.85 (2.05–3.97) | <0.001 |
| Model 3: adjusted for QTc prolongation and all other variables | 2.30 (1.64–3.21) | <0.001 |
| By ER | ||
| Model 1: adjusted for ER | 1.13 (0.79–1.62) | 0.511 |
| Model 2: adjusted for ER, age, sex | 0.97 (0.68–1.39) | 0.875 |
| Model 3: adjusted for ER and all other variables | 1.02 (0.71–1.46) | 0.929 |
CI, confidence interval; ER, early repolarization; HR, hazard ratio; NSSTTA, non-specific ST-T wave abnormalities.
| NSSTTA pattern | Crude event rate (%) |
Univariable analysis | Multivariable analysis | ||
|---|---|---|---|---|---|
| HR (95% CI) | P-value | HR (95% CI) | P-value | ||
| MajorA | 13/199 (6.5) | 3.09 (1.77–5.37) | <0.001 | 2.25 (1.19–4.24) | 0.012 |
| MinorB | 41/1,097 (3.7) | 2.04 (1.48–2.82) | <0.001 | 1.88 (1.32–2.67) | <0.001 |
| ST segment abnormalityC | 22/471 (4.7) | 2.59 (1.68–3.98) | <0.001 | 2.15 (1.36–3.39) | 0.001 |
| T wave abnormalityD | 44/1,100 (4.0) | 2.13 (1.55–2.91) | <0.001 | 1.98 (1.41–2.75) | <0.001 |
| Abnormality in: | |||||
| Anterior leads | 21/367 (5.7) | 2.84 (1.83–4.41) | <0.001 | 2.50 (1.56–4.02) | <0.001 |
| Inferior leads | 24/769 (3.1) | 1.75 (1.13–2.73) | 0.013 | 1.71 (1.10–2.68) | 0.018 |
| Lateral leads | 28/417 (6.7) | 3.58 (2.44–5.27) | <0.001 | 2.41 (1.58–3.68) | <0.001 |
| One region | 23/836 (2.8) | 1.55 (1.01–2.36) | 0.043 | 1.67 (1.08–2.59) | 0.021 |
| Multiple regions | 23/319 (7.2) | 3.53 (2.31–5.38) | <0.001 | 2.52 (1.57–4.04) | <0.001 |
| With QT prolongation | 10/71 (14.1) | 7.79 (4.15–14.63) | <0.001 | 4.06 (2.14–7.69) | <0.001 |
| Without QT prolongation | 31/966 (3.2) | 1.86 (1.28–2.69) | 0.001 | 1.69 (1.16–2.46) | 0.006 |
APatients were defined as having major NSSTTA if they had any of components of MC 4-1, 4-2, 5-1, and 5-2. BPatients were defined as having minor if they had any of components of MC 4-3, 4-4, 5-3, and 5-4. CPatients were defined as having ST segment abnormalities if they had any components of MC 4-1, 4-2, 4-3, or 4-4. DPatients were defined as having T wave abnormalities if they had any components of MC 5-1, 5-2, 5-3, or 5-4. MC, Minnesota code. Other abbreviations as in Table 2.
The mean QT interval was significantly longer in patients who developed AF than in those who did not (424.1±23.7 vs. 416.9±20.0 ms, respectively; P<0.001). Patients with QT prolongation were at significantly higher risk of future AF or AFL at the 10-year follow-up (7.4% vs. 1.4%, respectively; P<0.001; Figure 4). In the multivariable model, QT prolongation was associated with a higher risk of AF or AFL when it was entered as a continuous variable (per 10 ms: HR 1.12, 95%, CI 1.07–1.17, P<0.001) or as a dichotomized variable (QT prolongation: HR 2.30, 95% CI 1.64–3.21, P<0.001; Table 2). The presence of both NSSTTA and QT prolongation was associated with an even higher risk of AF or AFL (HR 4.06; 95% CI 2.14–7.69; P<0.001; Table 3).
In the case of ER, the 10-year incidence of AF or AFL was not significantly different between those with and without an ER pattern on the ECG (Figure 4). ER was not associated with future risk of AF or AFL in crude or multivariable-adjusted Cox proportional hazard models (Table 2).
In this large-scale retrospective analysis of the ambulatory Korean population, the following novel associations were found between ECG repolarization parameters and future AF or AFL risk: (1) patients with NSSTTA were at higher risk of AF or AFL during long-term follow-up; (2) patients with specific NSSTTA patterns, especially multiple regions and major NSSTTA, were at even higher risk of AF or AFL; (3) patients with QT prolongation were also at a higher risk of AF or AFL; and (4) the ER pattern did not have any prognostic implications for future development of AF or AFL. Because AF and AFL are the most common tachyarrhythmias in clinical practice, defining high-risk patients prone to developing AF is clinically important. This study showed the association between ventricular repolarization parameters and AF development, which may be useful for defining high-risk patients in the general population.
In a previous study, both mild (HR 1.66; 95% CI 1.13–2.43) and severe (HR 5.12; 95% CI 2.30–11.38) ST segment abnormalities were independent predictors of AF even after adjusting for clinical variables.15 The authors of that study attributed these results to underlying myocardial changes secondary to the presence of left ventricular hypertrophy (LVH) or other myocardial structural alterations. The results of the present study confirm those reported by Watanabe et al,15 and clearly demonstrate an independent association between repolarization abnormalities and future AF risk. Prior population-based studies reported that the presence of major NSSTTA was associated with a higher risk of cardiovascular events or mortality,7,8,12 and this association was consistent even in patients with minor NSSTTA.9–12 The possible mechanism linking NSSTTA and cardiovascular events is partly explained by LVH, subclinical structural abnormalities, hidden coronary artery disease, or age-related autonomic changes.22,23 Considering that the ventricle and atrium are closely interrelated, both anatomically and functionally, any abnormalities in ventricular repolarization may affect the electrophysiologic properties of the atria. One possible mechanism linking ventricular repolarization abnormality and the development of AF is diastolic dysfunction of the ventricle. Diastolic dysfunction rendered by the aforementioned structural changes leads to elevated left ventricular end-diastolic pressure and subsequently left atrial pressure. Continuous stretching and scarring from elevated atrial pressure may lead to the development of AF. Recent reports of the association between diastolic dysfunction and P wave dispersion or P wave terminal force in V1 supports this explanation,24–26 and the characteristics of AF patients in the present study population (older, higher proportions of subjects with hypertension and diabetes) are in line with this ECG change. In addition, considering that the aforementioned electrical remodeling is known to be associated with early diastolic dysfunction that precedes the manifested structural remodeling, the identification of electrical markers would be useful for the early detection of subsequent arrhythmic events.27 The predictive value of the QT interval was also assessed in the same context.28 However, the clinical usefulness of QT prolongation is hampered because accurate measurement of the QT interval is difficult, even when it is measured by cardiologists, and differences between normal and abnormal values are often too subtle to recognize.29 Although the ER pattern also has been associated with higher cardiovascular risk,14,16,19 it was not associated with an elevated risk of AF in the present study population. It is intriguing that different parameters of ventricular repolarization had differential effects in predicting future atrial arrhythmia. Further studies are needed to assess the differential functional or structural changes associated with these electrical parameters. Considering that atrial repolarization characteristics are difficult to assess in the 12-lead ECG, our finding of ventricular repolarization abnormalities as surrogate markers of the atrial substrate may be of clinical value for predicting the future occurrence of AF. The clinical usefulness of these predictors for preventing subsequent cardiovascular events associated with AF requires further evaluation.
Potential limitations of the present study should be considered. First, the present study was retrospective cohort study, and so the results should be considered only as hypothesis generating. In addition, because we only included patients with available follow-up ECGs, there is a chance of selection bias. The lack of a standardized follow-up protocol is another important limitation. Due to the retrospective nature of the study, we could not fully assess the reason for the lack of follow-up ECGs or Holter monitoring, and this may be another source of selection bias. Because the mean age of subjects was somewhat younger than that of real-world AF patients, a more extended period of observation would be needed for greater relevance to the clinical setting regarding elderly patients. Because NSSTTA could change over time,11 the results could be influenced by the number and timing of the ECG recording. We could not analyze atrial depolarization parameters in detail, but we believe our results are robust because the incorporation of atrial enlargement (HR 6.69, 95% CI 5.04–8.89, P<0.001 in univariable analysis) did not affect the association of repolarization parameters in multivariate analysis. Finally, the results should not be considered as repolarization abnormalities in subjects with a structurally normal heart because we excluded patients with structural heart disease only on the basis of self-reported coronary artery disease or baseline ECG abnormalities. This point is important because the exclusion of ECG-detected myocardial changes in our analysis (LVH, bundle branch block or interventricular conduction delay, pacing, Q wave, and Brugada pattern) cannot completely exclude the presence of structural heart disease. The lack of data from imaging or functional studies is also associated with this limitation.
In conclusion, NSSTTA and QT prolongation in the 12-lead ECG were associated with a higher risk of future AF or AFL in the general ambulatory population after adjustment for atrial depolarization, whereas the ER pattern was not significantly associated with an increased risk of AF or AFL.
None.
This study did not receive any specific funding.
None declared.
This study was approved by the Institutional Review Board of Asan Medical Center (2016-1239), which waived the need for informed consent.
Data supporting the findings of this study are available from the corresponding author upon reasonable request.
Please find supplementary file(s);
http://dx.doi.org/10.1253/circj.CJ-19-1151