Abstract
Background:
This prospective randomized multicenter open-label trial evaluated whether sodium-glucose cotransporter-2 inhibitor (SGLT2-i) improves left ventricular (LV) pump function and suppresses elevation of LV filling pressure (LVFP) and right ventricular systolic pressure (RVSP) during exercise in type 2 diabetes mellitus (T2DM) patients.
Methods and Results:
Based on HbA1c and LV ejection fraction, 78 patients with poorly controlled T2DM were randomly assigned to D-group (dapagliflozin 5 mg/day add-on) or C-group (conventional therapy add-on). Physical examination, home and office blood pressure examination, blood tests, and echocardiography at rest and during ergometer exercise were performed at baseline and at 1.5 and 6 months after treatment. The primary endpoint was defined as the change in RVSP (mmHg) between baseline and 6-month follow up. The secondary endpoints were changes in LVFP (ratio), stroke volume index (SVi; mL/m2), and cardiac index (CI; L/min/m2). Both RVSP and LVFP during exercise significantly decreased from baseline to 6 months after starting treatment in the D-group (P<0.001). No changes to either parameter was observed in the C-group. The SVi and CI did not improve in either group. Both home and office blood pressure significantly decreased in the D-group. Decreases in HbA1c were somewhat greater in the C-group.
Conclusions:
Dapagliflozin significantly improved RVSP and LVFP during exercise in patients with T2DM and cardiovascular risk, which may contribute to favorable effects on heart failure.
Type 2 diabetes mellitus (T2DM) increases the incidence of cardiovascular events (CVE) and is a major cause of heart failure (HF).1
Left ventricular (LV) diastolic dysfunction, a process that occurs independently of CVE in T2DM, is known to exacerbate HF.1,2
Three recent large-scale randomized control trials (RCTs) have reported that sodium-glucose cotransporter-2 inhibitor (SGLT2-i) reduces all-cause mortality, cardiovascular mortality, and rehospitalization for HF in T2DM patients during the 6 months.3–5
Previous studies failed to show that other anti-diabetic drugs reduced CVE.6
The mechanisms underlying the HF benefit from SGLT2-i are likely multifactorial effects involving rapid changes in body composition, systolic blood pressure (sBP) and heart rate (HR), including reduced cardiac preload and afterload, and improvement in LV diastolic function on echocardiography.3,7–12
HF is clinically characterized by dyspnea or shortness of breath that can be displayed at rest or with exertion. Exercise-induced pulmonary hypertension (EiPH; right ventricular systolic pressure [RVSP] ≥50 mmHg) and/or elevation of LV filling pressure (LVFP) during exercise are associated with adverse cardiac outcomes in chronic HF patients with preserved LV ejection fraction (LVEF).13
If SGLT2-i is shown to reduce cardiac workload and improve LV diastolic function, the benefits of SGLT2-i treatment may be greater during exercise than at rest.
The Impact of dapagliflozin on LV hemodynamics and EiPH evaluated by echocardiography in patients with type 2 diabetes (IDOL-EPOC) study is the first prospective open-label RCT to clarify whether the SGLT2-i, dapagliflozin, can improve LV systolic and diastolic function and suppress the elevation of LVFP and RVSP on echocardiography, both at rest and during exercise, in T2DM patients with cardiovascular risk.
Methods
Study Design and Participants
This trial was registered in the University Hospital Medical Information Network Clinical Trials Registry (UMIN000023834). The study design is shown in
Figure 1. From October 2016 to March 2018, T2DM candidates with hypertension (grade 1 or 2) and/or a history of ischemic heart disease (blood glucose characterized by hemoglobin A1c [HbA1c] levels of 7.0–9.0%) at 4 participating institutions in Japan were evaluated to determine their suitability for inclusion. All participants were taking 1–3 oral anti-diabetic drugs when starting the study (Supplementary Table 1). The major exclusion criteria were percutaneous coronary intervention and/or coronary artery bypass grafting at <1 year from the date of enrollment, HF (New York Heart Association classes; NYHA III–IV) defined as a history of hospitalization for HF, acute coronary syndrome, lethal ventricular arrhythmia, atrial fibrillation (AF), pacemaker implantation, significant valvular heart disease, stage 3 hypertension, RVSP ≥50 mmHg at rest, sleep apnea syndrome, chronic kidney disease (stage IIIb), stroke or other neuromuscular diseases, insulin or glucagon-like peptide-1 receptor agonist use, and any malignancy.

Echocardiography was performed using a Vivid E9 ultrasound system (GE Vigmed, Horten, Norway) at Showa University Hospital after obtaining informed consent from the study participants. Eligible participants were randomly assigned to either the dapagliflozin 5 mg/day add-on group (D-group) or the conventional therapy add-on group as the control (C-group; anti-diabetic drugs at normal doses, excluding SGLT2-i) to obtain similar glycemic levels using a computer-based dynamic allocation method with 2 allocation factors, namely, HbA1c (<8.0% or ≥8.0%) and LVEF (<45.0% or ≥45.0%). Patient enrollment was performed at the trial administration office (Soiken Inc., Osaka, Japan) via the Internet. The dose of SGLT2-i in the D-group or of the added anti-diabetic drugs was maintained from baseline to 1.5 months, and an increase in dose, if necessary, was permissible in both groups after 1.5 months. Parameters (1) to (4) below were evaluated at baseline and at 1.5 and 6 months after starting treatment, whereas parameter (5) was evaluated at baseline and at 6 months: (1) cardiac load and LV pump function at rest and during exercise; (2) office sBP (OsBP), home sBP (HsBP), and HR; (3) blood and urine parameters; (4) body composition, including fat percentage and skeletal muscle mass, evaluated by InnerScan V with reactance technology (Tanita Co., Ltd., Tokyo, Japan); and (5) cardiopulmonary exercise capacity, evaluated by cardiopulmonary exercise testing (CPX). None of the enrolled cases in both groups had their anti-hypertensive drugs changed during the study period (Supplementary Table 1). During the study period, adverse events (AEs) were recorded on the case report form as they arose and received it as soon as possible. The investigation was conducted in accordance with the principles of the Declaration of Helsinki. The institutional review board of Showa University approved this protocol (No. 2104), and all patients provided written informed consent.
BP and HR Measurements
Office sBP was measured in the supine position using VaSera VS-1500A (Fukuda Denshi, Tokyo, Japan) after 1–2 min of rest immediately before echocardiography was carried out. Cuffs were applied to the bilateral upper arms and ankles, with the patients lying supine and their head held in a midline position. Both HsBP and HR measurements were performed in accordance with the 2014 Japanese Society of Hypertension Guidelines for the Management of Hypertension.14
Morning sBP and HR (once within 1 h after waking, after urination, and before breakfast/ingestion of medication) and evening sBP and HR (once just before bed) were measured after 1–2 min of seated rest (average value of 14 consecutive leads) using a cuff oscillometric device (HEM 7510C; Omron Healthcare Co., Ltd., Kyoto, Japan).
CPX Procedures
CPX was performed using a ramp protocol. After a 3-min rest on the bicycle ergometer in the upright position, the patients started pedaling at an intensity of 10 W for 4 min, followed by an incremental exercise at 10 or 20 W/min until exhaustion. A 12-lead electrocardiogram was continuously monitored, and BP was measured once every minute with a sphygmomanometer. Respiratory flow was measured by using the breath-by-breath method using a gas analyzer (MINATO AE-300 s aeromonitor; MINATO Holdings, Inc., Tokyo, Japan). The anaerobic metabolic threshold (AT) was determined by using the V-slope method. Oxygen consumption at peak exercise was regarded as peak V̇O2
(mL/min/kg). All CPX studies were performed within 7 days before echocardiography.
Echocardiography
Following established guidelines, 4 experienced sonographers who were blinded to this study conducted standard echocardiographic measurements.15
The following formula was used to measure the stroke volume index (SVi; mL/m2): (LV outflow tract radius [cm])2×time velocity integral of LV outflow tract/body surface area (m2). The cardiac index (CI; L/min/m2) was measured using the following formula: SVi×HR. The E wave (cm/s) was measured from a pulsed Doppler image of mitral inflow from the apical long-axis view. The velocity of e’ (cm/s) was measured by averaging Doppler images of the lateral and septal mitral annulus tissue from the apical 4-chamber view. Although E/e’ reflects atrial pressure or LV end-diastolic pressure, an increase of estimated LVFP was defined as elevation of E/e’ in our study. RVSP was calculated from the tricuspid regurgitant velocity-derived pressure by adding the right atrial pressure of 5 mmHg from the optimal section involving the apical 4-chamber view. After standard rest images were obtained, multistage semi-lateral spine bicycle exercise testing was performed with a variable-load bicycle ergometer using Angio cpet EC (Load Co., Ltd., Netherlands). The patients pedaled at a constant speed (50 cycles/min), starting with a 10 W workload and increasing the workload by 10 W every 1 min. When the optimal exercise workload stage was detected by CPX (AT load) beforehand, exercise echocardiographic measurements were performed by using a procedure similar to that used for the resting images. Initially, EiPH was defined as RVSP ≥60 mmHg. Subsequently, EiPH was defined as RVSP ≥50 mmHg based on previous studies.
Endpoints and Sample Size
The primary outcome was the change in RVSP during exercise from baseline to 6 months after starting treatment. The secondary endpoints were changes in E/e’, SVi, CI, OsBP, morning and evening HsBP, home HR, and body composition parameters from baseline to 6 months after starting treatment. Our estimated RVSP during exercise was based on a baseline exercise RVSP of 55.0±12.6 mmHg. Compared to this baseline, the RVSP decreased by 11.0±16.0 mmHg in the D-group but was unchanged in the C-group. Based on an assumed significance level of 5% on both sides and a power of 80%, the number of cases required to detect a significant difference was estimated to be 35 cases/group. Assuming a dropout rate of 10%, the target number of enrolled patients was set to 39 cases/group, or a total of 78 cases for both groups.
Statistical Analyses
Although most of the statistical analyses were conducted on a full analysis set (FAS) under an intention-to-treat approach, the safety analyses for AE were performed on a safety analysis set. The FAS included all patients who were enrolled and randomized in this study, except for those from whom no data on the primary endpoint could be obtained, those from whom no informed consent could be obtained, those who registered outside the study period, and those who violated the study protocol. Unless otherwise noted, results were presented as mean±standard deviation or standard error for continuous variables, and as frequencies and proportions of patients for categorical variables.
For the primary endpoint, we analyzed the covariance with covariates of the allocation factors. As a sensitivity analysis for the primary endpoint, we also carried out a mixed effect model for repeated measures (MMRM) method with the treatment, time, interactions between the treatment and time, and allocation factors as fixed effects. For the other endpoints, we applied a Student’s t-test and Fisher’s exact test for between-group comparisons of continuous and categorical variables, respectively. The McNemar test was used to compare frequencies between baseline and 6 months within each group. Changes in continuous variables from baseline to each visit within a group were assessed using a 1-sample t-test. Logarithmic transformation was performed for data with skewed distribution before statistical analysis. To evaluate which clinical parameters affect the change in RVSP during exercise at 6 months, univariate and bivariate linear regression analysis corrected for taking dapagliflozin were performed. All statistical analyses were performed using SAS 9.4 (SAS Institute Inc., Cary, NC, USA) under 2-sided test conditions with a 5% significance level.
Results
Baseline Characteristics and Study Participants
Of 293 patients assessed to determine eligibility for enrollment in this study, 78 patients were randomly allocated into 2 groups: D-group (39 patients) and C-group (39 patients) (Figure 2). Three patients in the D-group and 1 patient in the C-group were excluded from the FAS because of a lack of data on the primary endpoint, leaving a FAS of 36 and 38 patients in the D-group and C-group, respectively (66 men, 8 women; mean age, 67.7±8.5 years). Five of 78 patients were enrolled at other institutions. However, all examination following the proper protocols were conducted at the Showa University hospital, and we confirmed that the quality of research was maintained.
Table 1
and
Table 2
summarize the patients’ clinical characteristics. Except for dyslipidemia, no significant differences between the groups were found. As for AE, 1 patient in the C-group had acute kidney injury caused by an allergic reaction (Cr ≥4.5 mg/dL), which was remedied within 7 days, and 1 patient in the D-group was hospitalized due to pneumonia; dapagliflozin was discontinued at 4 months during the study period.
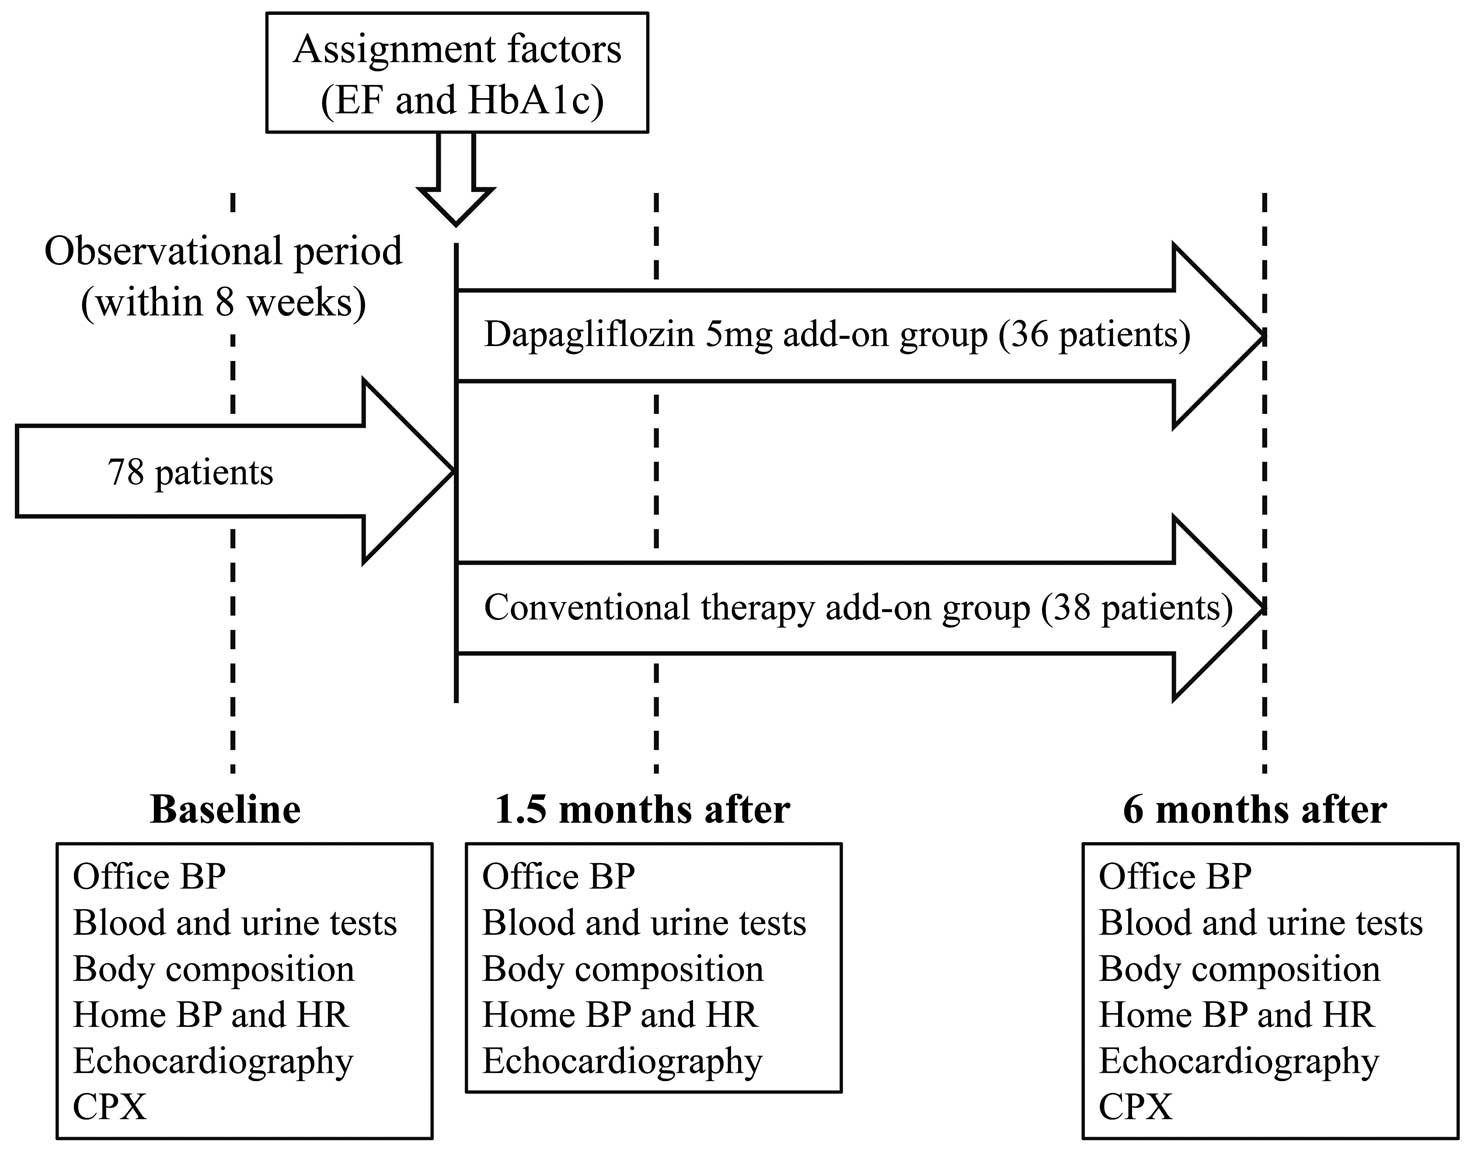
Table 1.
Clinical Characteristics of the Patients at Baseline and Add-On Anti-Diabetic Drugs at the 6-Month Follow up
| Parameters |
D-group
(n=36) |
C-group
(n=38) |
P value |
| Previous history of DM (years) |
8.9±5.3 |
8.1±4.7 |
0.57 |
| Age (years) |
69.4±7.1 |
66.0±9.5 |
0.09 |
| Female, n (%) |
5 (13.9) |
3 (7.9) |
0.47 |
| Height (m) |
1.67±0.08 |
1.65±0.10 |
0.49 |
| Body mass index (kg/m2) |
25.6±4.2 |
25.8±3.9 |
0.81 |
| Waist circumference (cm) |
94.7±10.2 |
92.4±9.3 |
0.32 |
| Fat percentage (%) |
26.6±6.0 |
25.7±7.3 |
0.57 |
| Skeletal muscle mass (kg) |
49.2±9.1 |
49.3±7.0 |
0.95 |
| Systolic blood pressure (mmHg) |
| Office |
146.4±23.1 |
142.3±21.2 |
0.42 |
| Home (morning) |
138.4±17.2 |
136.1±15.0 |
0.56 |
| Home (evening) |
131.7±14.9 |
131.8±15.5 |
0.98 |
| Heart rate (bpm) |
| Home (morning) |
69.2±9.9 |
71.3±10.4 |
0.78 |
| Home (evening) |
73.6±8.7 |
75.2±10.5 |
0.80 |
| Laboratory and urine data |
| Hematocrit (%) |
42.8±4.2 |
42.8±3.2 |
0.94 |
| Uric acid (mg/dL) |
5.5±1.3 |
5.3±1.2 |
0.56 |
| Serum creatinine (mg/dL) |
0.8±0.2 |
0.8±0.2 |
0.96 |
| Triglyceride (mg/dL) |
140.3±110.9 |
163.8±143.0 |
0.43 |
| HDL cholesterol (mg/dL) |
53.5±13.5 |
49.9±11.8 |
0.24 |
| LDL cholesterol (mg/dL) |
91.8±24.3 |
90.3±26.3 |
0.8 |
| NT-proBNP (pg/mL) |
125.3±116.9 |
127.9±228.7 |
0.95 |
| HbA1c (%) |
7.6±0.7 |
7.5±0.6 |
0.88 |
| U-Alb/Cr (mg/g·Cr) |
184.7±384.2 |
117.0±207.5 |
0.35 |
| Comorbidities |
| Hypertension, n (%) |
34 (94.4) |
33 (86.8) |
0.43 |
| Dyslipidemia, n (%) |
36 (100) |
31 (81.6) |
0.012 |
| Ischemic heart disease, n (%) |
26 (72.2) |
34 (63.2) |
0.46 |
| Chronic heart failure, n (%) |
13 (36.1) |
13 (34.2) |
0.86 |
| Anti-hypertensive drugs |
| CCB, n (%) |
16 (44.4) |
16 (42.1) |
0.84 |
| ACE and/or ARB, n (%) |
27 (75.0) |
24 (63.2) |
|
| β-blocker, n (%) |
2 (5.6) |
7 (18.4) |
0.09 |
| Diuretics, n (%) |
4 (11.1) |
5 (13.2) |
0.79 |
| Add-on anti-diabetic drugs |
| SGLT2-I (dapagliflozin), n (%) |
35 (97.2) |
0 (0) |
|
| Sulfonylureas or glinide, n (%) |
0 (0) |
5 (13.2) |
|
| DPP-4i, n (%) |
0 (0) |
7 (18.4) |
|
| Metformin, n (%) |
0 (0) |
16 (42.1) |
|
| Thiazolidine, n (%) |
0 (0) |
7 (18.4) |
|
| α-Glucosidase inhibitor, n (%) |
0 (0) |
2 (5.3) |
|
| Echocardiographic parameters |
| LVDd (mm) |
48.9±6.5 |
47.4±7.0 |
0.35 |
| LVDs (mm) |
31.9±8.1 |
30.2±8.6 |
0.37 |
| IVS (mm) |
8.2±1.7 |
8.5±1.4 |
0.48 |
| PWT (mm) |
9.0±1.3 |
8.5±1.4 |
1.00 |
| EF (%) |
56.5±8.7 |
55.6±9.6 |
0.69 |
| SVi (mL/m2) |
41.2±8.5 |
39.3±8.8 |
0.35 |
| CI (L/min/m2) |
2.7±0.6 |
2.7±0.7 |
0.81 |
| E/e’ (ratio) |
10.3±2.4 |
10.4±2.7 |
0.91 |
| RVSP (mmHg) |
24.7±6.8 |
24.4±4.9 |
0.86 |
Data are expressed as mean±SD or as n (%). A Student’s t-test and Fisher’s exact test were applied for continuous and categorical data, respectively. ACE/ARB, angiotensin-converting enzyme inhibitor/angiotensin II receptor blocker; CCB, calcium channel blocker; CI, cardiac index; DM, diabetes mellitus; DPP-4i, dipeptidyl peptidase-4 inhibitor; EF, ejection fraction; HbA1c, hemoglobin A1c; HDL, high-density lipoprotein; LDL, low-density lipoprotein; U-Alb/Cr, urine albumin/creatinine; LVDd, left ventricular diastolic dimension; LVDs, left ventricular systolic dimension; IVS, interventricular septum; NT-proBNP, pro-brain natriuretic peptide; PWT, posterior LV wall thickness; RVSP, right ventricular systolic pressure; SVi, stroke volume index.
Table 2.
Comparison of Changes in Body Composition and Laboratory Findings From Baseline to 6 Months Between the D- and C-Groups
| Parameters |
D-group |
C-group |
P value |
| Body mass index (kg/m2) |
| At baseline |
25.6±4.2 |
25.8±3.9 |
0.81 |
| At 6 months |
24.6±4.0 |
25.7±3.8 |
0.24 |
| Change |
−1.0±0.8*** |
0.0±0.9 |
<0.001 |
| Waist circumference (cm) |
| At baseline |
94.7±10.2 |
92.4±9.3 |
0.32 |
| At 6 months |
92.2±10.7 |
92.9±9.0 |
0.78 |
| Change |
−2.6±3.1*** |
0.7±3.3 |
<0.001 |
| Fat percentage (%) |
| At baseline |
26.6±6.0 |
25.7±7.3 |
0.57 |
| At 6 months |
24.7±6.2 |
25.3±7.8 |
0.74 |
| Change |
−1.9±2.5*** |
−0.2±3.9 |
0.031 |
| Skeletal muscle mass (kg) |
| At baseline |
49.2±9.1 |
49.3±7.0 |
0.95 |
| At 6 months |
49.0±10.4 |
49.6±7.2 |
0.78 |
| Change |
−0.3±3.8 |
0.2±2.4 |
0.45 |
| Hematocrit (%) |
| At baseline |
42.8±4.2 |
42.8±3.2 |
0.94 |
| At 6 months |
44.6±4.8 |
42.3±3.3 |
0.024 |
| Change |
1.8±2.0*** |
−0.5±1.9 |
<0.001 |
| Uric acid (mg/dL) |
| At baseline |
5.5±1.3 |
5.3±1.2 |
0.56 |
| At 6 months |
5.0±1.3 |
5.8±1.2 |
0.006 |
| Change |
−0.6±0.8*** |
0.4±0.7*** |
<0.001 |
| Serum creatinine (mg/dL) |
| At baseline |
0.8±0.2 |
0.8±0.2 |
0.96 |
| At 6 months |
0.8±0.2 |
0.8±0.2 |
0.59 |
| Change |
0.0±0.1 |
0.0±0.1 |
0.92 |
| Log-transformed triglyceride (ln (mg/dL)) |
| At baseline |
4.73±0.61 |
4.87±0.65 |
0.35 |
| At 6 months |
4.71±0.57 |
4.82±0.58 |
0.42 |
| Change |
−0.02±0.46 |
−0.03±0.50 |
0.93 |
| HDL cholesterol (mg/dL) |
| At baseline |
53.5±13.5 |
49.9±11.8 |
0.24 |
| At 6 months |
57.1±12.9 |
50.7±12.9 |
0.044 |
| Change |
2.7±5.2** |
0.5±7.1 |
0.14 |
| LDL cholesterol (mg/dL) |
| At baseline |
91.8±24.3 |
90.3±26.3 |
0.80 |
| At 6 months |
87.8±24.4 |
84.8±25.1 |
0.63 |
| Change |
−3.4±15.6 |
−3.2±15.7 |
0.95 |
| Log-transformed NT-proBNP (ln (pg/mL)) |
| At baseline |
4.44±0.90 |
4.03±1.31 |
0.12 |
| At 6 months |
4.47±0.98 |
4.12±1.15 |
0.16 |
| Change |
0.05±0.48 |
0.17±0.64 |
0.39 |
| HbA1c (%) |
| At baseline |
7.6±0.7 |
7.5±0.6 |
0.88 |
| At 6 months |
7.1±0.7 |
6.8±0.5 |
0.037 |
| Change |
−0.5±0.7*** |
−0.8±0.6*** |
0.045 |
| Log-transformed U-Alb/Cr (ln (mg/g·Cr)) |
| At baseline |
3.71±1.65 |
3.60±1.62 |
0.77 |
| At 6 months |
3.22±1.70 |
3.31±1.68 |
0.81 |
| Change |
−0.51±0.70*** |
−0.24±0.75 |
0.11 |
Data are expressed as mean±SD or as n (%). A Student’s t-test and Fisher’s exact test were applied for continuous and categorical data, respectively. Statistical significance of changes within a group was assessed using a 1-sample t-test and is denoted by asterisks, as follows: P value: *<0.05, **<0.01, ***<0.001. U-Alb/Cr, urine albumin/creatinine. Other abbreviations as in Table 1.
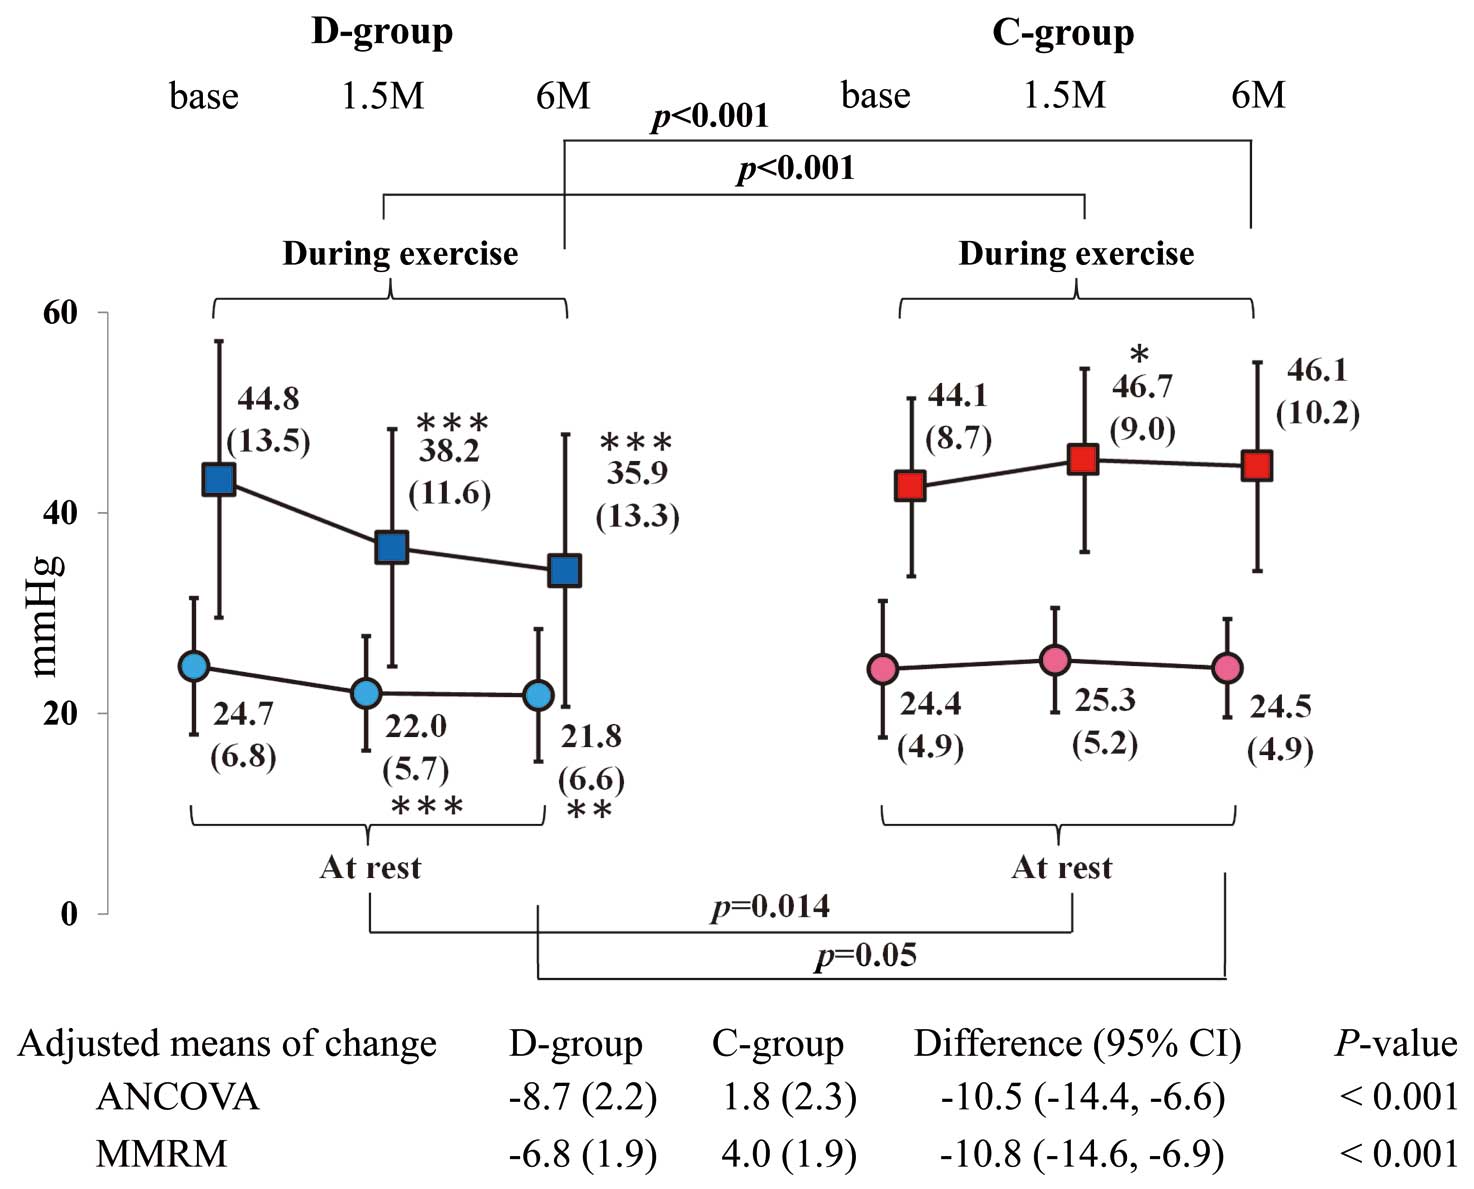
The adjusted means of the primary endpoint (change in RVSP during exercise at 6 months) were significantly decreased in the D-group alone. Similar to the adjusted means, the MMRM results were significantly different between the groups (Figure 3).
When EiPH was defined as RVSP ≥60 mmHg, no significant difference in the frequency of EiPH was observed between the groups at baseline (P=0.19) or at 6 months (P=0.62). When EiPH was defined as RVSP ≥50 mmHg, 11 (30.6%) and 4 (11.8%) patients in the D-group and 12 (31.6%) and 15 (40.5%) patients in the C-group had EiPH at baseline and at 6 months. The frequency of EiPH significantly differed between the groups at 6 months (P=0.008), but not at baseline (P=1.00). With respect to comparisons between baseline and 6 months within each group, a significant difference was only found in the D-group (P=0.031).
Echocardiographic and Hemodynamic Parameters on Stress Echocardiography
Figure 4
presents a comparison of changes in SVi, CI and E/e’ values in the 2 groups. Both SVi and CI at rest and during exercise did not change in both groups. The E/e’ significantly decreased from baseline to 6 months at rest and during exercise in the D-group alone. Conversely, the E/e’ showed a significant increase from baseline to 1.5 and 6 months during exercise in the C-group. The E/e’ values at 1.5 and 6 months in the D-group were significantly lower than those of the C-group during exercise. The E/e’ value at 6 months was not different between the 2 groups at rest; however, change of the E/e’ from baseline to 6 months in the D-group (−1.5±1.9) was significantly greater than that in the C-group (0.9±1.6) (P<0.001).
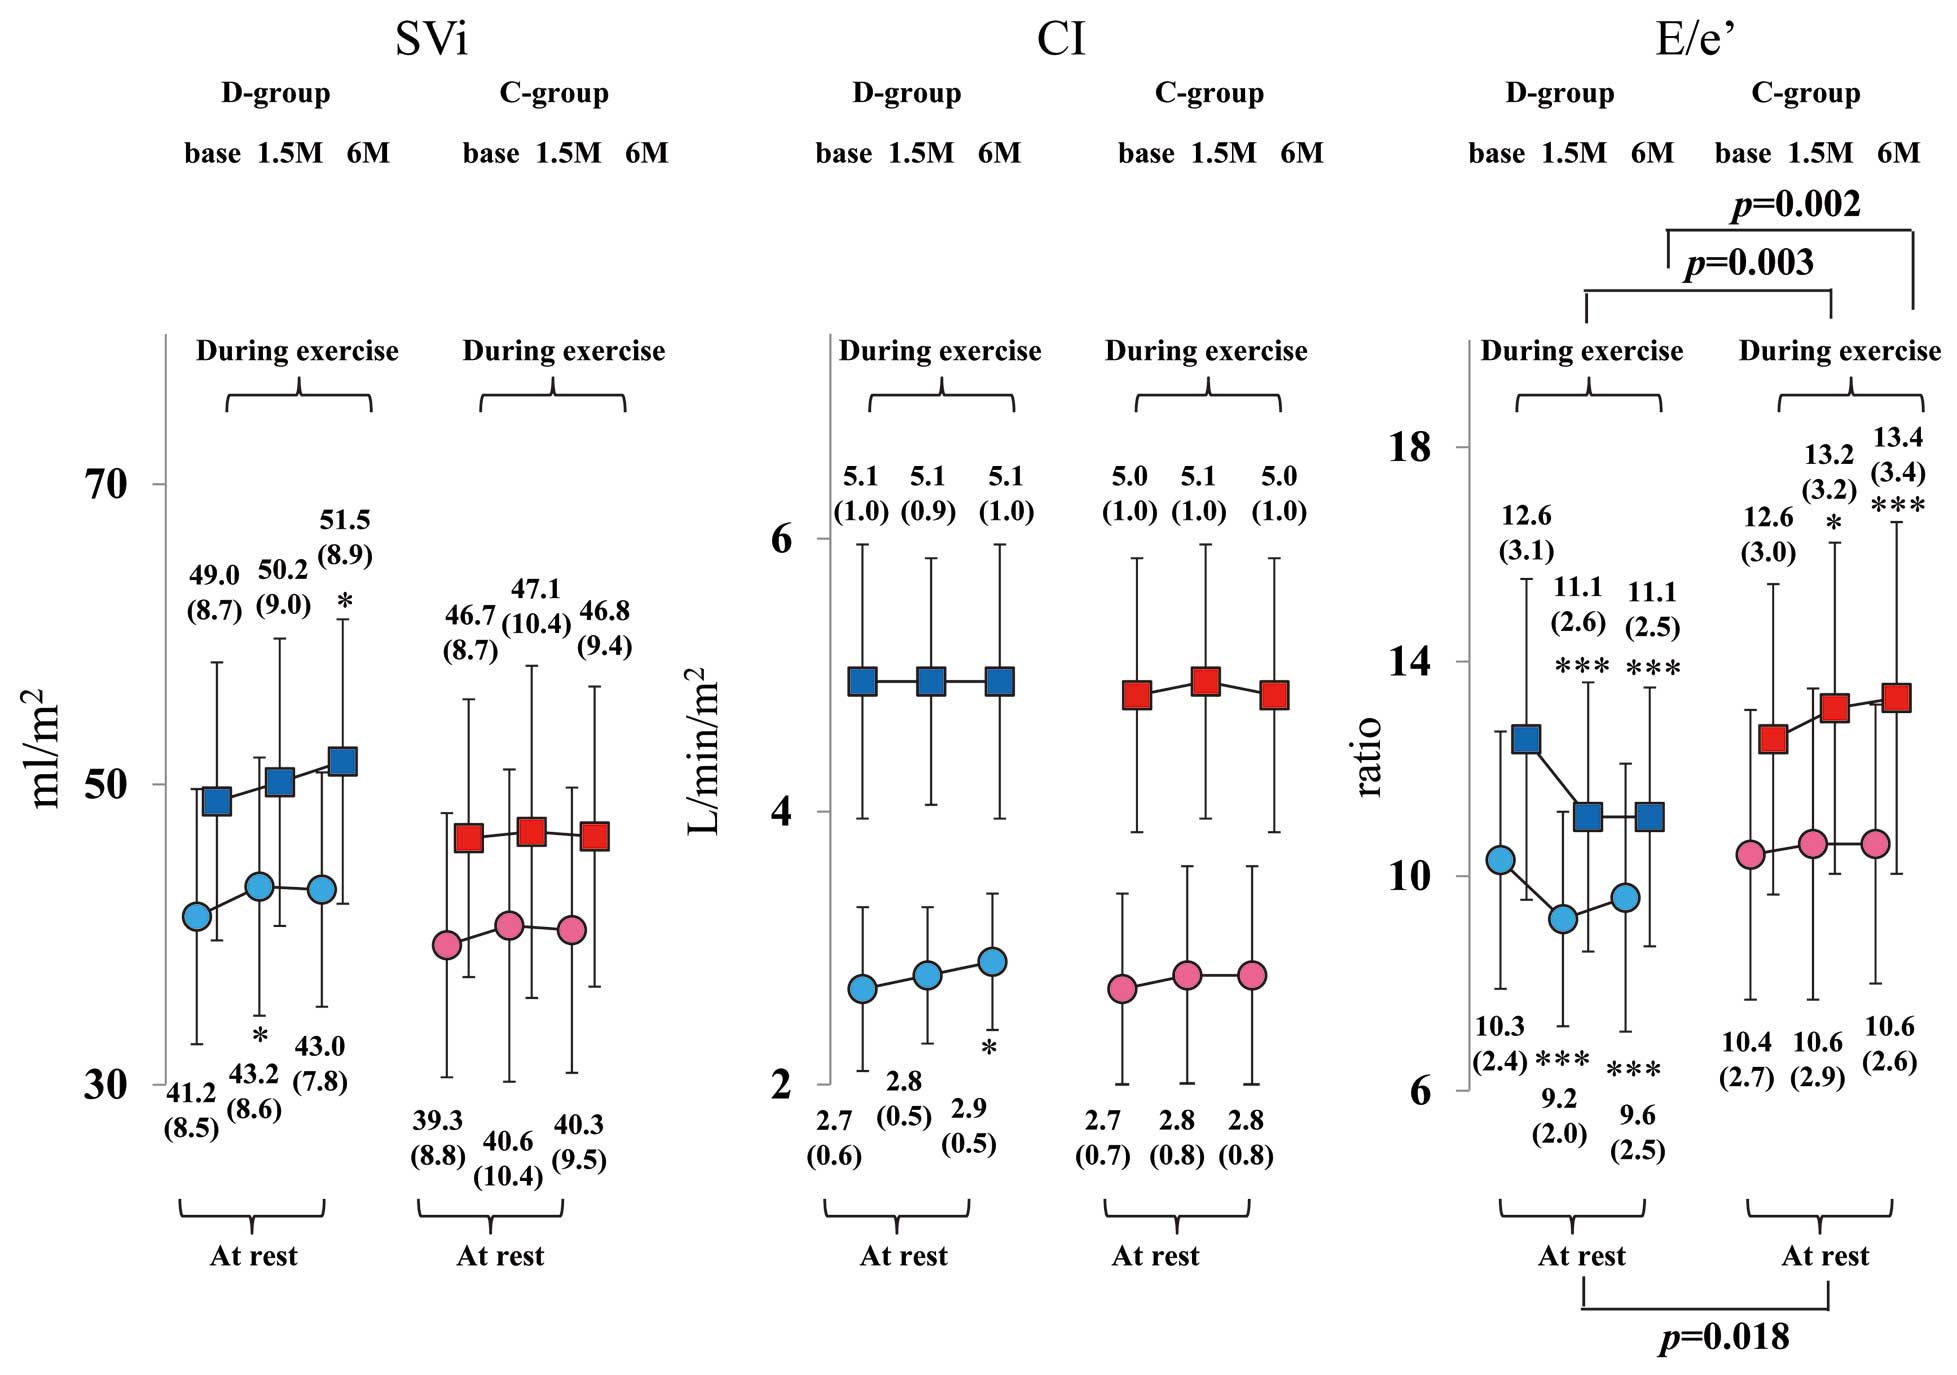
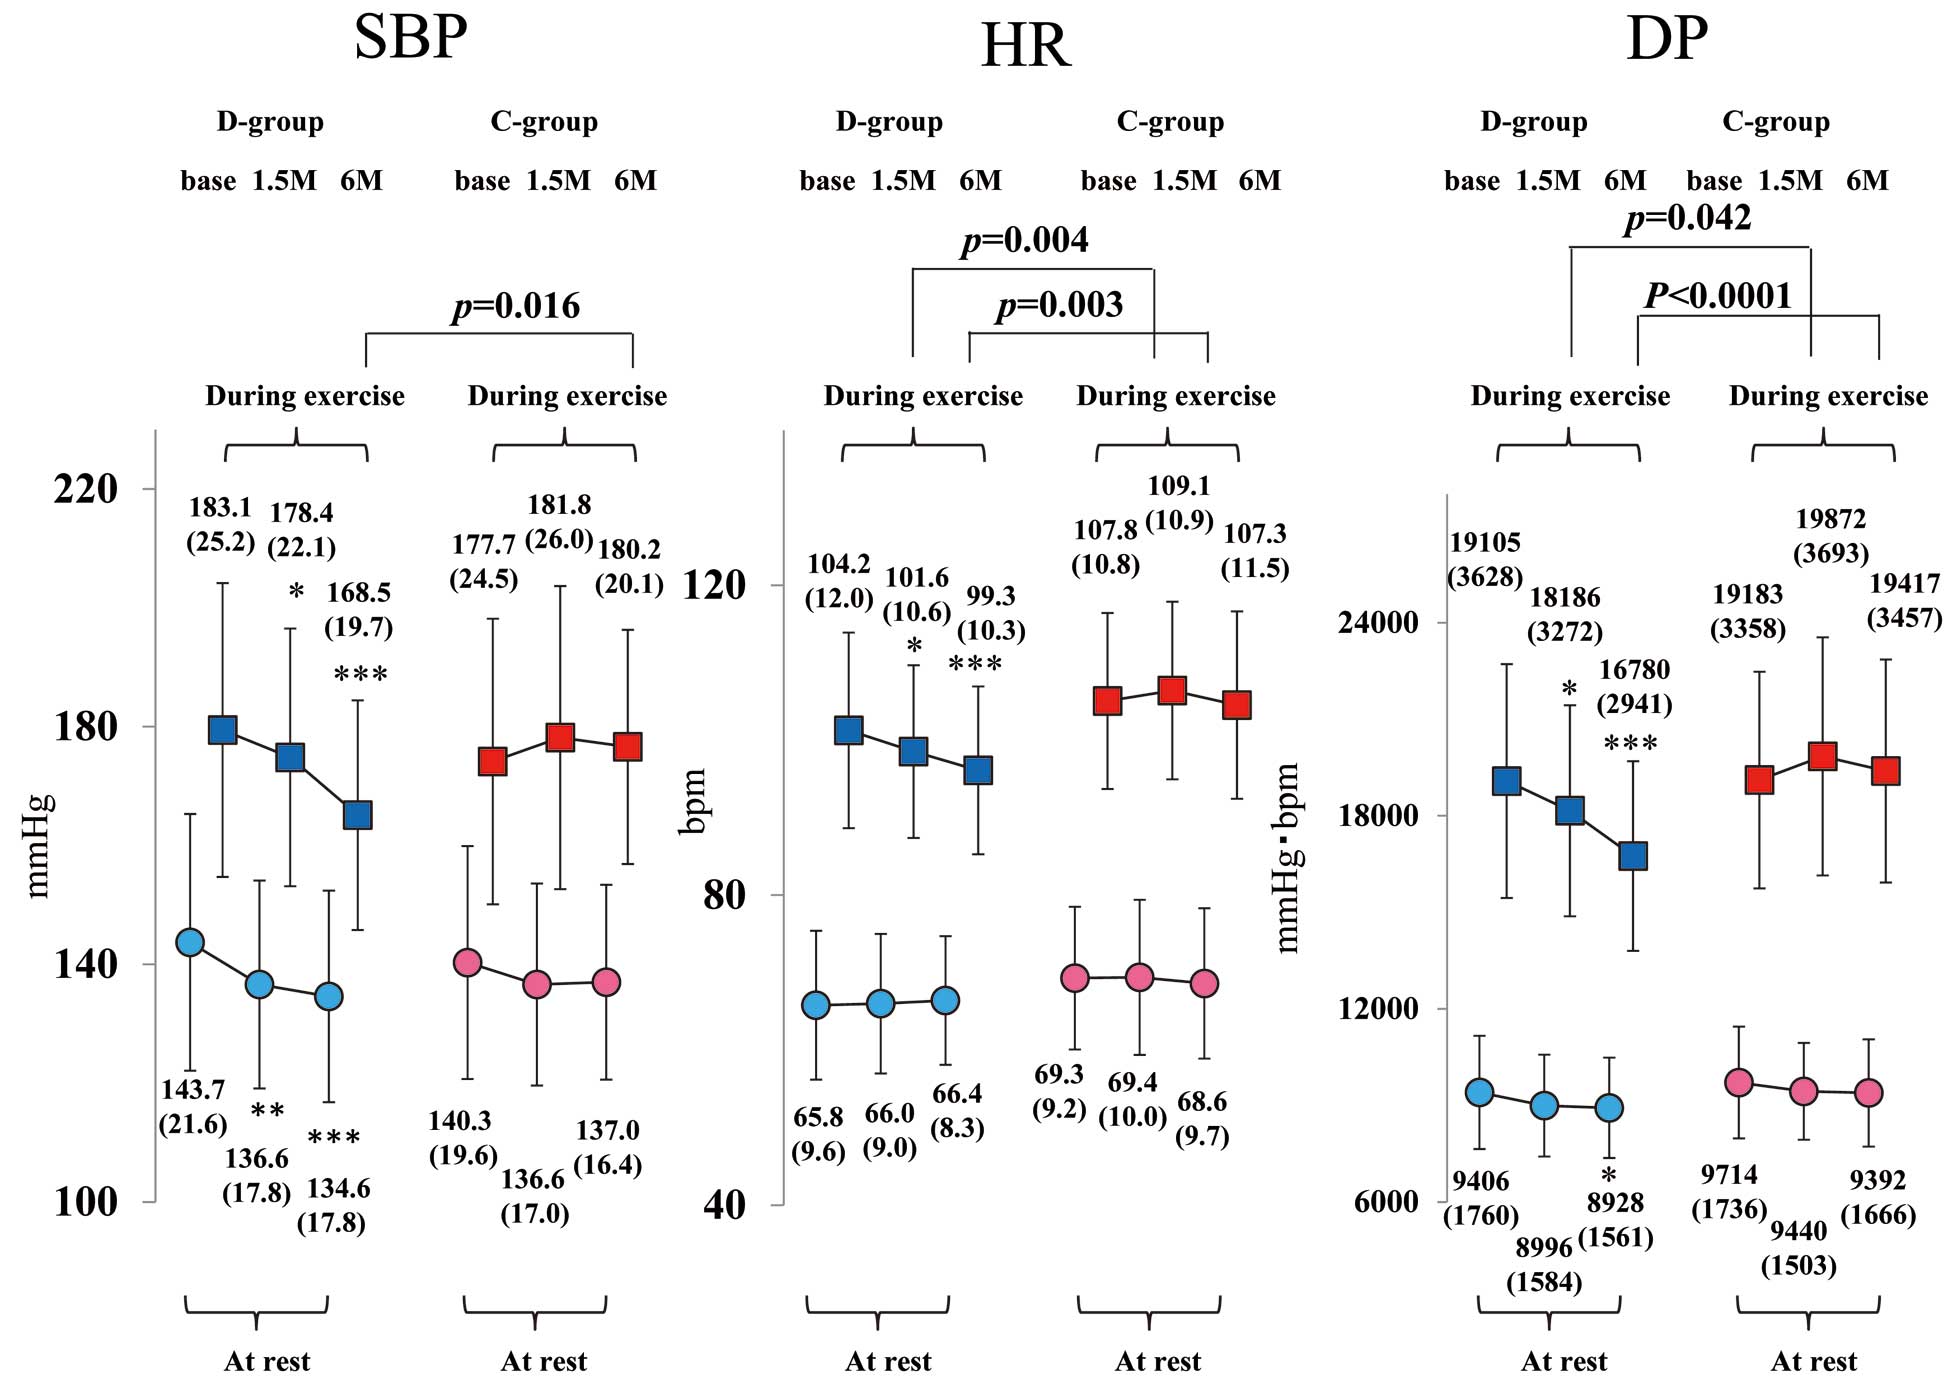
Figure 5
compares the sBP, HR, and double product (DP) measured with stress echocardiography from baseline to 6 months at rest and during exercise in the 2 groups. The optimal exercise intensity (AT load) did not differ between the 2 groups. The sBP and DP at rest and AT, as well as the HR at AT, significantly decreased from baseline to 6 months in the D-group alone, whereas these did not change in the C-group. Moreover, the sBP, HR, and DP of the counterparts were all significantly lower in the D-group than in the C-group at 6 months after starting treatment. However, there was no significant difference in peak V̇O2
(mL/min/kg) at both baseline and 6 months between the D-group (18.2±3.2, 18.6±4.0) and C-group (18.2±3.8, 18.1±3.3).
Hemodynamic Parameters
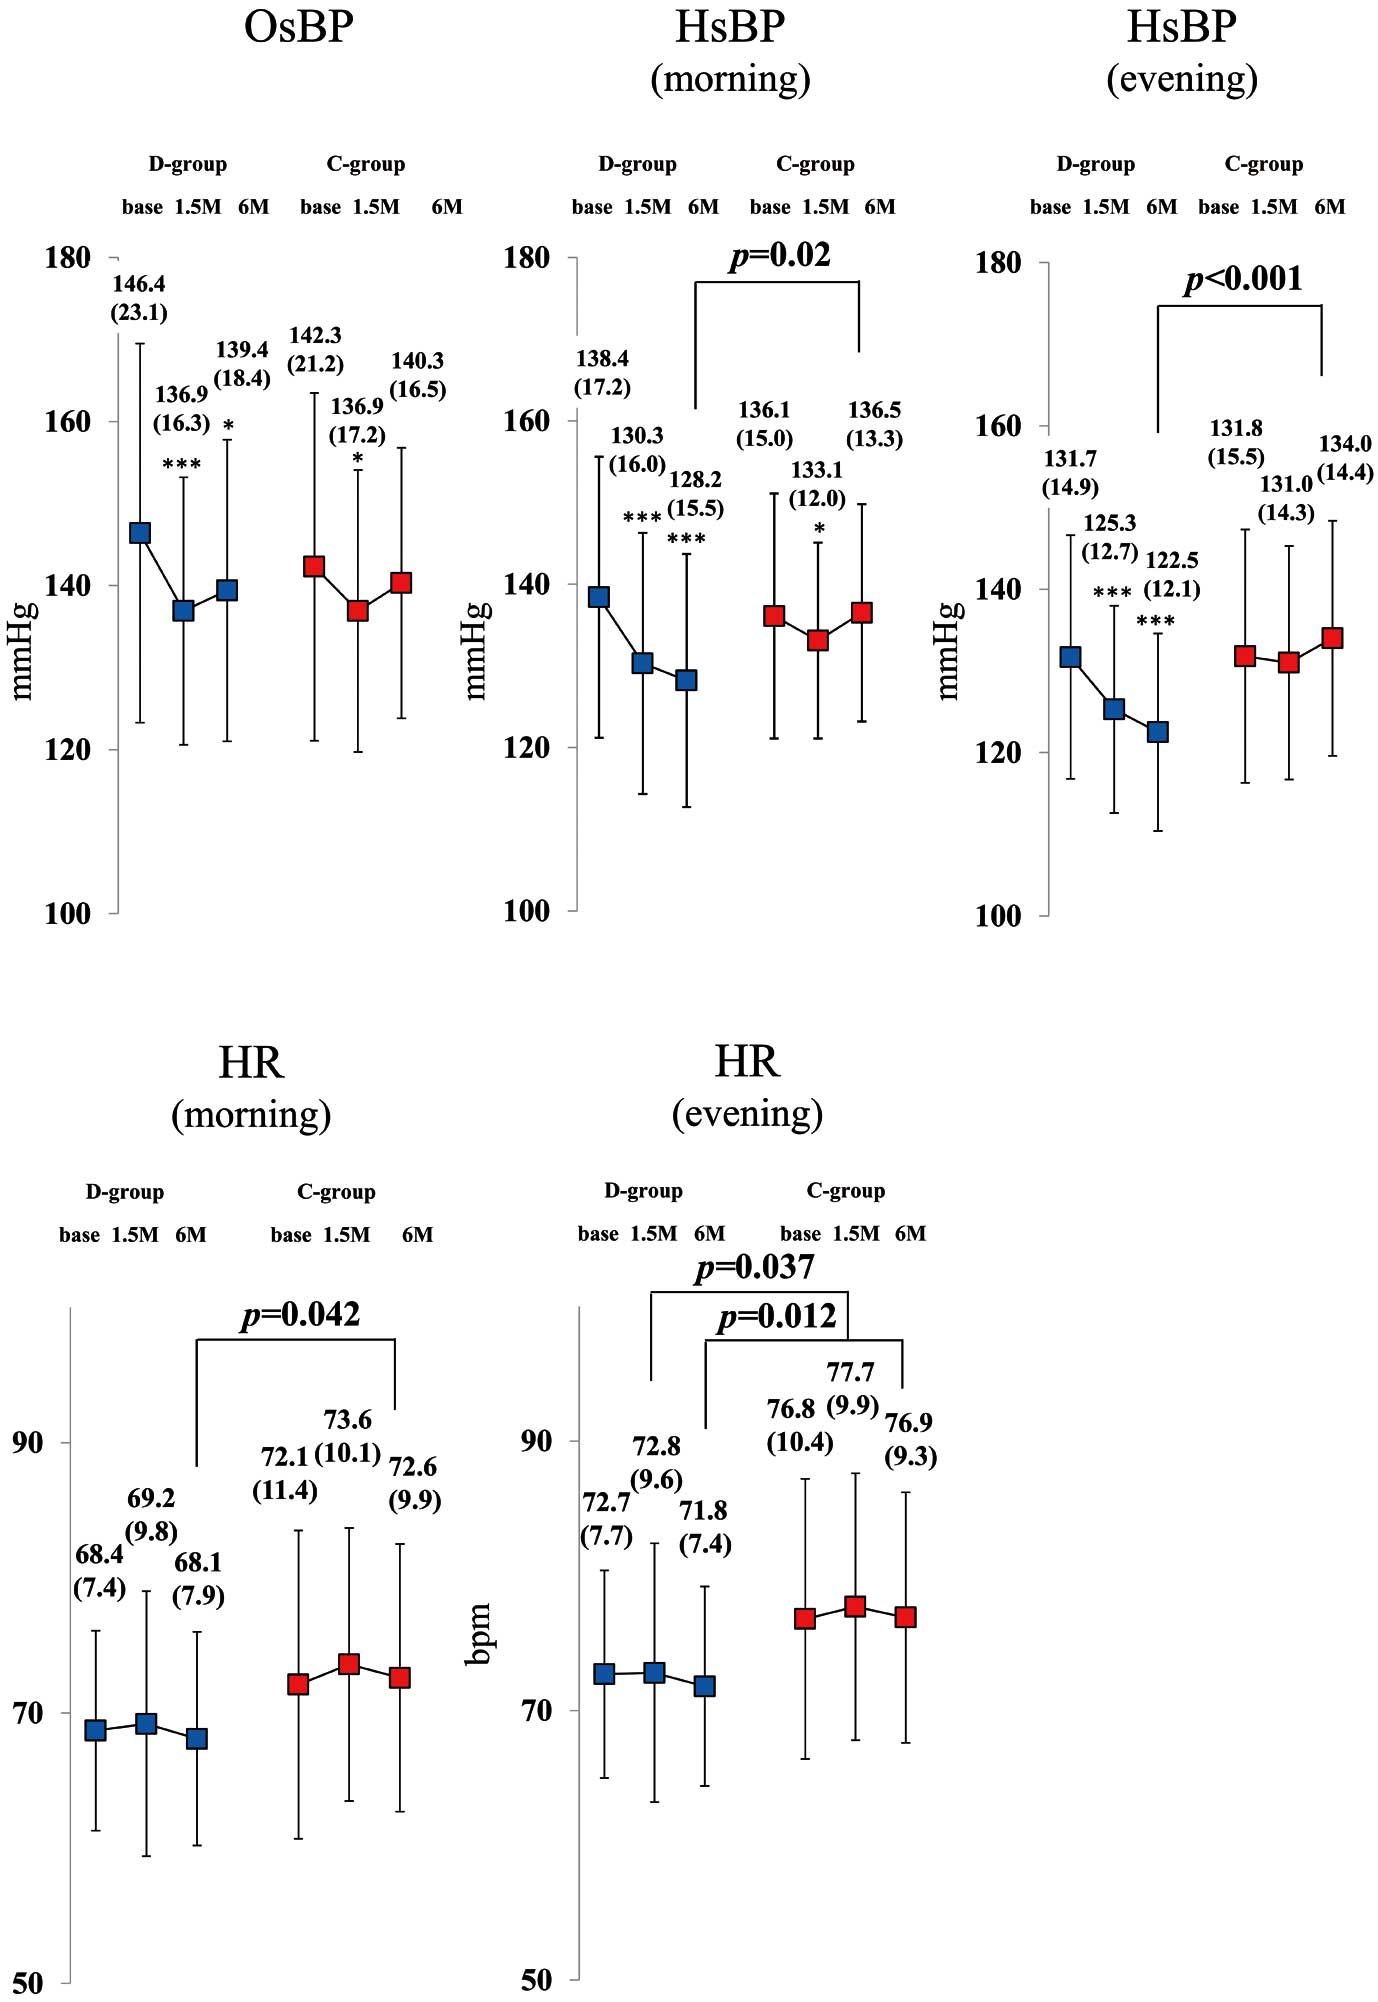
The OsBP significantly decreased from baseline to 6 months in the D-group alone. Furthermore, both morning and evening HsBP significantly decreased from baseline to 6 months in the D-group alone, and those values from the D-group were significantly lower than that of C-group patients. Both home morning and evening HR at 6 months were significantly lower in the D-group (Figure 6).
Body Composition and Blood Parameters
Reductions in body mass index, waist circumference, fat percentage, and uric acid were significantly larger in the D-group than in the C-group. Increases in hematocrit were significant only in the D-group, whereas the improvement in glycemic control was greater in the C-group than in the D-group. No differences in the skeletal muscle mass, renal function, lipid profile, and N-terminal pro-brain natriuretic peptide (NT-proBNP) level were noted between the groups (Table 2).
Correlation Between Changes in RVSP During Exercise at 6 Months and Changes of Clinical Variables at 6 Months Supplementary Table 2
shows the association between changes of clinical factors from baseline to 6 months, with changes to RVSP during exercise at 6 months. According to univariate regression analysis, taking dapagliflozin and changes to hematocrit levels are inversely associated, and when there is an addition of Metformin, changes of body mass index, waist circumference, E/e’ at rest, E/e’ during exercise, and DP during exercise are positively associated with changes in RVPS during exercise. After adjusting for dapagliflozin treatment, changes to the E/e’ during exercise alone are significantly associated with changes to the RVSP during exercise.
Discussion
This RCT is the first to show that dapagliflozin decreased LVFP and RVSP during exercise and reduced the prevalence of EiPH, defined as RVSP ≥50 mmHg, at 6 months after starting treatment in T2DM patients.
Cardiac Pump Function, LVFP, RVSP, and Improvement in EiPH
The absence of any overt changes in SVi and CI in response to SGLT2-i treatment can lead to the conclusion that SGLT2-i exerts no influence on cardiac pump function. The E/e’, a measure of diastolic function, significantly decreased as early as 1.5 months at rest in the D-group alone, which is in good agreement with the findings of previous studies.11,12
Additionally, the study results indicated for the first time that both E/e’ and RVSP during exercise improved as early as 1.5 months after treatment and that the diastolic function and cardiac load condition were better maintained up to 6 months in the D-group. Linear regression analysis showed a significant association between changes in the E/e’ during exercise at 6 months and changes in the RVSP during exercise at 6 months after adjustment for dapagliflozin treatment. The prognostic effect of EiPH in patients who have not developed HF is not fully understood. Lim et al reported that EiPH, defined as pulmonary artery systolic pressure (PASP) ≥50 mmHg during exercise, was documented in one-third of 1,383 patients with unexplained exertional dyspnea or chest discomfort and preserved LVEF.16
Hamatani et al reported that EiPH, defined as PASP ≥60 mmHg during exercise, was a significant predictor of hypertrophic cardiomyopathy (HCM)-related morbidity in patients with HCM.17
Worsening of EiPH and elevated E/e’ during exercise are associated with adverse cardiac outcomes in chronic HF patients.13,18
Although no study has clearly shown that reduced E/e’ during exercise is associated with a better outcome in HF patients, we propose that dapagliflozin may directly improve LV diastolic function and restrict LVFP and RVSP elevation, especially during exercise, thus helping diminish the DP under the same exercise workload, possibly resulting in strong protective effects against HF, even in stage A of HF in the short term.
The reduction in HbA1c was somewhat greater in the C-group than in the D-group. A recent sub-analysis of the EMPA-REG OUTCOME trial revealed that the beneficial reduction in HF hospitalization and cardiovascular death was consistent, irrespective of HbA1c before and during therapy.19
These findings may support the results of this study, whereby the cardioprotective effects of dapagliflozin against exercise are independent of glucose-lowering effects.
Hemodynamic Parameters at Rest and During Exercise
The BP-lowering effects of SGLT2-i have been established previously.20
OsBP, both morning and evening HsBP, and sBP before exercise significantly decreased at 6 months from the baseline levels in the D-group alone. Accumulated evidence shows that HsBP can more effectively predict hypertensive organ damage and a prognosis of cardiovascular disease than OsBP, and is superior to ambulatory BP monitoring with higher practicality and reproducibility.21
Equally greater reduction in both morning and evening HsBP compared with reduction in OsBP was observed in the present study. A previous study comparing canagliflozin, another SGLT2-i, with other intensified antihyperglycemic therapies for home BP management in T2DM patients showed that an 8-week canagliflozin treatment marginally reduced nocturnal sBP during sleep and significantly reduced both morning and evening HsBP.22
In that study, both morning and evening HR at home remained unaffected during the 8 weeks.22
These findings are in good agreement with the results of this study. Furthermore, they showed greater reduction in NT-proBNP levels at 8 weeks in patients treated with canagliflozin.22
Nevertheless, the NT-proBNP level in this study did not change in the 2 groups at baseline and at 6 months. As a reason, we thought that the median NT-proBNP value in the present population was markedly lower than that in HF patients.
Elevations of sBP, HR, and DP during exercise in the D-group were gradually attenuated over the period from baseline to 6 months after starting treatment, improving greatly by the end of the study. No such changes were recognized in the C-group. DP is generally accepted as a marker of cardiac workload (myocardial oxygen consumption). Overwork is a common precipitating factor in patients with repetitive exacerbation of chronic left HF.23
Peak V̇O2
between the groups was not difference, the lifestyle modification such as encouragement of daily physical activity is equal among all participants, thus exercise tolerance did not change during the study periods in both groups. SGLT2-i itself may not increase exercise tolerance; however, dapagliflozin may decrease the cardiac workload under the same exercise intensity and thereby help to lower the risk of HF in daily life.
The mechanisms underlying the cardiovascular protection offered by SGLT2-i in T2DM patients are complex, multifactorial, and not completely understood.24
The reduction in HsBP caused by dapagliflozin may result from the decrease in preload and afterload achieved via lower circulating volume, thereby lowering the risk of HF.25
Seo et al reported that SGLT2-i treatment preserved cardiac output, despite the decreased right atrial pressure, which supported the safe use of SGLT2-i in diabetic patients with drug-refractory HF (NYHA: I–IV). They described that the mechanism underlying the HF benefit from SGLT2-i is plasma volume reduction, which leads to reduction in LV volume, mitral regurgitant volume and tricuspid regurgitant pressure gradient.26
As mentioned above, SGLT2-i therapy may reduce the cardiac workload during even a simple walk in HF patients with low EF. In addition, SGLT2-i may reduce sympathetic nervous system (SNS) overactivity.27,28
Pleiotropic mechanisms of SGLT2-i may contribute to favorable effects against HF. These effects during exercise may contribute to the primary and secondary prevention of HF.
Body Composition
SGLT2-i reduces body weight and fat percentage, and inconsistent results for the lean mass and skeletal muscle mass have been reported.29,30
The patients in our D-group maintained their skeletal muscle mass over the 6-month treatment period. Although the energy loss associated with SGLT2-i therapy can potentially lead to a reduction in skeletal muscle mass, we believe that this does not generally occur in physically active patients.
Study Limitations
Although the study aim was to clarify the mechanism underlying the HF benefit from dapagliflozin therapy, chronic HF patients represented nearly 35%, and patients who could perform exercises were investigated. Although AF is a common comorbidity in HF, we excluded AF by reason of difficulty to estimate cardiac parameters precisely because of variable HRs. Dipeptidyl peptidase-4 inhibitors or thiazolidinediones are associated with HF exacerbation; therefore, these drugs might have influenced the study results. Only 5 mg dapagliflozin was used and not 10 mg as per the DECLARE-TIMI 585
and DAPA HF studies.31
The right atrial pressure was set at 5 mmHg according to previous studies, and it may be significantly increased under high workload, particularly in HF patients.32
This may cause underestimation of exercise RVSP. Further large-scale trials evaluating the favorable effects of dapagliflozin under exercise conditions in chronic HF patients, including a heterogeneous population, may be required.
Conclusions
The present study results obtained from exercise stress echocardiography demonstrated that dapagliflozin improved LV diastolic function and decreased the cardiac workload during exercise in T2DM patients with cardiovascular risk. The mechanisms underlying these effects may help prevent HF exacerbation in necessary daily life load reduction during short-term periods of <6 months in patients.
Acknowledgments
The authors wish to thank the sonographers (M.J., Y.K., H.K., K.I.) of the Ultrasound Center, all cardiologists at the Department of Cardiology of Showa University Hospital, and two staff members (H.T., C.F.) from Soiken Inc. for their valuable help.
Data Availability
Immediately following publication, the de-identified participant all-calculated data that support the findings of this study will be shared upon request. These are not end data. In addition, the data can be applicable to any type of analyses, and they will be shared using methods such as Excel or CSV files via E-mail. Please contact the corresponding author directly to request data sharing.
Disclosures
H.K. has received a grant from AstraZeneca PLC and Ono Pharmaceutical Co., Ltd. S.K. has received honoraria for lecturing from Takeda Pharmaceutical Co., Ltd. and MSD Co., Ltd. T. Hirano has received a grant from AstraZeneca PLC, Ono Pharmaceutical Co., Ltd., Daiichi Sankyo Co., Ltd., Takeda Pharmaceutical Co., Ltd., Kowa Pharmaceutical Co., Ltd., Novo Nordisk Pharma Ltd., Eli Lilly and Company, and Taisho Pharmaceutical Co., Ltd. T. Hayashi has also received honoraria for lecturing from AstraZeneca PLC, Ono Pharmaceutical Co., Ltd., Daiichi Sankyo Co., Ltd., Takeda Pharmaceutical Co., Ltd., Kowa Pharmaceutical Co., Ltd., Novo Nordisk Pharma Ltd., and Eli Lilly and Company. Y.H. has received honoraria for lecturing from Abbott Vascular Japan Co., Ltd., Boston Scientific Japan Co., Ltd., and Medtronic Japan Co., Ltd. and has also received a manuscript fee from Nipro Corporation. T.S. has received a grant from Daiichi Sankyo Co., Ltd. and honoraria for lecturing from Daiichi Sankyo Co., Ltd., Bristol-Myers Squibb, and Bayer AG.
Funding
This study was financially supported by AstraZeneca PLC and Ono Pharmaceutical Co., Ltd.
Supplementary Files
Please find supplementary file(s);
http://dx.doi.org/10.1253/circj.CJ-20-0341
References
- 1.
Vazquez-Benitez G, Desai JR, Xu S, Goodrich GK, Schroeder EB, Nichols GA, et al. Preventable major cardiovascular events associated with uncontrolled glucose, blood pressure, and lipids and active smoking in adults with diabetes with and without cardiovascular disease: A contemporary analysis. Diabetes Care 2015; 38: 905–912.
- 2.
Paulus WJ, Tschöpe C, Sanderson JE, Rusconi C, Flachskampf FA, Rademakers FE, et al. How to diagnose diastolic heart failure: A consensus statement on the diagnosis of heart failure with normal left ventricular ejection fraction by the Heart Failure and Echocardiography Associations of the European Society of Cardiology. Eur Heart J 2007; 28: 2539–2550.
- 3.
Zinman B, Wanner C, Lachin JM, Fitchett D, Bluhmki E, Hantel S, et al. Empagliflozin, cardiovascular outcomes, and mortality in type 2 diabetes. N Engl J Med 2015; 373: 2117–2128.
- 4.
Mahaffey KW, Neal B, Perkovic V, de Zeeuw D, Fulcher G, Erondu N, et al. Canagliflozin for primary and secondary prevention of cardiovascular events: Results from the CANVAS Program (Canagliflozin Cardiovascular Assessment Study). Circulation 2018; 137: 323–334.
- 5.
Wiviott SD, Raz I, Bonaca MP, Mosenzon O, Kato ET, Cahn A, et al. Dapagliflozin and cardiovascular outcomes in type 2 diabetes. N Engl J Med 2018; 373: 2117–2128.
- 6.
White WB, Cannon CP, Heller SR, Nissen SE, Berqenstal RM, Bakris GL, et al. Alogliptin after acute coronary syndrome in patients with type 2 diabetes. N Engl J Med 2013; 369: 1327–1335.
- 7.
Neeland IJ, McGuire DK, Chilton R, Crowe S, Lund SS, Woerle HJ, et al. Empagliflozin reduces body weight and indices of adipose distribution in patients with type 2 diabetes mellitus. Diab Vasc Dis Res 2016; 13: 119–126.
- 8.
Chilton R, Tikkanen I, Cannon CP, Crowe S, Woerle HJ, Broedl UC, et al. Effects of empagliflozin on blood pressure and markers of arterial stiffness and vascular resistance in patients with type 2 diabetes. Diabetes Obes Metab 2015; 17: 1180–1193.
- 9.
Pham SV, Chilton RJ. EMPA-REG OUTCOME: The cardiologist’s point of view. Am J Cardiol 2017; 120: S53–S58.
- 10.
Lambers Heerspink HJ, de Zeeuw D, Wie L, Leslie B, List J. Dapagliflozin a glucose-regulating drug with diuretic properties in subjects with type 2 diabetes. Diabetes Obes Metab 2013; 15: 853–862.
- 11.
Soga F, Tanaka H, Tatsumi K, Mochizuki Y, Sano H, Toki H, et al. Impact of dapagliflozin on left ventricular diastolic function of patients with type 2 diabetic mellitus with chronic heart failure. Cardiovasc Diabetol 2018; 17: 132.
- 12.
Matsutani D, Sakamoto M, Kayama Y, Takeda N, Horiuchi R, Utsunomiya K. Effect of canagliflozin on left ventricular diastolic function in patients with type 2 diabetes. Cardiovasc Diabetol 2018; 17: 73.
- 13.
Shim CY, Kim SA, Choi D, Yang WI, Kim JM, Moon SH, et al. Clinical outcomes of exercise-induced pulmonary hypertension in subjects with preserved left ventricular ejection fraction: Implication of an increase in left ventricular filling pressure during exercise. Heart 2011; 97: 1417–1424.
- 14.
Shimamoto K, Ando K, Fujita T, Hasebe N, Higaki J, Horiuchi M, et al. The Japanese Society of Hypertension Guidelines for the Management of Hypertension (JSH 2014). Hypertens Res 2014; 37: 253–390.
- 15.
Lang RM, Badano LP, Mor-Avi V, Afilalo J, Armstrong A, Ernande L, et al. Recommendations for cardiac chamber quantification by echocardiography in adults: An update from the American Society of Echocardiography and the European Association of Cardiovascular Imaging. J Am Soc Echocardiogr 2015; 28: 1–39.e14.
- 16.
Lim AY, Kim C, Park SJ, Choi JO, Lee SC, Park SW. Clinical characteristics and determinants of exercise-induced pulmonary hypertension in patients with preserved left ventricular ejection fraction. Eur Heart J Cardiovasc Imaging 2017; 18: 276–283.
- 17.
Hamatani Y, Amaki M, Yonezawa R, Yanagi Y, Jo Y, Amano M, et al. Prevalence, determinants, and prognostic significance of exercise-induced pulmonary hypertension in patients with hypertrophic cardiomyopathy. Int J Cardiovasc Imaging 2019; 35: 837–844.
- 18.
Okita K, Kinugawa S, Tsutsui H. Exercise intolerance in chronic heart failure--skeletal muscle dysfunction and potential therapies. Circ J 2013; 77: 293–300.
- 19.
Inzucchi SE, Kosiborod M, Fitchett D, Wanner C, Hehnke U, Kaspers S, et al. Improvement in cardiovascular outcomes with empagliflozin is independent of glycemic control. Circulation 2018; 138: 1904–1907.
- 20.
Baker WL, Buckley LF, Kelly MS, Bucheit JD, Parod ED, Brown R, et al. Effects of sodium-glucose cotransporter 2 inhibitors on 24-hour ambulatory blood pressure: A systematic review and meta-analysis. J Am Heart Assoc 2017; 6: e005686.
- 21.
Imai Y, Obara T, Asamaya K, Ohkubo T. The reason why home blood pressure measurements are preferred over clinic or ambulatory blood pressure in Japan. Hypertens Res 2013; 36: 661–672.
- 22.
Kario K, Hoshide S, Okawara Y, Tomitani N, Yamauchi K, Ohbayashi H, et al. Effect of canagliflozin on nocturnal home blood pressure in Japanese patients with type 2 diabetes mellitus: The SHIFT-J study. J Clin Hypertens (Greenwich) 2018; 20: 1527–1535.
- 23.
Sasaki T, Yanagitani Y, Kubo T, Matsuo H, Miyatake K. Precipitating factors in patients with repetitive exacerbation of chronic left heart failure. J Cardiol 1998; 31: 215–222.
- 24.
Okumura T, Murihara T. Are sodium-glucose cotransporter 2 inhibitors really useful and safe for advanced heart failure? Circ J 2018; 82: 1752–1753.
- 25.
Kawasoe S, Maruguchi Y, Kajiya S, Uenomachi H, Miyata M, Kawasoe M, et al. Mechanism of the blood pressure-lowering effect of sodium-glucose cotransporter 2 inhibitors in obese patients with type 2 diabetes. BMC Pharmacol Toxicol 2017; 18: 23.
- 26.
Seo Y, Yamamoto M, Machino-Ohtsuka T, Aonuma K. Effects and safety of sodium glucose cotransporter 2 inhibitors in diabetes patients with drug-refractory advanced heart failure. Circ J 2018; 82: 1959–1962.
- 27.
Scheen AJ. Effect of SGLT2 inhibitors on the sympathetic nervous system and blood pressure. Curr Cardiol Rep 2019; 21: 70.
- 28.
Matthews VB, Elliot RH, Rudnicka C, Hricova J, Herat L, Schlaich MP. Role of the sympathetic nervous system in regulation of the sodium glucose cotransporter 2. J Hypertens 2017; 35: 2059–2068.
- 29.
Ohta A, Kato H, Ishii S, Sasaki Y, Nakamura Y, Nakagawa T, et al. Ipragliflozin, a sodium glucose co-transporter 2 inhibitor, reduces intrahepatic lipid content and abdominal visceral fat volume in patients with type 2 diabetes. Expert Opin Pharmacother 2017; 18: 1433–1438.
- 30.
Kamei S, Iwamoto M, Kameyama M, Shimoda M, Kinoshita T, Obata A, et al. Effect of tofogliflozin on body composition and glycemic control in Japanese subjects with type 2 diabetes mellitus. J Diabetes Res 2018; 2018: 6470137.
- 31.
McMurray JJV, DeMets DL, Inzucchi SE, Køber L, Kosiborod MN, Langkilde AM, et al. The Dapagliflozin And Prevention of Adverse-outcomes in Heart Failure (DAPA-HF) trial: Baseline characteristics. Eur J Heart Fail 2019; 21: 1402–1411.
- 32.
Notarius CF, Maqder S. Central venous pressure during exercise: Role of muscle pump. Can J Physiol Pharmacol 1996; 74: 647–651.