Abstract
Background:
Heart rate (HR) is an important factor in atrial fibrillation (AF); however, it remains unclear whether the impact of HR differs between paroxysmal AF and sustained (persistent and permanent) AF.
Methods and Results:
The association of resting HR during AF with adverse events (composite of all-cause death, hospitalization for heart failure, stroke/systemic embolisms, myocardial infarction, and arrhythmic events) in 1,064 paroxysmal and 1,610 sustained AF patients from the Fushimi AF Registry were investigated. These patients were divided into 4 groups based on their resting HR; ≥110 beats/min (bpm), 80–109 bpm, 60–79 bpm, and <60 bpm. The number of patients in each group was 486, 400, 172, and 22 for paroxysmal AF, and 205, 734, 645, and 71 for sustained AF, respectively. Among patients with sustained AF, a HR ≥110 bpm was associated with a higher incidence of adverse events at 1 year and during the entire follow up (median of 1,833 days) (hazard ratio [95% confidence interval] compared with a HR of 60–79 bpm: 1.90 [1.31–2.72] at 1 year, 1.38 [1.10–1.72] during the entire follow up). Patients with a HR <60 bpm showed higher incidence of adverse events at 1 year; however, the incidence of adverse events did not differ among all HR groups of paroxysmal AF.
Conclusions:
Baseline HR was associated with adverse events in sustained AF, but not in paroxysmal AF.
Atrial fibrillation (AF) is one of the most common types of cardiac arrhythmia, and is associated with increased mortality and morbidity.1,2
AF causes an irregular and rapid heart rate (HR), which results in a shorter diastolic filling time, leading to a reduced cardiac output. Rapid HR also causes tachycardia-induced cardiomyopathy and heart failure (HF).3
Therefore, HR is an important clinical factor in patients with AF. However, the optimal HR in patients with AF remains unclear. A prospective US registry of AF patients showed increased mortality according to the increase in HR in patients with permanent AF patients with a HR >65 beats/min (bpm),4
but this association was not observed in other studies in patients with permanent AF5
or in those with HF.6–9
In a randomized clinical trial, lenient HR control (HR <110 bpm) was not inferior to strict HR control (HR <80 bpm) in patients with permanent AF.10
Furthermore, AF is classified into paroxysmal (PAF) and sustained (permanent or persistent) AF (SAF) based on the duration of AF, but the subjects in the previous studies had SAF. There are no studies on the effect of HR on clinical outcomes in patients with PAF. In the present study, we investigated the relationship between HR and the incidence of adverse events in PAF and SAF patients using data from the Japanese prospective multicenter cohort study of AF, the Fushimi AF Registry.
Methods
The detailed study design, patient enrollment, definitions of the measurements, and baseline clinical characteristics of patients in the Fushimi AF Registry were previously described (UMIN Clinical Trials Registry: UMIN000005834).11,12
The inclusion criterion for the registry is the documentation of AF on a 12-lead electrocardiogram or Holter monitoring at any time. There were no exclusion criteria. A total of 81 institutions participated in the registry of Fushimi district, Kyoto, Japan (Supplementary Appendix). We started to enroll patients from March 2011. Collection of follow-up information was mainly conducted through review of the inpatient and outpatient medical records, and additional follow-up information was collected through contact with patients, relatives, or referring physicians by mail or telephone. The study protocol conformed to the ethical guidelines of the 1975 Declaration of Helsinki, and was approved by the ethical committees of the National Hospital Organization Kyoto Medical Center and Ijinkai Takeda General Hospital.
Patients
In total, 4,879 patients were enrolled by the end of May 2017. Follow-up data (collected annually) were available for 4,454 patients (91.3%) as of November 2018. Of these 4,454 patients, we obtained baseline electrocardiograms during AF for 2,740 patients. After excluding 64 patients with ventricular pacemaker rhythm and 2 patients with missing data, 2,674 patients (1,064 in the PAF group and 1,610 in the SAF group) were included in the current analysis.
Group Assignment and Definition
Type of AF was defined as the following: PAF was defined as self-terminating AF, in most cases within 48 h; some AF paroxysms may continue for up to 7 days; persistent AF was defined as AF that lasts >7 days, including episodes that are terminated by cardioversion, either with drugs or by direct current cardioversion, after 7 days or more; and permanent AF was defined as AF that is accepted by the patient (and physician). Because distinguishing persistent and permanent type is sometimes difficult in daily clinical practice, we combined these 2 subtypes into a SAF subtype, as described in our previous reports.13,14
HR at the time of AF was measured by electrocardiography in a resting position at study entry. According to the previous study10
and the current guidelines,15
we divided the patients into 4 groups based on their HR at baseline: HR <60 bpm, 60 bpm≤HR<80 bpm, 80 bpm≤HR<110 bpm, and HR ≥110 bpm.
Study Endpoints
The primary composite endpoint in the analysis was adverse events defined as time to the first occurrence of all-cause death, hospitalization for HF, incidence of stroke/systemic embolism (SE), myocardial infarction, or tachycardia- and bradycardia-related events. We also examined the relationship between HR and incidence of each component of primary endpoint and cardiovascular events (composite of cardiovascular death, hospitalization for HF, incidence of stroke/SE, myocardial infarction, and tachycardia- and bradycardia-related events). Causes of death, including cardiac death due to HF, acute coronary syndrome, or dysrhythmia, were adjudicated after consideration of all available information, as reported previously.16
Hospitalization for HF was determined by the attending physician based on history, clinical presentation (symptoms and physical examination), response to HF therapy, chest radiography, echocardiography, cardiac catheterization findings, and in-hospital course.17
Stroke was defined as the sudden onset of a focal neurologic deficit in a location consistent with the territory of a major cerebral artery, and the diagnosis of ischemic or hemorrhagic stroke was confirmed by computed tomography or magnetic resonance imaging. SE was defined as acute vascular occlusion of an extremity or organ. Tachycardia-related events were defined as ventricular tachyarrhythmia, and bradycardia-related events were defined as pacemaker implantation or loss of consciousness.
Statistical Analysis
Continuous variables are expressed as the mean±standard deviation or median and interquartile range according to the distributions, and categorical variables are presented as numbers and percentages. The P values for trends across the HR groups were calculated using the Jonckheere-Terpstra test for continuous variables and the Cochran–Armitage test for categorical variables. The cumulative incidences of clinical outcomes were estimated by using the Kaplan-Meier method and differences were assessed using the log-rank test.
We carried out multivariate analysis for the indicators of adverse events using the Cox proportional hazards model. The covariates selected were older age (≥75 years), female (vs. male), low body weight (≤50 kg), history of stroke/SE, pre-existing HF, left ventricular (LV) dysfunction (EF <40%), valvular heart disease, chronic kidney disease, anemia (Hb <11 g/dL), coronary artery disease, hypertension, diabetes mellitus, and prescription of rate-controlling drugs (β-blockers, digitalis and non-dihydropyridine calcium channel blockers) and oral anti-coagulants (warfarin, dabigatran, rivaroxaban, apixaban, and edoxaban). We used EZR18
(Saitama Medical Center, Jichi Medical University, Saitama, Japan), which is a graphical user interface for R (The R Foundation for Statistical Computing, Vienna, Austria) to perform the Jonckheere-Terpstra test and JMP version 12 (SAS Institute, Cary, NC, USA) to perform all other analyses. Two-sided P values <0.05 were considered significant.
Results
The distribution of the patients with PAF and SAF according to their HR is shown in
Figure 1. The mean HR at the time of AF was significantly higher in the PAF group than in the SAF group (108.9±28.9 bpm vs. 86.6±22.4 bpm; P<0.0001). The number of patients with HR<60 bpm, 60 bpm≤HR<80 bpm, 80 bpm≤HR<110 bpm, and HR ≥110 bpm was 22 (2.1%), 166 (15.6%), 388 (36.5%), and 488 (45.9%) in the PAF group, and 68 (4.2%), 616 (38.3%), 720 (44.7%), and 206 (12.8%) in the SAF group, respectively. Baseline characteristics of each group are shown in
Table 1
(PAF group) and
Table 2
(SAF group). In the PAF group, patients with a HR ≥110bpm were more likely to be female and have a lower body weight. The prevalence of valvular heart disease, coronary artery disease and chronic kidney disease was higher among patients with a HR <60 bpm, but that of HF or LV dysfunction was similar among the 4 groups. In the SAF group, patients with a HR ≥110 bpm were more likely to be female and the prevalence of HF or LV dysfunction was higher. Although symptomatic AF was more common in the PAF group than in the SAF group, the prevalence of symptomatic AF was higher among patients with a HR ≥110bpm in both the PAF and SAF groups. Rate-controlling drugs were more often prescribed for patients with a HR ≥110 bpm in the SAF group, whereas their prescription was comparable among the 4 subgroups in the PAF group.
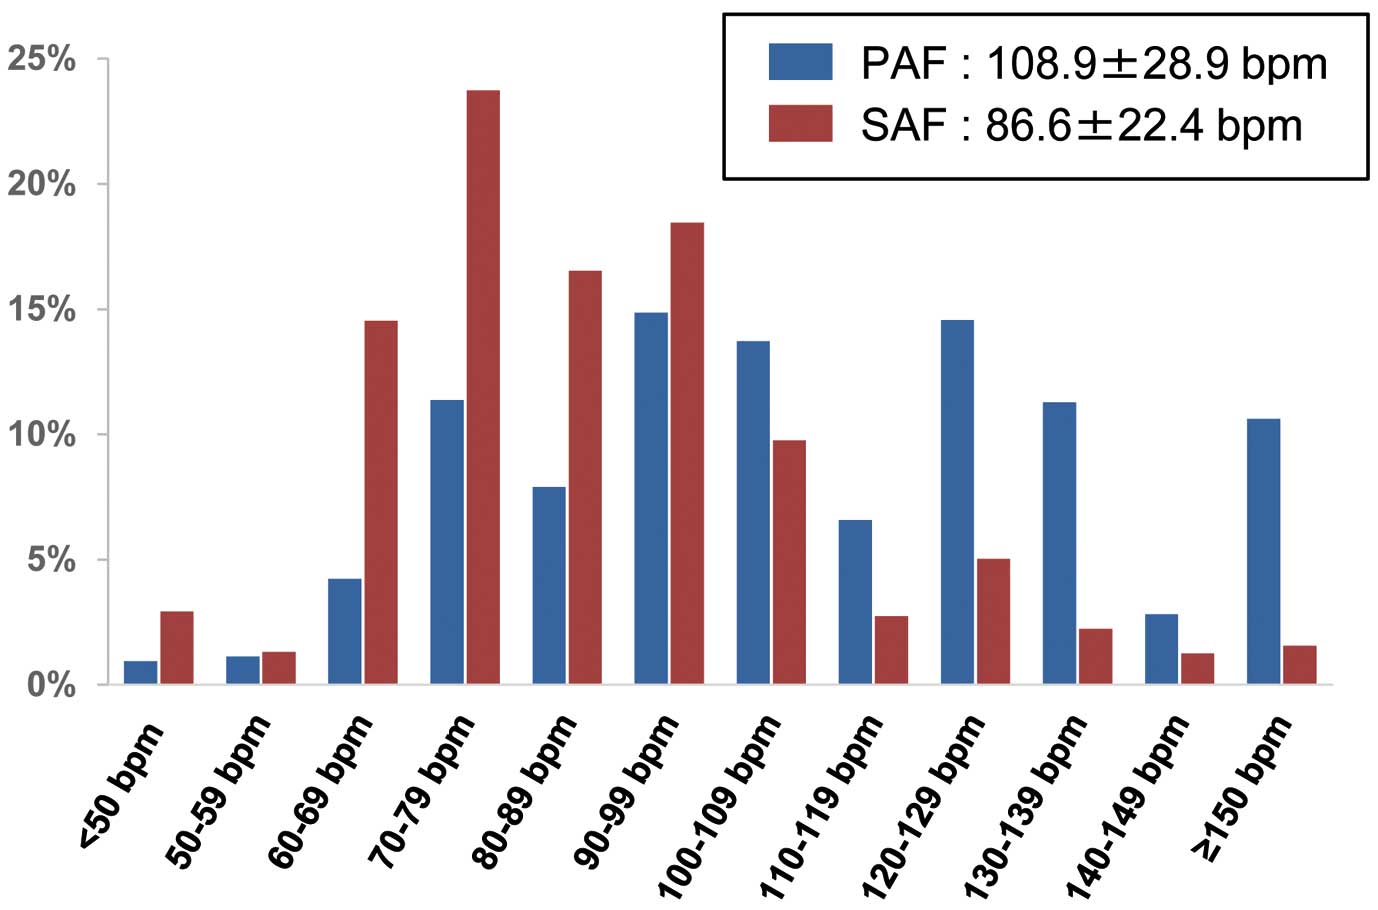
Table 1.
Baseline Characteristics of Patients With PAF
| Variables |
Entire
cohort |
HR
<60 bpm |
HR
60–79 bpm |
HR
80–109 bpm |
HR
≥110 bpm |
P for
trend |
| Number |
1,064 |
22 (2.1) |
166 (15.6) |
388 (36.5) |
488 (45.9) |
|
| Age, years |
72.5±11.7 |
70.0±10.5 |
71.8±12.4 |
72.0±12.0 |
73.2±11.3 |
0.1 |
| ≥75 years |
514 (48.3) |
9 (40.9) |
79 (47.6) |
177 (45.6) |
249 (51.0) |
0.2 |
| Female gender |
449 (42.2) |
3 (13.6) |
49 (29.5) |
149 (38.4) |
248 (50.8) |
<0.0001 |
| Body weight, kg |
59.1±13.6 |
61.9±12.9 |
61.2±14.5 |
59.6±13.2 |
57.8±13.4 |
0.002 |
| ≤50 kg |
257 (26.8) |
4 (19.1) |
35 (23.0) |
87 (25.2) |
131 (29.6) |
0.049 |
| SBP, mmHg |
124.4±18.9 |
124.5±18.2 |
121.7±18.1 |
123.2±18.9 |
126.4±19.2 |
0.002 |
| DBP, mmHg |
70.0±12.8 |
69.7±13.5 |
67.7±12.0 |
70.1±12.3 |
70.7±12.9 |
0.02 |
| PR, bpm |
76.8±17.8 |
67±10.8 |
71.3±11.0 |
76.4±17.6 |
79.5±19.3 |
<0.0001 |
| AF symptom |
696 (65.4) |
12 (54.6) |
101 (60.8) |
244 (62.9) |
339 (69.5) |
0.009 |
| Stroke/SE |
178 (16.7) |
4 (18.2) |
31 (18.7) |
61 (15.8) |
82 (16.8) |
0.7 |
| HF |
191 (18.0) |
5 (22.7) |
36 (21.7) |
63 (16.2) |
87 (17.8) |
0.4 |
| LV dysfunction |
25 (2.4) |
1 (4.6) |
4 (2.4) |
9 (2.3) |
11 (2.3) |
0.7 |
| Valvular heart disease |
131 (12.3) |
4 (18.2) |
27 (16.3) |
51 (13.1) |
49 (10.0) |
0.02 |
| Hypertension |
667 (62.7) |
9 (40.9) |
104 (62.8) |
259 (66.8) |
295 (60.5) |
0.9 |
| Diabetes |
241 (22.7) |
7 (31.8) |
42 (25.3) |
81 (20.9) |
111 (22.8) |
0.5 |
| Coronary artery disease |
174 (16.4) |
6 (27.3) |
37 (22.3) |
71 (18.3) |
60 (12.3) |
0.0003 |
| CKD |
361 (33.9) |
9 (40.9) |
63 (38.0) |
140 (36.1) |
149 (30.5) |
0.03 |
| Anemia (Hb <11 g/dL) |
163 (16.3) |
6 (27.3) |
25 (16.1) |
44 (11.9) |
88 (19.3) |
0.3 |
| COPD |
43 (4.0) |
0 (0.0) |
5 (3.1) |
21 (5.4) |
17 (3.5) |
0.9 |
| OAC |
482 (45.4) |
9 (40.9) |
86 (51.8) |
183 (47.3) |
204 (42.0) |
0.049 |
| Rate-controlling drug |
627 (59.1) |
6 (27.3) |
73 (44.0) |
161 (41.6) |
194 (39.9) |
0.8 |
| Digitalis |
66 (6.2) |
2 (9.1) |
16 (9.6) |
19 (4.9) |
29 (6.0) |
0.2 |
| NDHP-CCB |
146 (13.8) |
1 (4.6) |
22 (13.3) |
58 (15.0) |
65 (13.4) |
0.7 |
| β-blockers |
293 (27.6) |
5 (22.7) |
49 (29.5) |
112 (28.9) |
127 (26.1) |
0.5 |
| AAD |
314 (30.0) |
6 (27.8) |
45 (27.1) |
115 (29.7) |
148 (30.5) |
0.4 |
| RAS-I |
449 (42.3) |
9 (40.9) |
76 (45.8) |
157 (40.6) |
207 (42.6) |
0.8 |
| Loop diuretics |
170 (16.0) |
2 (9.1) |
31 (18.7) |
73 (18.9) |
64 (13.2) |
0.1 |
| MRA |
70 (6.6) |
0 (0.0) |
9 (5.4) |
31 (8.0) |
30 (6.2) |
0.7 |
| Ablation |
74 (7.0) |
0 (0.0) |
11 (6.6) |
25 (6.4) |
38 (7.8) |
0.2 |
| Cardioversion |
43 (4.0) |
1 (4.6) |
5 (3.0) |
20 (5.2) |
17 (3.5) |
0.8 |
Data are presented as n (%) or mean±SD. AAD, anti-arrhythmic drug; AF, atrial fibrillation; bpm, beats/min; CKD, chronic kidney disease; COPD, chronic obstructive pulmonary disease; DBP, diastolic blood pressure; Hb, hemoglobin; HF, heart failure; LV, left ventricular; MRA, mineral corticoid receptor antagonists; NDHP-CCB, non-dihydropyridine calcium channel blocker; OAC, oral anticoagulant; PAF, paroxysmal atrial fibrillation; PR, pulse rate; RAS-I, renin angiotensin system inhibitor; SBP, systolic blood pressure; SE, systemic embolism.
Table 2.
Baseline Characteristics in Patients With SAF
| Variables |
Entire
cohort |
HR
<60 bpm |
HR
60–79 bpm |
HR
80–109 bpm |
HR
≥110 bpm |
P for
trend |
| Number |
1,610 |
68 (4.2) |
616 (38.3) |
720 (44.7) |
206 (12.8) |
|
| Age, years |
74.8±10.0 |
76.9±10.2 |
74.8±9.4 |
75.0±10.4 |
73.3±10.5 |
0.2 |
| ≥75 years |
872 (54.2) |
42 (61.8) |
332 (53.9) |
396 (55.0) |
102 (49.5) |
0.2 |
| Female gender |
623 (38.7) |
24 (35.3) |
205 (33.3) |
288 (40.0) |
106 (51.5) |
<0.0001 |
| Body weight, kg |
59.6±13.5 |
58.5±12.5 |
60.4±13.6 |
59.1±12.8 |
58.9±15.6 |
0.2 |
| ≤50 kg |
378 (25.4) |
20 (33.9) |
126 (22.6) |
172 (25.3) |
60 (31.3) |
0.2 |
| SBP, mmHg |
123.8±18.7 |
126.1±20.4 |
124.7±19.0 |
122.7±18.2 |
123.9±18.6 |
0.1 |
| DBP, mmHg |
71.0±13.2 |
69.7±12.4 |
70.4±13.0 |
71.2±13.0 |
72.7±14.8 |
0.05 |
| PR, bpm |
80.2±16.0 |
62.4±17.9 |
75.4±12.9 |
83.9±14.3 |
87.5±19.9 |
<0.0001 |
| AF symptom |
521 (32.4) |
17 (25.0) |
172 (27.9) |
237 (32.9) |
95 (46.1) |
<0.0001 |
| Stroke/SE |
400 (24.8) |
19 (27.9) |
157 (25.5) |
175 (24.3) |
49 (23.8) |
0.4 |
| HF |
585 (36.3) |
24 (35.3) |
187 (30.4) |
274 (38.1) |
100 (48.5) |
<0.0001 |
| LV dysfunction |
97 (6.0) |
1 (1.5) |
25 (4.1) |
46 (6.4) |
25 (12.1) |
<0.0001 |
| Valvular heart disease |
382 (23.7) |
14 (20.6) |
159 (25.8) |
167 (23.2) |
42 (20.4) |
0.2 |
| Hypertension |
989 (61.4) |
40 (58.8) |
381 (61.9) |
437 (60.7) |
131 (63.6) |
0.7 |
| Diabetes |
378 (23.5) |
17 (25.0) |
142 (23.1) |
165 (22.9) |
54 (26.2) |
0.6 |
| Coronary artery disease |
217 (13.5) |
5 (7.4) |
78 (12.7) |
104 (14.4) |
30 (14.6) |
0.1 |
| CKD |
604 (37.5) |
27 (39.7) |
231 (37.5) |
269 (37.4) |
77 (37.4) |
0.8 |
| Anemia (Hb <11 g/dL) |
241 (15.7) |
17 (25.8) |
96 (16.2) |
96 (14.1) |
32 (16.5) |
0.2 |
| COPD |
98 (6.1) |
5 (7.4) |
30 (4.9) |
49 (6.8) |
14 (6.8) |
0.3 |
| OAC |
1,088 (67.9) |
48 (71.6) |
429 (70.0) |
486 (67.8) |
125 (60.7) |
0.02 |
| Rate-controlling drug |
781 (48.7) |
22 (32.8) |
312 (50.9) |
365 (50.9) |
123 (59.7) |
0.003 |
| Digitalis |
306 (19.1) |
10 (14.9) |
146 (23.8) |
125 (17.4) |
25 (12.1) |
0.001 |
| NDHP-CCB |
223 (13.9) |
9 (13.4) |
71 (11.6) |
105 (14.6) |
38 (18.5) |
0.02 |
| β-blockers |
498 (31.1) |
10 (14.9) |
195 (31.8) |
212 (29.6) |
81 (39.2) |
0.01 |
| AAD |
120 (7.5) |
3 (4.5) |
40 (6.5) |
45 (6.3) |
32 (15.5) |
0.0008 |
| RAS-I |
748 (46.7) |
36 (53.7) |
285 (46.5) |
332 (46.3) |
95 (46.1) |
0.5 |
| Loop diuretics |
470 (29.3) |
19 (28.4) |
166 (27.1) |
215 (30.0) |
70 (33.4) |
0.07 |
| MRA |
238 (14.9) |
7 (10.5) |
85 (13.9) |
108 (15.1) |
38 (18.5) |
0.07 |
| Ablation |
52 (3.2) |
1 (1.5) |
13 (2.1) |
25 (3.5) |
13 (6.3) |
0.003 |
| Cardioversion |
51 (5.8) |
2 (2.9) |
9 (1.5) |
28 (3.9) |
12 (5.8) |
0.002 |
Data are presented as n (%) or mean±SD. SAF, sustained atrial fibrillation. Other abbreviations are as per Table 1.
During the median follow up of 1,833 days (interquartile range: 774–2,558 days), 385 patients (36.1%) in the PAF group and 735 patients (45.7%) in the SAF group developed adverse events (Table 3). On Kaplan-Maier analysis, patients in the SAF group with a HR ≥110 bpm had a significantly higher incidence of adverse events (unadjusted hazard ratio [95% confidence interval (CI)], 1.38 [1.10–1.72] compared with a HR of 60–79 bpm). The incidence of adverse events in patients with a HR of 80–109 bpm was insignificantly higher than that in patients with a HR of 60–79 bpm (unadjusted hazard ratio [95% CI], 1.16 [0.98–1.36]). In contrast, the incidence of adverse events was comparable among the 4 HR subgroups in the PAF group (log rank P=0.4) (Figure 2A). As the association of baseline HR with adverse events may change according to the follow-up period,9
we examined the incidence of adverse events at 1, 2, and 3 years. At the 1-year follow up, 124 patients (11.7%) in the PAF group and 248 patients (15.8%) in the SAF group had developed adverse events (Table 3). On Kaplan-Maier analysis, patients in the SAF group with a HR ≥110 bpm or a HR <60 bpm had a significantly higher incidence of adverse events (unadjusted hazard ratio [95% CI], 1.90 [1.31–2.72] for a HR ≥110 bpm, and unadjusted hazard ratio [95% CI], 1.86 [1.03–3.13] for a HR <60 bpm, compared with a HR of 60–79 bpm), but the incidence of adverse events was not different between patients with a HR of 80–109 bpm and those with a HR of 60–79 bpm (unadjusted hazard ratio [95% CI], 1.22 [0.91–1.63]). In the PAF group, the incidence of adverse events was also comparable among the 4 HR groups (log rank P=0.7) (Figure 2B). At the 2- or 3-year follow up, the incidence of adverse events was comparable among the 4 HR subgroups in the PAF group, whereas it was higher in patients in the SAF group with a HR ≥110 bpm. In the PAF group, hazard ratios [95% CI] for a HR <60 bpm, HR of 80–109 bpm, and HR ≥110 bpm for adverse events compared with a HR of 60–79 bpm were 1.02 [0.35–2.38], 0.75 [0.50–1.12], and 0.81 [0.56–1.20] at 2 years, and 1.03 [0.40–2.23], 0.82 [0.58–1.18], and 0.83 [0.59–1.19] at 3 years, respectively. In the SAF group, they were 1.28 [0.77–2.01], 1.11 [0.90–1.39], and 1.38 [1.01–1.84] at 2 years, and 1.20 [0.75–1.82], 1.16 [0.95–1.41], and 1.42 [1.08–1.85] at 3 years, respectively.
Table 3.
Incidence of Events During 1-Year and Entire Follow-up Periods
| HR |
PAF (bpm) |
SAF (bpm) |
| <60 |
60–79 |
80–109 |
110 |
P for trend |
<60 |
60–79 |
80–109 |
110 |
P for trend |
| 1-year follow-up period |
| Number |
22 (2.1) |
166 (15.6) |
388 (36.5) |
488 (45.9) |
|
68 (4.2) |
616 (38.3) |
720 (44.7) |
206 (12.8) |
|
| Adverse events |
3 (13.6) |
19 (11.5) |
40 (10.3) |
62 (12.7) |
0.6 |
15 (22.1) |
78 (12.7) |
109 (15.2) |
46 (22.3) |
0.04 |
| Cardiovascular events |
1 (4.6) |
13 (7.8) |
29 (7.5) |
33 (6.7) |
0.8 |
9 (13.2) |
54 (8.8) |
74 (10.3) |
29 (14.1) |
0.1 |
| All-cause death |
3 (13.6) |
10 (6.0) |
14 (3.6) |
42 (8.6) |
0.2 |
8 (11.8) |
38 (6.2) |
55 (7.6) |
21 (10.2) |
0.3 |
| Cardiovascular death |
0 (0) |
3 (1.8) |
3 (0.8) |
8 (1.3) |
0.6 |
2 (2.9) |
12 (2.0) |
14 (1.9) |
4 (1.9) |
0.8 |
| Cardiac death |
0 (0.0) |
3 (1.8) |
2 (0.5) |
6 (1.2) |
0.96 |
2 (2.9) |
4 (0.7) |
9 (1.3) |
4 (1.9) |
0.5 |
| Hospitalization for HF |
0 (0.0) |
7 (4.2) |
12 (3.1) |
10 (2.1) |
0.3 |
2 (2.9) |
30 (4.9) |
40 (5.6) |
17 (8.3) |
0.06 |
| Myocardial infarction |
0 (0.0) |
0 (0.0) |
3 (0.8) |
1 (0.2) |
0.98 |
0 (0.0) |
1 (0.2) |
1 (0.1) |
0 (0.0) |
0.8 |
| Stroke/SE |
0 (0.0) |
2 (1.2) |
8 (2.1) |
7 (1.4) |
0.9 |
1 (1.5) |
16 (2.6) |
23 (3.2) |
6 (2.9) |
0.5 |
| Bradycardia events |
1 (4.6) |
3 (1.8) |
3 (0.8) |
7 (1.4) |
0.6 |
5 (7.4) |
3 (0.5) |
3 (0.4) |
3 (1.5) |
0.06 |
| Tachycardia events |
1 (4.6) |
1 (0.6) |
2 (0.5) |
6 (1.2) |
0.9 |
0 (0.0) |
2 (0.3) |
2 (0.3) |
4 (1.9) |
0.03 |
| Entire follow-up period |
| Number |
22 (2.1) |
166 (15.6) |
388 (36.5) |
488 (45.9) |
|
68 (4.2) |
616 (38.3) |
720 (44.7) |
206 (12.8) |
|
| Adverse events |
7 (31.8) |
71 (42.8) |
139 (35.8) |
168 (34.4) |
0.2 |
31 (45.6) |
261 (42.4) |
335 (46.6) |
108 (52.4) |
0.02 |
| Cardiovascular events |
2 (9.1) |
51 (30.7) |
98 (25.3) |
102 (20.9) |
0.08 |
22 (32.4) |
184 (29.9) |
240 (33.3) |
70 (34.0) |
0.2 |
| All-cause death |
6 (27.3) |
40 (24.1) |
69 (17.8) |
110 (22.5) |
0.9 |
17 (25.0) |
152 (24.7) |
181 (25.1) |
60 (29.1) |
0.3 |
| Cardiovascular death |
0 (0) |
8 (4.8) |
18 (4.6) |
24 (4.9) |
0.6 |
6 (8.8) |
42 (6.8) |
45 (6.3) |
13 (6.3) |
0.5 |
| Cardiac death |
0 (0.0) |
5 (3.0) |
12 (3.1) |
19 (3.9) |
0.3 |
5 (7.4) |
23 (3.7) |
25 (3.5) |
11 (5.3) |
0.96 |
| Hospitalization for HF |
0 (0.0) |
23 (13.9) |
53 (13.7) |
46 (9.4) |
0.3 |
11 (16.2) |
111 (18.0) |
130 (18.1) |
49 (23.8) |
0.1 |
| Myocardial infarction |
0 (0.0) |
1 (0.6) |
8 (2.1) |
5 (1.0) |
0.9 |
1 (1.5) |
6 (1.0) |
7 (1.0) |
1 (0.5) |
0.5 |
| Stroke/SE |
1 (4.6) |
20 (12.1) |
36 (9.3) |
32 (6.6) |
0.06 |
8 (11.8) |
64 (10.4) |
99 (13.8) |
17 (8.3) |
0.9 |
| Bradycardia events |
1 (4.6) |
7 (4.2) |
7 (1.8) |
12 (2.5) |
0.3 |
8 (11.8) |
9 (1.5) |
9 (1.3) |
7 (3.4) |
0.1 |
| Tachycardia events |
1 (4.6) |
4 (2.4) |
11 (2.8) |
13 (2.7) |
0.9 |
0 (0.0) |
9 (1.5) |
8 (1.1) |
5 (2.4) |
0.3 |
Data are expressed as n (%). Adverse events were defined as a composite of all-cause death, hospitalization for HF, stroke/SE, myocardial infarction, and arrhythmic events. Cardiovascular events were defined as a composite of cardiovascular death, hospitalization for HF, stroke/SE, myocardial infarction, and arrhythmic events. Abbreviations are as per Tables 1,2.

Regarding cardiovascular events, incidence of cardiovascular events were comparable among the 4 HR groups in PAF group (log-rank P=0.9), and patients with a HR ≥110 bpm showed a significantly higher incidence of cardiovascular events compared to those with a HR of 60–79 bpm in the SAF group at 1-year follow up (unadjusted hazard ratio [95% CI], 1.74 [1.10–2.71]). During the entire follow up, incidence of cardiovascular events in patients with a HR ≥110 bpm tended to be higher than that in patients with a HR of 60–79 bpm in SAF group, but this was not statistically significant. In the PAF group, incidence of cardiovascular events was higher in patients with a HR of 60–79 bpm (Supplementary Figure 1).
To investigate the effect of rate-controlling drugs on HR, we carried out the sub-analysis of patients who were taking rate-controlling drugs compared to those who were not. The incidence of adverse events was comparable between patients who were or were not taking rate-controlling drugs, in both the PAF (unadjusted hazard ratio [95% CI], 1.16 [0.95–1.42]) and SAF groups (unadjusted hazard ratio [95% CI], 1.00 [0.86–1.16]) during the entire follow-up period, and the incidence of adverse events among each HR subgroup also showed the same tendency as the main results in both the PAF and SAF group (Supplementary Figures 2,3).
When we divided the SAF and PAF groups into those with a HR ≥110 bpm and those with a HR <110 bpm, the association of a HR ≥110 with the incidence of adverse events was significant only in the SAF group (Figure 3, P for interaction=0.03 [entire follow up], and 0.2 [1-year follow up]). Even after adjustment for clinical risk factors and prescription of oral-anticoagulants and rate-controlling drugs, a HR ≥110 bpm was significantly associated with increased risk for adverse events compared with a HR of 60–79 bpm both at the 1-year follow up (adjusted hazard ratio [95% CI], 1.71 [1.15–2.51]) and during the entire follow up (adjusted hazard ratio [95% CI], 1.32 [1.03–1.68]) in the SAF group, but this association was not observed in the PAF group (Table 4).
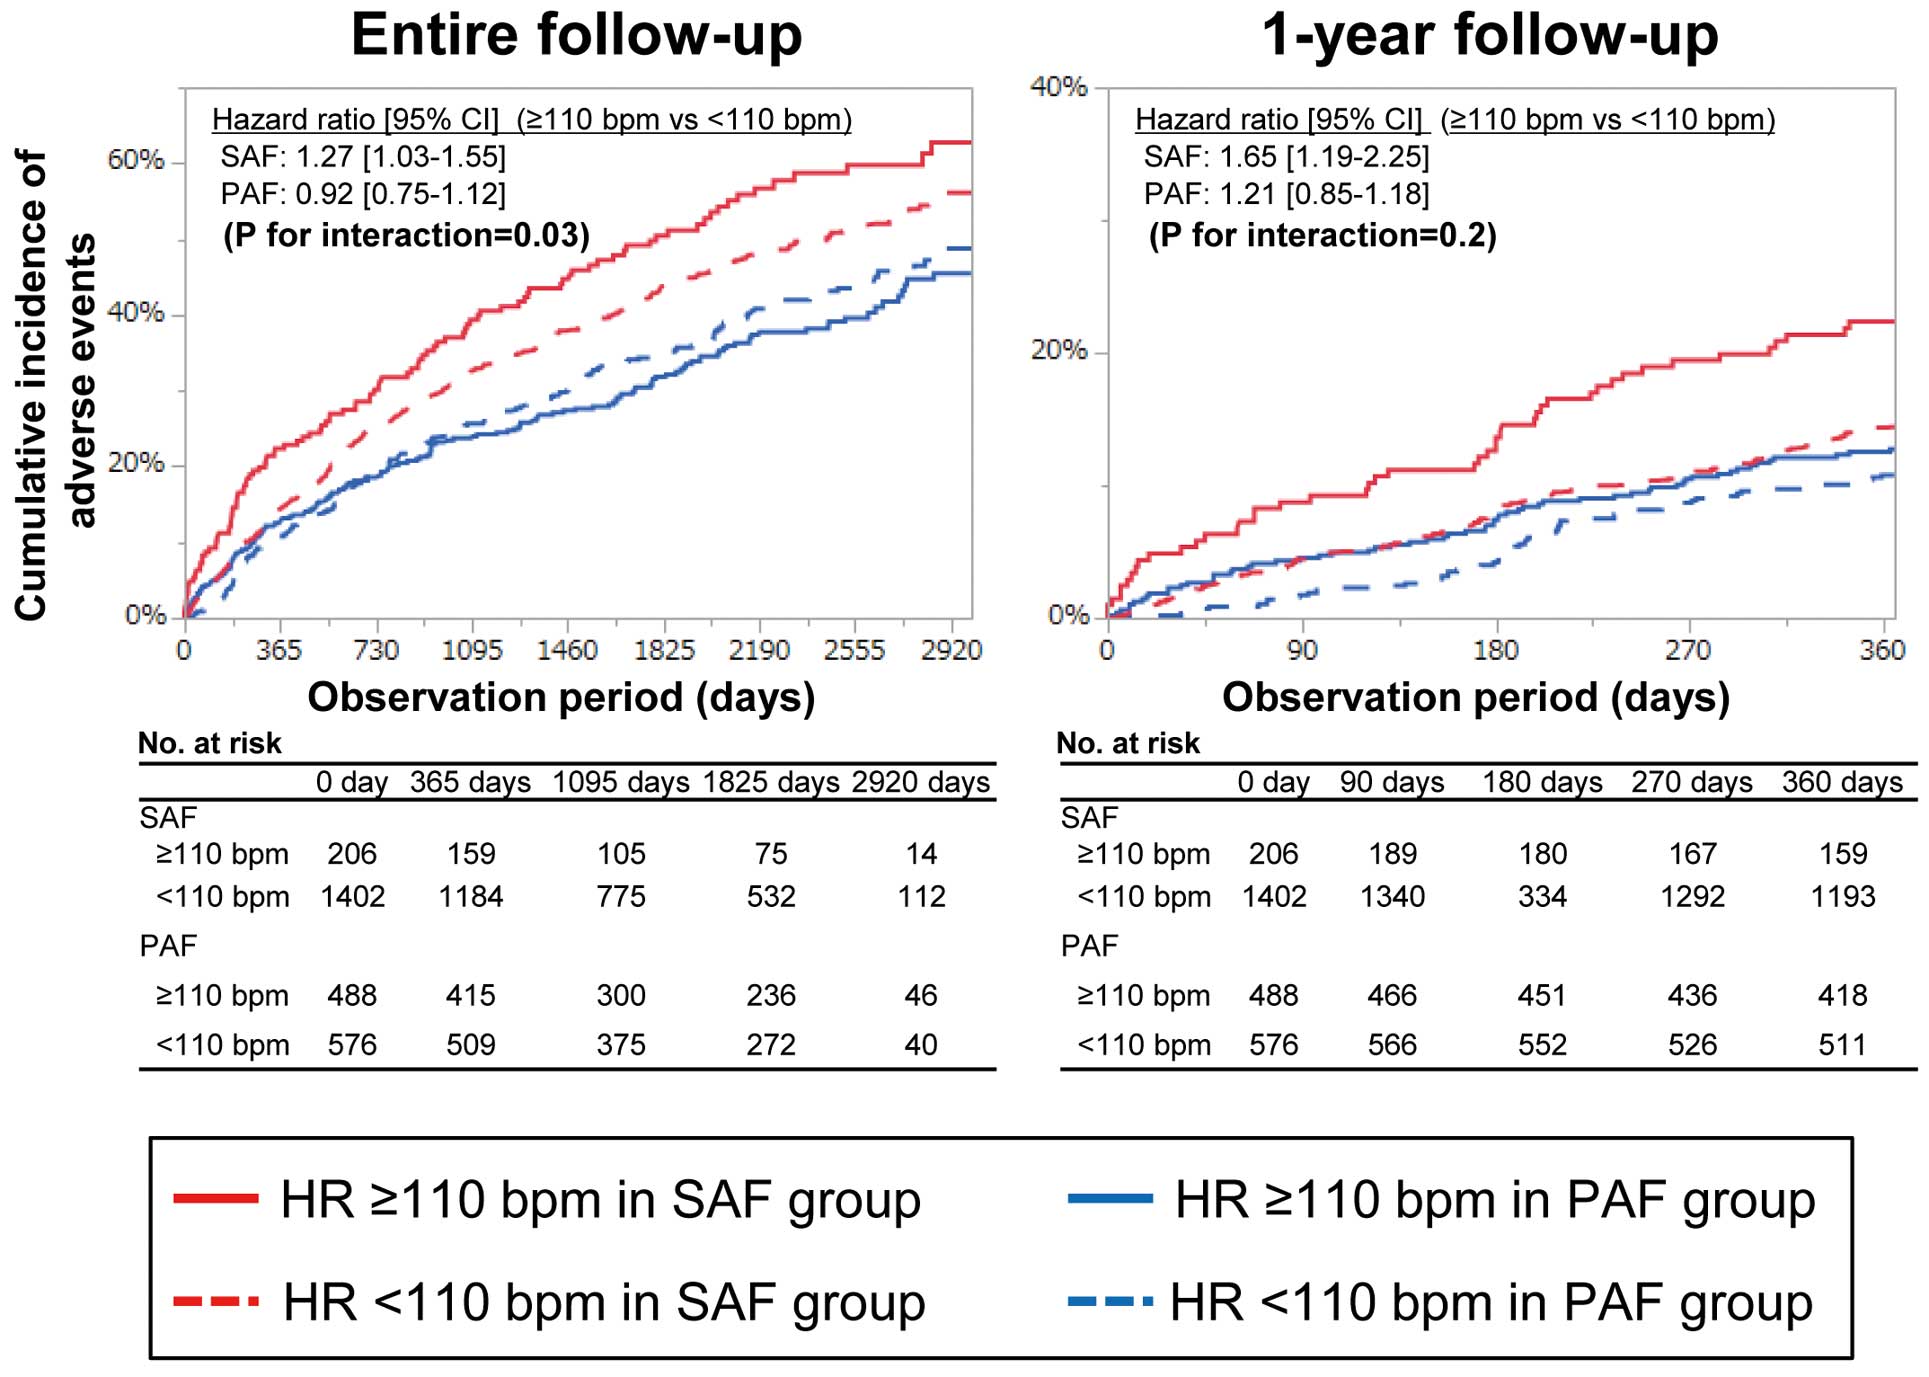
Table 4.
Multivariate Cox Proportional Hazard Analysis for Adverse Events
| |
1-year follow-up period |
Entire follow-up period |
| PAF |
SAF |
PAF |
SAF |
Hazard
ratio |
95% CI |
Hazard
ratio |
95% CI |
Hazard
ratio |
95% CI |
Hazard
ratio |
95% CI |
| Age ≥75 years |
1.63 |
1.09–2.48 |
1.51 |
1.12–2.07 |
2.11 |
1.67–2.68 |
1.67 |
1.40–1.99 |
| Female gender |
0.72 |
0.47–1.09 |
0.63 |
0.45–0.87 |
0.77 |
0.60–0.99 |
0.72 |
0.59–0.87 |
| Body weight ≤50 kg |
1.86 |
1.20–2.89 |
1.80 |
1.30–2.52 |
1.44 |
1.10–1.89 |
1.63 |
1.32–2.02 |
| Stroke/SE |
1.70 |
1.11–2.59 |
1.06 |
0.78–1.42 |
1.64 |
1.25–2.12 |
1.35 |
1.14–1.59 |
| HF |
1.49 |
0.93–2.32 |
1.71 |
1.26–2.32 |
1.82 |
1.38–2.37 |
1.49 |
1.25–1.78 |
| LV dysfunction |
1.61 |
0.70–3.40 |
1.37 |
0.88–2.07 |
1.25 |
0.71–2.09 |
1.09 |
0.80–1.45 |
| Valvular heart disease |
1.24 |
0.76–1.96 |
1.21 |
0.90–1.60 |
1.3 |
0.96–1.72 |
1.20 |
1.00–1.42 |
| CKD |
1.25 |
0.84–1.87 |
1.56 |
1.18–2.08 |
1.43 |
1.14–1.80 |
1.36 |
1.16–1.61 |
| Anemia (Hb <11 g/dL) |
1.94 |
1.25–2.97 |
1.51 |
1.12–2.07 |
1.66 |
1.26–2.16 |
1.73 |
1.42–2.11 |
| Coronary artery disease |
1.83 |
1.20–2.76 |
0.84 |
0.57–1.20 |
1.43 |
1.10–1.85 |
1.32 |
1.08–1.60 |
| Hypertension |
1.06 |
0.72–1.59 |
1.02 |
0.77–1.34 |
1.04 |
0.83–1.33 |
1.06 |
0.90–1.25 |
| Diabetes |
1.28 |
0.85–1.91 |
1.11 |
0.80–1.50 |
1.2 |
0.95–1.52 |
1.15 |
0.96–1.38 |
| OAC |
0.65 |
0.44–0.96 |
0.77 |
0.58–1.02 |
0.82 |
0.66–1.03 |
0.84 |
0.71–0.99 |
| Rate-controlling drug |
0.94 |
0.64–1.37 |
1.15 |
0.87–1.53 |
0.99 |
0.79–1.24 |
0.98 |
0.83–1.15 |
| HR (vs. HR 60–79 bpm) |
| HR ≥110 bpm |
1.41 |
0.84–2.48 |
1.71 |
1.15–2.51 |
0.91 |
0.68–1.23 |
1.32 |
1.03–1.68 |
| HR 80–109 bpm |
1.21 |
0.70–2.16 |
1.19 |
0.88–1.61 |
0.93 |
0.69–1.27 |
1.18 |
0.99–1.40 |
| HR <60 bpm |
0.79 |
0.18–2.42 |
1.78 |
0.95–3.08 |
0.67 |
0.26–1.44 |
1.13 |
0.75–1.64 |
Abbreviations are as per Tables 1,2.
When we divided the SAF and PAF groups into 4 groups based on the quartile of the baseline HR in each group, the association of baseline HR with the incidence of adverse events was also significant in the SAF group, but not in the PAF group (Supplementary Figure 4).
We further analyzed the relationship between baseline HR and incidence of each adverse event at the 1-year follow up (Figure 4). Hazard ratios for all-cause death were comparable among the 4 HR subgroups in both the PAF and SAF groups, although patients with a HR of 80–109 bpm in the SAF group had a higher hazard ratio for all-cause death than those with the same HR in the PAF group. Hazard ratios for stroke/SE were also comparable among the 4 HR subgroups in both the PAF and SAF groups. However, hazard ratios for cardiac death or hospitalization for HF demonstrated a significantly positive linear trend in the SAF group, but a negative trend in the PAF group. Regarding tachycardia- and bradycardia-related events, hazard ratios were similar among the 4 HR subgroups in the PAF group. However, the hazard ratio for tachycardia-related events was higher in patients with a HR ≥110 bpm and that for bradycardia-related events was higher in patients with a HR <60 bpm in the SAF group.
Discussion
In this prospective cohort study of Japanese AF patients, we demonstrated that the association of baseline HR with the incidence of adverse events was different between PAF and SAF groups. In the SAF group, a high HR (≥110 bpm) was associated with a higher incidence of adverse events at 1-year and during the entire follow up, and a low HR (<60 bpm) was associated with a higher incidence of adverse events at the 1-year follow up. However, this association was not observed in the PAF group. In the SAF group, the incidences of cardiac death or hospitalization for HF and tachycardia-related events at the 1-year follow up were higher in the high HR group, and the incidence of bradycardia-related events was higher in the low HR group, but there was no difference in the incidence of each adverse event among the 4 HR subgroups of PAF patients.
Difference in HR Between PAF and SAF Groups
AF is classified into PAF and SAF according to the duration of AF. It has been reported that clinical outcomes differ between patients with PAF and SAF.13,19,20
HR is a key issue in AF patients because rapid HR may not only impair the quality of life, but also negatively affect their clinical outcomes.21–24
However, data on HR of AF in PAF patients were limited. Our study demonstrated that the baseline HR was higher in patients with PAF, and a high HR (≥110 bpm) was more common in the PAF group (46% vs. 13%). The prevalence of HF and LV dysfunction was higher among patients with a high HR in the SAF group, whereas it was comparable among each HR subgroup in the PAF group. This suggested that a high HR is associated with worse clinical background in the SAF group, but not in the PAF group.
HR and Adverse Events in the SAF Group
The optimal HR in SAF was explored in previous studies, but it still remains unclear. The ORIBT-AF registry demonstrated an increase in mortality according to the increase in HR in SAF patients with a HR >65 bpm.4
However, in the RACE II trial, a randomized trial of lenient vs. strict rate control in permanent AF patients, lenient rate control was not inferior to strict rate control.10,25
An analysis of individual patient-level data from the AFFIRM and AF-CHF trials also revealed that baseline HR was not associated with mortality, except in patients with a HR >114 bpm.5
Similar to the RACE II trial and analysis of AFFIRM and AF-CHF trials, the incidence of adverse events was similar between patients with a HR of 60–79 bpm and those with a HR of 80–109 bpm in our study, whereas patients with a HR ≥110 bpm had a higher incidence of these events. Furthermore, patients with a HR <60 bpm had a higher incidence of adverse events, mainly bradycardia-related events. A slow HR may cause problems through adverse effects of rate-controlling drugs. In addition, to maintain physiological needs, the HR may need to be faster in AF than in sinus rhythm because the atria are not contributing to cardiac output.23,26
HR and Adverse Events in the PAF Group
In patients with PAF, a high HR was common, but there was no association between HR and adverse events. There have been few studies on the relationship between HR and adverse events in PAF patients. PAF patients were excluded from the RACE II trial10,25
and the analysis from the ORBIT AF registry.4
The analysis of AFFIRM and AF-CHF trials included ∼35% of PAF patients, but PAF and SAF patients were combined into the AF group and the study did not show data for the PAF and SAF patients separately.5
In the retrospective analysis of data from 4 studies enrolling patients with HF and cardiac resynchronization therapy defibrillator devices, PAF patients with a high AF burden and poor rate control had a greater risk of hospitalization for HF.27
AF burden may therefore have a greater effect on adverse events than HR in patients with PAF.
Study Limitations
The present study has several limitations. First, the results were derived from a prospective observational study; therefore, they only reflect association and not causality due to the limitations inherent to the design such as selection bias and unmeasured confounders. Second, HR was measured only at baseline, and the statistical analysis was based only on clinical details at the time of enrollment. Thus, changes in HR, clinical backgrounds, and treatments, including prescriptions of rate-controlling drugs, were not taken into consideration during the follow-up periods, although the overall results were consistent in sub-analysis of patients with and without rate-controlling drugs (Supplementary Figures 1,2) and in multivariate analysis (Table 4). Third, we had no data on AF burden in PAF patients. Recent evidences suggest that higher AF burden is associated with higher risk of stroke, as well as all-cause death and incidence of HF.28
However, the threshold that results in an increased risk of clinical events is unclear. We divided the entire cohort into PAF and SAF according to the current guidelines, and the effect of HR on adverse events in PAF patients with high AF burden remains unclear. Fourth, there is a circadian variation in PAF,29
but we had no data on it. Finally, the number of the patients with a HR <60 bpm was relatively low, which might provide little power for these comparisons.
Regardless of these limitations, our study demonstrated the association between HR and adverse events in PAF and SAF patients from a large community-based cohort study, which provides important insights into the optimal rate and rhythm control therapy for AF patients.
Conclusions
In a community-based Japanese AF cohort, the effect of HR differed between paroxysmal AF and sustained AF. In SAF patients, a high HR (≥110 bpm) was associated with adverse events at 1-year and during the entire follow up, and a low HR (<60 bpm) was associated with adverse events at the 1-year follow up. However, there was no association between the baseline HR and adverse events in PAF patients.
Acknowledgment
We sincerely appreciate the efforts of the clinical research coordinators (T. Shinagawa, M. Mitamura, M. Fukahori, M. Kimura, M. Fukuyama, and C. Kamata).
Author Contributions
M. Iguchi analyzed the data and wrote the paper. Y.H., K.I., H.S., Y. Aono, S.I., K.D., A.F., Y. An, M. Ishii, N.M., M.E., H.T., H.W., K.H., H.O. and M. Abe contributed to the acquisition of data, and helped with data analysis and interpretation. M. Akao is a principal investigator of the Fushimi AF Registry, and the corresponding author of this paper.
Sources of Funding
The Fushimi AF Registry is supported by research funding from Boehringer Ingelheim, Bayer Healthcare, Pfizer, Bristol-Myers Squibb, Astellas Pharma, AstraZeneca, Daiichi Sankyo, Novartis Pharma, MSD, Sanofi-Aventis, and Takeda Pharmaceutical. The sponsors had no role in the design and conduct of the study; collection, management, analysis, and interpretation of the data; or preparation, review, or approval of the manuscript. This study was partially supported by the Practical Research Project for Life-Style related Diseases including Cardiovascular Diseases and Diabetes Mellitus from the Japan Agency for Medical Research and Development, AMED (19ek0210082 h0003, 18ek0210056 h0003).
Disclosures
M. Akao received lecture fees from Pfizer, Bristol-Myers Squibb, Boehringer Ingelheim, Bayer Healthcare, and Daiichi-Sankyo. All other authors have reported that they have no relationships relevant to the content of this paper to disclose.
IRB Information
The study protocol was approved by the institutional review boards of the National Hospital Organization Kyoto Medical Center and Ijinkai Takeda General Hospital. Reference numbers were 10-058, 14-033.
Data Availability
The deidentified participant data will not be shared.
Supplementary Files
Please find supplementary file(s);
http://dx.doi.org/10.1253/circj.CJ-20-0567
References
- 1.
Chugh Sumeet S, Havmoeller R, Narayanan K, Singh D, Rienstra M, Benjamin Emelia J, et al. Worldwide epidemiology of atrial fibrillation. Circulation 2014; 129: 837–847.
- 2.
Wijesurendra RS, Casadei B. Mechanisms of atrial fibrillation. Heart 2019; 105: 1860–1867.
- 3.
Gopinathannair R, Etheridge SP, Marchlinski FE, Spinale FG, Lakkireddy D, Olshansky B. Arrhythmia-induced cardiomyopathies: Mechanisms, recognition, and management. J Am Coll Cardiol 2015; 66: 1714–1728.
- 4.
Steinberg BA, Kim S, Thomas L, Fonarow GC, Gersh BJ, Holmqvist F, et al. Increased heart atrial rate is associated with higher mortality in patients with atrial fibrillation (AF): Results from the Outcomes Registry for BEtter Informated Treatment of AF (ORBIT-AF). J Am Heart Assoc 2015; 4: e002031.
- 5.
Andrade JG, Roy D, Wyse DG, Tardif JC, Talajic M, Leduc H, et al. Heart rate and adverse outcomes in patients with atrial fibrillation: A combined AFFIRM and AF-CHF substudy. Heart Rhythm 2016; 13: 54–61.
- 6.
Li SJ, Sartipy U, Lund LH, Dahlstrom U, Adiels M, Petzold M, et al. Prognostic significance of resting heart rate and use of beta-blockers in atrial fibrillation and sinus rhythm in patients with heart failure and reduced ejection fraction: Findings From the Swedish Heart Failure Registry. Circ Heart Fail 2015; 8: 871–879.
- 7.
Cullington D, Goode KM, Zhang J, Cleland JG, Clark AL. Is heart rate important for patients with heart failure in atrial fibrillation? JACC Heart Failure 2014; 2: 213–220.
- 8.
Docherty KF, Shen L, Castagno D, Petrie MC, Abraham WT, Bohm M, et al. Relationship between heart rate and outcomes in patients in sinus rhythm or atrial fibrillation with heart failure and reduced ejection fraction. Eur J Heart Fail 2019; 22: 528–538.
- 9.
Sartipy U, Savarese G, Dahlström U, Fu M, Lund LH. Association of heart rate with mortality in sinus rhythm and atrial fibrillation in heart failure with preserved ejection fraction. Eur J Heart Fail 2019; 21: 471–479.
- 10.
Van Gelder IC, Groenveld HF, Crijns HJ, Tuininga YS, Tijssen JG, Alings AM, et al. Lenient versus strict rate control in patients with atrial fibrillation. N Engl J Med 2010; 362: 1363–1373.
- 11.
Akao M, Chun YH, Wada H, Esato M, Hashimoto T, Abe M, et al. Current status of clinical background of patients with atrial fibrillation in a community-based survey: The Fushimi AF Registry. J Cardiol 2013; 61: 260–266.
- 12.
Akao M, Chun YH, Esato M, Abe M, Tsuji H, Wada H, et al. Inappropriate use of oral anticoagulants for patients with atrial fibrillation. Circ J 2014; 78: 2166–2172.
- 13.
Takabayashi K, Hamatani Y, Yamashita Y, Takagi D, Unoki T, Ishii M, et al. Incidence of stroke or systemic embolism in paroxysmal versus sustained atrial fibrillation: The Fushimi Atrial Fibrillation Registry. Stroke 2015; 46: 3354–3361.
- 14.
Ogawa H, An Y, Ikeda S, Aono Y, Doi K, Ishii M, et al. Progression from paroxysmal to sustained atrial fibrillation is associated with increased adverse events. Stroke 2018; 49: 2301–2308.
- 15.
Kirchhof P, Benussi S, Kotecha D, Ahlsson A, Atar D, Casadei B, et al. 2016 ESC Guidelines for the management of atrial fibrillation developed in collaboration with EACTS. Eur Heart J 2016; 37: 2893–2962.
- 16.
An Y, Ogawa H, Yamashita Y, Ishii M, Iguchi M, Masunaga N, et al. Causes of death in Japanese patients with atrial fibrillation: The Fushimi Atrial Fibrillation Registry. Eur Heart J Qual Care Clin Outcomes 2019; 5: 35–42.
- 17.
Iguchi M, Tezuka Y, Ogawa H, Hamatani Y, Takagi D, An Y, et al. Incidence and risk factors of stroke or systemic embolism in patients with atrial fibrillation and heart failure: The Fushimi AF Registry. Circ J 2018; 82: 1327–1335.
- 18.
Kanda Y. Investigation of the freely available easy-to-use software ‘EZR’ for medical statistics. Bone Marrow Transplant 2013; 48: 452–458.
- 19.
An Y, Ogawa H, Esato M, Ishii M, Iguchi M, Masunaga N, et al. Age-dependent prognostic impact of paroxysmal versus sustained atrial fibrillation on the incidence of cardiac death and heart failure hospitalization (the Fushimi AF Registry). Am J Cardiol 2019; 124: 1420–1429.
- 20.
Steinberg BA, Hellkamp AS, Lokhnygina Y, Patel MR, Breithardt G, Hankey GJ, et al. Higher risk of death and stroke in patients with persistent vs. paroxysmal atrial fibrillation: Results from the ROCKET-AF Trial. Eur Heart J 2014; 36: 288–296.
- 21.
Heist EK, Mansour M, Ruskin JN. Rate control in atrial fibrillation: Targets, methods, resynchronization considerations. Circulation 2011; 124: 2746–2755.
- 22.
Anselmino M, Scarsoglio S, Camporeale C, Saglietto A, Gaita F, Ridolfi L. Rate control management of atrial fibrillation: May a mathematical model suggest an ideal heart rate? PLoS One 2015; 10: e0119868.
- 23.
Van Gelder IC, Rienstra M, Crijns HJGM, Olshansky B. Rate control in atrial fibrillation. Lancet 2016; 388: 818–828.
- 24.
Pokorney SD, Lopes RD. Atrial fibrillation: What do we know about screening and what do we not know about treatment? Heart 2019; 105: 817–819.
- 25.
Groenveld HF, Tijssen JG, Crijns HJ, Van den Berg MP, Hillege HL, Alings M, et al. Rate control efficacy in permanent atrial fibrillation: Successful and failed strict rate control against a background of lenient rate control: Data from RACE II (Rate Control Efficacy in Permanent Atrial Fibrillation). J Am Coll Cardiol 2013; 61: 741–748.
- 26.
Laskey WK, Alomari I, Cox M, Schulte PJ, Zhao X, Hernandez AF, et al. Heart rate at hospital discharge in patients with heart failure is associated with mortality and rehospitalization. Journal of the American Heart Association 2015; 4: e001626.
- 27.
Sarkar S, Koehler J, Crossley GH, Tang WH, Abraham WT, Warman EN, et al. Burden of atrial fibrillation and poor rate control detected by continuous monitoring and the risk for heart failure hospitalization. Am Heart J 2012; 164: 616–624.
- 28.
Chen LY, Chung MK, Allen LA, Ezekowitz M, Furie KL, McCabe P, et al. Atrial fibrillation burden: Moving beyond atrial fibrillation as a binary entity: A scientific statement from the American Heart Association. Circulation 2018; 137: e623–e644.
- 29.
Yamashita T, Murakawa Y, Sezaki K, Inoue M, Hayami N, Shuzui Y, et al. Circadian variation of paroxysmal atrial fibrillation. Circulation 1997; 96: 1537–1541.

