Abstract
Background:
In Japan there is no consensus on how to efficiently measure quality indicators (QIs), defined as a standard of care, for acute ischemic stroke (AIS). Using information from a health insurance claims database and electronic medical records, we evaluated the feasibility and validity of measuring QIs for AIS patients who received intravenous recombinant tissue plasminogen activator (IV rt-PA) or endovascular therapy (EVT).
Methods and Results:
AIS patients receiving rt-PA or EVT between 2013 and 2015 were identified. We selected 17 AIS QI measures for primary stroke centers (PSCs) and 8 for comprehensive stroke centers (CSCs). Defined QIs were calculated for each hospital and then averaged. In total, the data of 8,206 patients (rt-PA 83.7%, EVT 34.9%) from 172 hospitals were obtained. Median National Institute of Health Stroke Scale score at admission was 14, and 37.7% of the patients were functionally independent at discharge. All target QIs were successfully measured with fewer missing values, and the accuracy of preset data was about 90%. Adherence rates were low (<50%) in 5 QI measures among PSCs, including door-to-needle time ≤1 h, and in 1 QI measure among CSCs (door-to-brain and vascular imaging time ≤30 min).
Conclusions:
Measuring QIs for AIS by this novel approach was feasible and reliable in the provision of a national benchmark.
Stroke is the 4th leading cause of death, and a leading cause of disability, in Japan, but there is no national consensus on how best to measure quality indicators (QIs) of acute ischemic stroke (AIS). In the USA, several healthcare organizations have undertaken initiatives aimed at measuring and improving the quality of acute stroke care. A QI can be defined as a standard of care for all appropriate patients, and must be developed in a standardized, evidence-based way.1,2
In 2000, the American College of Cardiology/American Heart Association (ACC/AHA) published a report on the QIs of care for cardiovascular disease and stroke patients.1
The Brain Attack Coalition published guidelines for the certification of primary stroke centers (PSCs) and comprehensive stroke centers (CSCs).3,4
PSCs were developed to provide optimal facilities for administration of intravenous recombinant tissue plasminogen activator (IV rt-PA) infusions, and CSCs were developed to provide more intensive stroke care including endovascular and neurosurgical treatments. The Joint Commission began developing performance measures for the certification of PSCs and CSCs in 2003 and 2011, respectively.5,6
Editorial p ????
In Japan, certification of PSCs has just begun, leaving the gap between clinical evidence and clinical practice largely unexplored. The Nationwide survey of Acute Stroke care capacity for Proper dEsignation of Comprehensive stroke cenTer in Japan (J-ASPECT) study was the first nationwide survey of the real-world settings of acute stroke care and neurosurgical practices, using data obtained from Diagnosis Procedure Combination (DPC)-based payment system. The J-ASPECT study group has analyzed the DPC database to gain new clinical insights, and details of the J-ASPECT study are reported elsewhere.7,8
We launched the Close The Gap-Stroke (CTGS) initiative, a nationwide quality improvement initiative to develop QIs for both PSCs and CSCs, taking into account the unique aspects of stroke care in Japan. The result was the development of 17 measures representing QIs for PSCs and 12 for CSCs (Supplementary Table 1).9
Because the DPC database lacks critical information to monitor the developed QIs, a novel approach is necessary for continuous measurement of the developed QIs while at the same time decreasing the burden and cost in clinical practice. To this end, we developed a novel method for measuring the quality of stroke care by combining information from a health insurance claims database and electronic medical records (EMRs). As a pilot CTGS QI project, the feasibility and reliability of the developed indicators were tested in a specific population of AIS patients who received IV rt-PA or endovascular therapy (EVT).
Methods
Participation in the J-ASPECT study was voluntary and undertaken in collaboration with the Japan Neurosurgical Society and Japan Stroke Society.
DPC Database
The DPC database is a mixed-case patient classification system that was launched in 2002 by the Japanese Ministry of Health, Labor and Welfare and is linked with each hospital’s financing system. The DPC database contains clinical summaries that contain information on diagnoses (principal diagnoses, comorbidities at admission, and complications after admission) as well as the type of procedure and charge for the procedure (e.g., surgeries coded, daily records of drug administration and devices used).10
The main diagnosis, comorbidities and recorded complications are coded using the International Classification of Disease and Related Health Problems 10th Revision (ICD-10) codes. By 2015, the DPC system had been adopted by an estimated 1,580 acute care hospitals, representing approximately half of all Japanese hospital beds and encompassing a wide variety of centers. To maximize the accuracy of the DPC data, the responsible physicians are required to personally record the information.11
The high validity of diagnosis and procedure coding in this dataset has been reported by previous studies.8,12
CTGS Quality Indicators
The details of the CTGS QIs have been published previously but, in brief, 17 QIs for PSCs were intended to reflect basic stroke care, and the 12 QIs for CSCs were developed for advanced stroke care (Supplementary Table 1).9
The QIs relevant to AIS and transient ischemic attack (TIA) were selected in this study. The selected PSC QIs comprised: documentation of initial severity measure (PSC 1), diagnosis (PSC 2–4), coordination of care (PSC 5), acute medication (PSC 6–8), initiation of secondary prevention (PSC 9–12), prevention of complications (PSC 13,14), rehabilitation (PSC 15), and patient education (PSC 16, 17). The selected CSC QIs comprised: diagnosis (CSC 1), intravenous thrombolysis/EVT (CSC 2–7) and diagnostic angiography (CSC 12). Regarding safety measures, symptomatic intracranial hemorrhage (CSC 6) and stroke or death within 24 h of diagnostic angiography (CSC12) were defined. For those original measurements with continuous variables (CSC 1 and 5), the time window was set according to QIs for EVT reported previously.13
Our method for developing these QIs was adapted from the RANDUniversity of California, Los Angeles Appropriateness Method (modified Delphi method).14
In this study, QIs related to hemorrhagic stroke (subarachnoid hemorrhage and intracranial hemorrhage) were excluded. The adherence rate was calculated for each QI as the percentage of patients who fulfilled the defined criteria among those eligible. Patients were eligible for QIs if they met the criteria described in the denominator, and they were considered to have fulfilled the QI if they received the care processes stated in the numerator. When necessary information was unavailable (i.e., either missing or coded as “unknown” in the dataset), we excluded the patients from the denominator of each QI and included it as a missing value. To compare each developed QI, adherence rates were divided into 3 groups for the sake of convenience: high (≥75%), intermediate (75–50%), or low (<50%).9,15,16
CTGS QI Measurement Tool
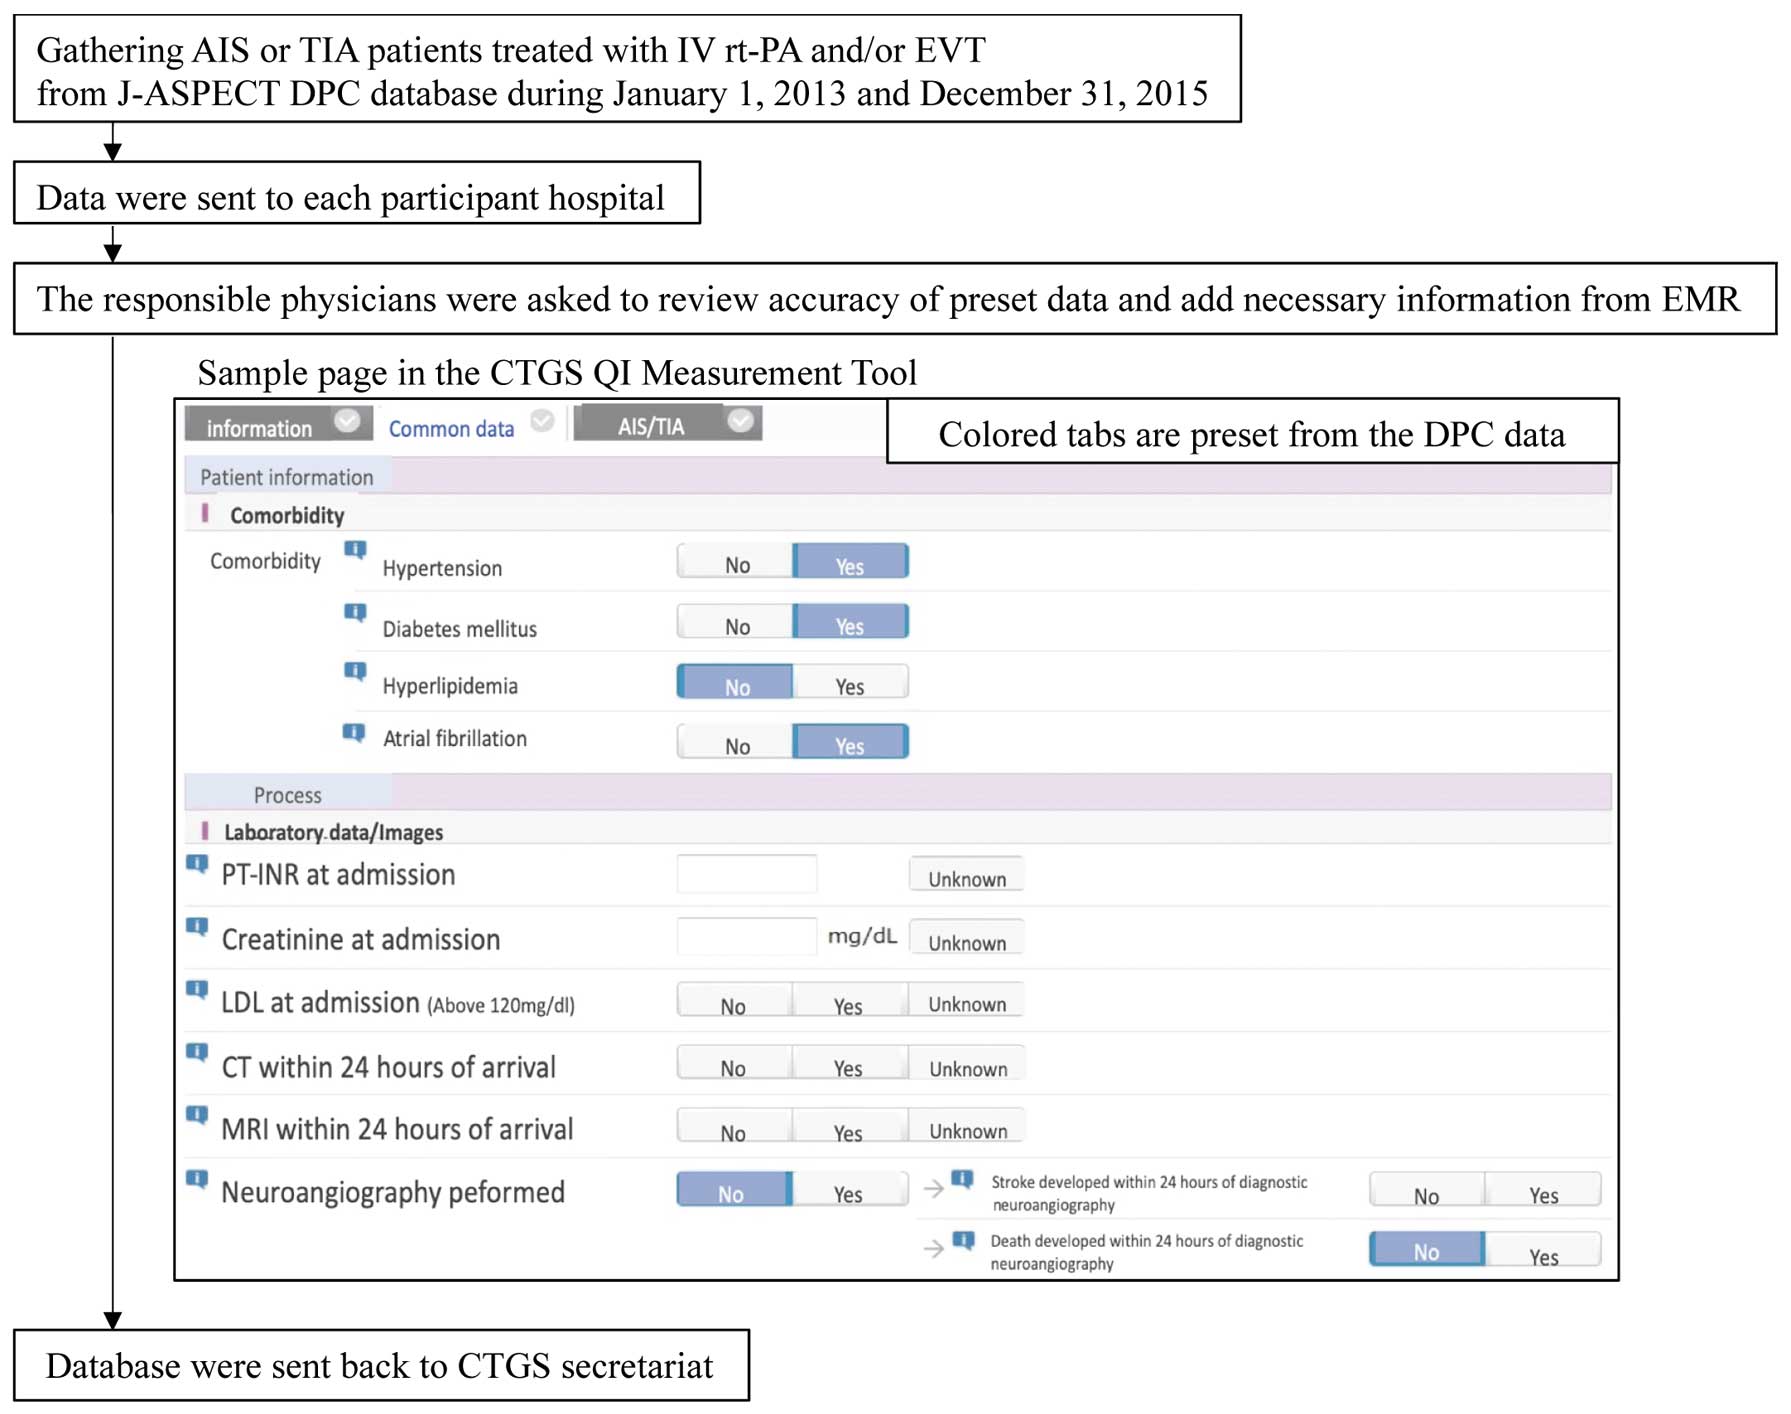
The CTGS QI Measurement Tool was developed to facilitate the efficient measurement of QIs. The target patients were identified from the DPC database according to ICD-10 codes. To reduce the burden on participating hospitals, 60% of the data for calculating the QIs was obtained from the DPC database and preset in the CTGS QI Measurement Tool (Table 1). The Tool was then sent to the participating hospitals, and the responsible physicians or health information managers were asked to review the accuracy of the preset data and add further information (including timings and National Institute of Health Stroke Scale [NIHSS] scores) from the EMR (Figure 1). These processes also acted as a validation study for the DPC database. We used physicians’ corrected data as the reference standard to evaluate the validity of the DPC data. The proportions of correctly matched measurements (accuracy), as well as the sensitivity/specificity and positive/negative predictive values (PPV/NPV) for the preset DPC data, were calculated. To evaluate the efficiency of the CTGS QI Measurement Tool, we asked 3 neurosurgical residents to apply the Tool to 6 cases using EMRs with and without preset DPC data, and then compared the time (in seconds) required to complete this task.
Table 1.
Relevant Preset Information From the Diagnosis Procedure Combination (DPC) Database
| Denominator (20/25) |
Numerator (10/25) |
Patients with any type of stroke (I60.1–9*, I61.0–9*, I63.0–9*)
or TIA (G45.0–9*) |
PSC1,3,5,
13,14,15,17 |
IV rt-PA performed |
PSC6, CSC3 |
| Patients with ischemic stroke (I63.0–9*) or TIA (G45.0–9*) |
PSC4,8 |
Antiplatelet therapy within 48 h of stroke
onset |
PSC8 |
| Patients with ischemic stroke (I63.0–9*) |
PSC7 |
Antiplatelets prescribed at discharge |
PSC9 |
Ischemic stroke (I63.0–9*) or TIA (G45.0–9*) patients without
atrial fibrillation (I48.0–9*) |
PSC9 |
Anticoagulation prescribed at discharge |
PSC10 |
Ischemic stroke (I63.0–9*) or TIA (G45.0–9*) patients with atrial
fibrillation (I48.0–9*) |
PSC10 |
Statin prescribed at discharge |
PSC11 |
Ischemic stroke (I63.0–9*) or TIA (G45.0–9*) patients with
dyslipidemia (E78.0–9*) |
PSC11 |
Antihypertensive agents prescribed at
discharge |
PSC12 |
Patients with any type of stroke (I60.1–9*, I61.0–9*, I63.0–9*)
or TIA (G45.0–9*) with hypertension (I10–15*) |
PSC12 |
Foot-pumping for DVT performed within
2 days of arrival |
PSC13 |
Patients with any type of stroke (I60.1–9*, I61.0–9*, I63.0–9*)
or TIA (G45.0–9*) with smoking |
PSC16 |
Physiotherapy or occupational therapy
performed within 2 days of arrival |
PSC15 |
| Patients with ischemic stroke (I63.0–9*) who underwent EVT |
CSC4,5 |
EVT performed |
CSC2 |
Patients with ischemic stroke (I63.0–9*) who underwent IV
rt-PA or EVT |
CSC6,7 |
|
|
Patients with any type of stroke (I60.1–9*, I61.0–9*, I63.0–9*)
who underwent diagnostic neuroangiography |
CSC12 |
|
|
DVT, deep vein thrombosis; EVT, endovascular therapy; IV rt-PA, intravenous recombinant tissue plasminogen activator; mRS, modified Rankin Scale; TIA, transient ischemic attack. Except for those measurements shown above, patients with diabetes mellitus, onset-to-door time (within 3 days, 4–7 days, 8 days and later, asymptomatic, uncertain) and mRS at discharge are preset from the DPC database. *The ICD-10 code collected from the DPC database. Data on the drugs or medical devices shown below were collected from the DPC database. EVT: Merci Retriever (Stryker, Kalamazoo, MI, USA), Penumbra system (Penumbra, Alameda, CA, USA), Solitaire FR (Medtronic Minneapolis, MN, USA), Trevo ProVue (Stryker Neurovascular, Kalamazoo, MI, USA). Antiplatelet drugs: aspirin, clopidogrel sulfate, sarpogrelate hydrochloride, cilostazol, ticlopidine hydrochloride, prasugrel hydrochloride, ticagrelor ozagrel sodium. Anticoagulants: warfarin potassium, apixaban, edoxaban tosilate hydrate, rivaroxaban, dabigatran etexilate methanesulfonate. Antihypertensive agents: angiotensin-converting enzyme inhibitor, angiotensin-receptor blocker, anti-renin-angiotensin system agent, calcium-channel blocker, β-blocker, α,β-blocker, α-blocker, potassium-sparing diuretic, thiazide and thiazide-like diuretic, loop diuretic.
Details about patients admitted for AIS (ICD-10 codes: I63.0–I63.9) or TIA (G45) were acquired through retrospective identification using the ICD-10 codes. Patients who received IV rt-PA and/or EVT between January 1, 2013 and December 31, 2015 were included in the study. Patients aged ≤18 years on admission were excluded.
Ethics Statement
This study was approved by the Kyushu University Institutional Review Board, which waived the requirement for informed consent from the participants.
Statistical Analysis
All continuous variables are presented as mean±standard deviation or, for variables with skewed distribution, as median (interquartile range: IQR). Non-continuous and categorical variables are presented as frequencies or percentages. The adherence to each QI was calculated for each hospital and then averaged. The Pearson χ2
(hospital characteristics) and Wilcoxon rank-sum tests (time intervals) on SAS 9.4 (SAS Institute, Cary, NC, USA) and STATA 14 (Stata Corp, College Station, TX, USA) were used for all analyses. All reported P values were two-tailed, and P<0.05 was considered statistically significant.
Results
We found 15,155 eligible patients admitted to 501 hospitals engaged in the J-ASPECT study (Figure 2). Among them, 250 hospitals agreed to participate in this study. Hospitals that provided incomplete medical history data or received fewer than 10 AIS patients treated with IV rt-PA and/or EVT were excluded. The final sample consisted of 8,206 AIS admissions to 172 hospitals. The characteristics of participants included in this study are shown in
Table 2A. Of those patients who received rt-PA or EVT (83.7 and 34.9%, respectively), functional independence (defined as a modified Rankin Scale [mRS] score of 0–2) at discharge was achieved in 37.7%. In approximately 60% of the patients, 90-day mRS scores were documented and 46.2% of these patients were functionally independent at that time point. With regards to the characteristics of the participating hospitals (Table 2B), there were no geographic differences, but academic hospitals with more beds and case volumes were more likely to join this study. In the final sample, 17.4% were academic hospitals, and the median bed number was 427 (IQR: 277–619). The median number of eligible patients in each hospital was 35 (IQR: 19–63).

Table 2.
(A) Characteristics of Eligible Patients, (B) Characteristics of Hospitals in This Study
| (A) |
|
|
|
|
|
|
| Total number |
8,206 |
|
|
|
|
|
| Age, median (IQR), years |
76 (68–83) |
|
|
|
|
|
| Male, n (%) |
4,745 (57.8) |
|
|
|
|
|
| Comorbidity, n (%) |
|
|
|
|
|
| Hypertension |
4,283 (52.2) |
|
|
|
|
|
| Diabetes mellitus |
1,543 (18.8) |
|
|
|
|
|
| Hyperlipidemia |
1,778 (21.7) |
|
|
|
|
|
| Atrial Fibrillation |
3,371 (41.1) |
|
|
|
|
|
| Current smoking |
1,209 (16.6) |
|
|
|
|
|
| NIHSS score at admission, median (IQR), n |
14 (7–21) |
|
|
|
|
|
| Treatment, n (%) |
|
|
|
|
|
| IV rt-PA |
6,866 (83.7) |
|
|
|
|
|
| EVT |
2,863 (34.9) |
|
|
|
|
|
| IV rt-PA and EVT |
1,523 (18.6) |
|
|
|
|
|
| Independence,* n (%) |
|
|
|
|
|
| At discharge (n=8,148) |
3,074 (37.7) |
|
|
|
|
|
| At 90 days (n=4,887) |
2,260 (46.2) |
|
|
|
|
|
| (B) |
|
|
|
|
|
|
| Hospital |
Participant |
Nonparticipant |
P value |
Final sample |
Excluded hospitals |
P value |
| n |
250 |
308 |
|
172 |
78 |
|
| Location, % |
| Metropolitan |
88.6 |
85.7 |
0.3098 |
90.5 |
84.4 |
0.1613 |
| Micropolitan |
11.4 |
14.3 |
9.5 |
15.6 |
| Urban |
70.3 |
66.6 |
0.3486 |
71.0 |
68.8 |
0.7292 |
| Rural |
29.7 |
33.4 |
29.0 |
31.2 |
| Hospital type, % |
| Academic |
19.6 |
8.8 |
0.0002** |
17.4 |
24.4 |
0.2016 |
| No, of beds, % |
|
|
0.0284** |
|
|
0.2475 |
| ≤99 |
2.4 |
2.3 |
|
3.5 |
0.0 |
|
| 100–499 |
56.0 |
66.9 |
|
55.2 |
57.7 |
|
| ≥500 |
41.6 |
30.8 |
|
41.3 |
42.3 |
|
| Annual stroke discharge, % |
|
|
<0.0001** |
|
|
<0.0001** |
| ≤100 |
3.6 |
27.0 |
|
0.0 |
11.5 |
|
| 101–300 |
46.4 |
46.7 |
|
36.1 |
69.2 |
|
| ≥301 |
50.0 |
26.3 |
|
64.0 |
19.2 |
|
(A) *Independence defined as mRS score 0–2. IQR, interquartile range; NIHSS score, National Institute of Health Stroke Scale score. Other abbreviations as in Table 1. (B) Significance assessed by the Pearson χ2 test. **Significant differences are indicated.
Of the 17 PSC QIs, adherence rates were high in 7, intermediate in 5, and low in 5 measures (Table 3A). Low adherence rates were seen for door-to-needle (DTN) time within 1 h, number of antiplatelet medications administered within 48 h, discharge on antiplatelet medication, discharge on statin, and deep venous thrombosis (DVT) prophylaxis. Of the CSC QIs, the median door-to-multimodal computed tomography (CT) or magnetic resonance angiography (door-to-brain and vascular) time and the door-to-puncture (DTP) time were 33 and 105 min, respectively, and the adherence rates were 46.2 and 72.3%, respectively (Table 3B,C). Over 65.5% of patients received IV rt-PA prior to EVT. TICI grade 2b or 3 recanalization was achieved in 72.9% of eligible patients, and rates of all safety measures were lower than 8%. There was great variability across hospitals for the QIs, excepting severity (PSC 1), diagnosis (PSC 3,4), and safety measures (CSC 6,12;
Supplementary File).
Table 3.
Results for the Close The Gap-Stroke (CTGS) Quality Indicators (QIs)
| (A) QIs for PSCs |
Adherence rate, % |
Missing
values, % |
| Average |
Each hospital |
| Median |
IQR |
| 1 |
NIHSS documentation (n=8,168) |
91.9 |
97.0 |
87.8–100 |
0.5 |
| 2 |
CT/MRI ≤25 min (n=7,274) |
81.3 |
86.5 |
70.0–94.0 |
4.9 |
| 3 |
CT/MRI ≤24 h (n=8,164) |
99.1 |
100.0 |
99.0–100 |
0.5 |
| 4 |
Extracranial vascular imaging (n=7,372) |
90.1 |
95.3 |
82.5–100 |
0.3 |
| 5 |
Stroke unit (n=8,147) |
57.3 |
16.6 |
0–98.8 |
0.7 |
| 6 |
rt-PA administration (n=7,347) |
89.5 |
92.0 |
85.1–100 |
2.0 |
| 7 |
rt-PA ≤1 h (n=6,505) |
36.5 |
28.1 |
12.5–47.4 |
4.2 |
| 8 |
Antiplatelet ≤48 h (n=8,006) |
34.5 |
31.3 |
0.25–41.5 |
1.2 |
| 9 |
Discharge on antiplatelet (n=4,343) |
48.8 |
50.0 |
34.8–62.5 |
0.0 |
| 10 |
Discharge on anticoagulation (n=3,054) |
75.8 |
83.3 |
64.6–95.0 |
0.1 |
| 11 |
Discharge on statin (n=2,128) |
31.2 |
25.0 |
10.9–43.8 |
4.2 |
| 12 |
Discharge on antihypertensive (n=3,934) |
53.6 |
54.5 |
39.5–68.1 |
0.1 |
| 13 |
DVT prophylaxis (n=8,089) |
35.7 |
26.6 |
7.0–57.1 |
0.2 |
| 14 |
Early rehabilitation (n=8,089) |
58.1 |
57.5 |
32.1–77.7 |
0.2 |
| 15 |
Dysphagia screening (n=7,362) |
76.3 |
85.5 |
54.1–100 |
0.6 |
| 16 |
Smoking cessation (n=1,119) |
58.1 |
66.7 |
0–100 |
0.2 |
| 17 |
Stroke education (n=7,315) |
70.9 |
89.7 |
21.5–100 |
1.2 |
| (B) QIs for CSCs |
Adherence rate, % |
Missing
values, % |
| Average |
Each hospital |
| Median |
IQR |
| 1 |
Door-to-brain and vascular imaging time ≤30 min (n=5,898) |
46.2 |
36.7 |
18.3–66.9 |
24.5 |
| 2 |
Proper endovascular recanalization (n=3,115) |
86.2 |
95.5 |
75.4–100 |
2.2 |
| 3 |
rt-PA before endovascular recanalization (n=2,224) |
65.5 |
66.7 |
56.7–82.9 |
2.4 |
| 4 |
TICI grade 2b/3 (n=2,762) |
72.9 |
72.6 |
60.0–83.1 |
1.2 |
| 5 |
DTP ≤140 min (n=2,403) |
72.3 |
66.7 |
36.8–85.9 |
5.6 |
| 6 |
Hemorrhagic complication (n=7,999) |
7.7 |
5.5 |
0–10.9 |
2.5 |
| 7 |
90-day mRS documentation (n=7,372) |
56.7 |
62.0 |
35.4–90.7 |
0.5 |
| 12 |
Complication after angiography (n=743) |
6.5 |
0 |
0–0 |
0.4 |
| (C) QIs for CSCs |
Patient level |
|
|
| Median |
IQR |
|
|
| 1 |
Door-to-brain and vascular imaging time, min |
33 |
20–59 |
|
|
| 5 |
DTP, min |
105 |
76–149 |
|
|
See the Methods section for definitions of QI adherence rate and missing values. Numbers shown in the title of each QI indicates the target population for it (denominator). DTI, door-to-image; DTN, door-to-needle; DTP, door-to-puncture; DVT, deep venous thrombosis; TICI, Thrombolysis in Cerebral Infarction. Other abbreviations as in Tables 1,2.
The frequency of missing values was high for CSC 1 and 5, and PSC 2, 7 and 11, which required collection of exact times or laboratory data from the EMRs, whereas the frequency of missing values for the remainder of the QIs was below 3% (Table 3).
As for the preset data from the DPC database, except for smoking resulting in accuracy of 56.7%, the accuracy was over 90% (Table 4). In addition, both sensitivity and specificity were over 90%, except for patients with hypertension. Here, the specificity was 88.2.
Table 4.
Results of the Validation Study
| Preset measurements from DPC database |
Accuracy |
Sensitivity |
Specificity |
PPV |
NPV |
| Comorbidities |
| Patients with hypertension |
93.1 |
98.8 |
88.2 |
87.8 |
98.8 |
| Patients with diabetes mellitus |
98.1 |
98.9 |
97.9 |
90.8 |
99.8 |
| Patients with dyslipidemia |
96.5 |
96.4 |
99.3 |
86.9 |
99.3 |
| Patients with atrial fibrillation |
96.4 |
92.0 |
94.7 |
92.0 |
99.5 |
| Patients with smoking |
56.7 |
NA |
| Treatments and procedures |
| IV rt-PA |
99.5 |
99.6 |
98.9 |
99.8 |
97.8 |
| EVT |
98.6 |
99.3 |
99.2 |
98.5 |
99.6 |
| IV rt-PA and EVT |
98.7 |
98.7 |
98.8 |
97.7 |
99.3 |
| Diagnostic neuroangiography performed |
94.5 |
97.5 |
94.1 |
69.4 |
99.6 |
| Patients underwent carotid ultrasonography |
96.9 |
98.8 |
95.0 |
98.7 |
98.7 |
| Antiplatelet therapy performed in the hospital |
98.4 |
97.3 |
99.2 |
98.0 |
98.0 |
| Antiplatelet prescribed at discharge |
97.1 |
99.4 |
96.2 |
90.5 |
99.8 |
| Anticoagulation prescribed at discharge |
94.7 |
99.3 |
91.5 |
89.3 |
99.5 |
| Statin prescribed at discharge |
98.3 |
99.4 |
98.1 |
92.4 |
99.9 |
| Antihypertensive agents prescribed at discharge |
95.7 |
98.8 |
94.0 |
89.6 |
99.3 |
| DVT prophylaxis performed |
96.1 |
90.7 |
99.3 |
98.8 |
94.6 |
| PT or OT performed within 2 days of arrival |
98.1 |
99.9 |
96.0 |
96.9 |
99.8 |
| Complications and outcome |
| Death developed within 24 h of diagnostic neuroangiography |
99.2 |
100.0 |
99.9 |
23.1 |
100.0 |
| Onset-to-door time of ischemic stroke |
99.0 |
NA |
| mRS at discharge |
89.8 |
NA |
Values expressed as percentages. NA, Not assessed because measurements with >2 items required selection from the form in the Tool (e.g., smoking: non-smoker, current smoker, unknown; onset-to-door time of ischemic stroke: within 3 days, 4–7 days, 8 days or more, asymptomatic, unknown; mRS: 0, 1, 2, 3, 4, 5, 6, unknown). PPV/NPV, positive/negative predictive values; PT or OT, physiotherapy or occupational therapy. Other abbreviations as in Table 1.
With regard to the efficiency of the CTGS QI Measurement Tool, the average time required to complete the form was shorter when the DPC data was preset (396±117 vs. 1,016±281s; P<0.05).
Discussion
Our study demonstrated the feasibility and validity of measuring QIs for AIS patients who received IV rt-PA or EVT, by combining information from a health insurance claims database and EMRs. All of the target QIs were successfully measured.
Vascular imaging should be performed at the same time as CT/magnetic resonance imaging (MRI) to facilitate decisions regarding the administration of IV rt-PA; in our study, the QI for brain and vascular imaging demonstrated low adherence, while that for CT/MRI had high adherence. In Japan, the number of MRI scanners per population is high, and a post-marketing survey of IV rt-PA showed a high proportion of patients received initial CT screening with optional MRI prior to thrombolysis.17,18
Although this imaging strategy is feasible, it did result in an additional 30-min in-hospital delay in the administration of rt-PA.18
It is important to note that this study collected data on patients hospitalized between 2013 and 2015, so physicians did not fully recognize the importance of early imaging for patients with ischemic stroke arriving within 3.5–6 h of symptom onset. Newer trials use imaging selection in the extended time windows for EVT, regardless of onset-to-door time, and thus increasing efforts are being made to reduce DTN or DTP times worldwide.19,20
Previous research on improving in-hospital workflow has shown it can reduce in-hospital delays.21–23
We found higher adherence rates for diagnosis (PSC 2–4), but lower adherence rates for acute medication (PSC 7 and 8) and initiation of secondary prevention (PSC 9–12). Such differences in adherence rates might be explained by differences in healthcare policy, guidelines, and the clinical characteristics of patients in the studies. First, only patients who received IV rt-PA or EVT were included in this study. Because the use of antiplatelets in the first 24 h after the administration of IV rt-PA is not usually recommended, the observed low adherence rate for the ‘antiplatelets within 48 h’ QI in our study may be explained by patient selection. Second, argatroban, a selective thrombin inhibitor developed in Japan, is recommended to be given within 2 days of stroke onset in Japanese but not in European guidelines.24
Despite a lack of scientific evidence, the Japanese guidelines also describe the use of heparin in patients within 48 h of onset of AIS.
With regard to the QI on discharging patients on antiplatelet medication, it must be highlighted that adherence to this may be low if the responsible physicians chooses to prescribe anticoagulation for patients with suspected paroxysmal atrial fibrillation. The Japanese guidelines gave a weak recommendation (Grade C1) for dyslipidemia control in the prevention of recurrent cerebral infarction. Whether statins increase the risk of intracranial hemorrhage in patients with a previous stroke, and exactly when to start statins (immediately post-stroke or later), remain unclear.25
In addition, the high prevalence of cerebral hemorrhage in Asia might have affected the low adherence rate for statins.26
A recent systematic review and meta-analysis of 43 studies found that, in patients with previous AIS, statins were associated with a non-significant increase in intracranial hemorrhage, but simultaneously a significantly lower risk of recurrent AIS, death, and poor functional outcomes.27
Continuous QI measurement may contribute to promoting adherence to the guideline, but should be revised at regular intervals on publication of new evidence and feasibility of reliable measurement with a given collection method. Further examination of measuring these QIs in this system might be necessary in the future.
The reason for the high interquartile range and low median score for access to a stroke unit (SU) in this study remains uncertain. The SU signifies an acute stroke team with or without a designated stroke ward, and provides a constant and consistent range of acute stroke therapies. Until recently in Japan, however, the SU has not been officially certified, which may explain the relatively low recognition of the importance of organized stroke care in the SU. In line with this, relatively low adherence rates for early rehabilitation and dysphagia screening were observed in our study (57.6% and 77.2%, respectively). On the other hand, in Japan the stroke care unit (SCU), a ward with advanced intensive care for acute stroke patients, has been certified and implemented.24
Reimbursement of medical fees is given for treatment in the SCU, but not the SU, in Japan. These facts might explain the high interquartile range and low median score for access to a SU, although factors influencing access to SU care are poorly defined. A previous study from the German Stroke Register Study Group (ADSR) showed that ischemic stroke patients without disturbance of consciousness, an interval onset to admission time <3 h, and weekend admission were more likely to be directly admitted to a SU.28
Because SUs were officially certified in 2019 in Japan, further studies are necessary to identify factors associated with admission to SUs.
Furthermore, the much lower adherence rate of DVT prophylaxis deserves special discussion. Although DVT is considered to be rare in immobilized patients in Asia,29
Kawase et al have previously demonstrated a high incidence (16–45%) of (mostly asymptomatic) DVT among patients with a stroke in Japan, as diagnosed by ultrasonography.30
This suggests more active intervention may be necessary in the prophylaxis of DVT.
Because the CSC QIs in this study were calculated in patients admitted between January 1, 2013 and December 31, 2015, we compared these QIs with the report from the HERMES collaborators.31
We observed excellent results in patients achieving mTICI >2b or 3, and in patients with hemorrhagic complications after EVT (Table 3B). In randomized controlled endovascular trials, the proportion of patients independent (mRS score of 0–2) at 90 days ranged from 33% to 71%, with an overall aggregate rate of 46.0%.31–33
We included all patients with stroke due to occlusion in all vascular territories. Consequently, the rate of independence at 90 days for EVT-treated patients (38.9%) seemed to be acceptable in this study period.
Study Limitations
First, as only AIS patients receiving IV rt-PA and/or EVT were included, there is a possibility that patient selection might have introduced bias into our analyses. Because patients who were appropriate candidates for IV rt-PA and EVT but did not receive it were excluded from our study, our adherence results for some QIs, especially PSC 6 and CSC 2, could be artificially high. Second, there was also a selection bias in the participating hospitals. As 50% of the participating hospitals treated more than 300 stroke patients annually, and most of the participating hospitals were categorized as medium or large, the hospitals involved in our study may be considered ‘top-performing’ hospitals. Furthermore, hospitals actively working to improve stroke care were more likely to respond to a voluntary study such as ours. Third, there were some limitations in using the DPC database. Only 2 primary diagnoses and up to 4 comorbidities can be recorded in the DPC database and, even when comorbidities were recognized, some of them might not have been recorded when all 4 ‘slots’ for comorbidities were occupied.12
Fourth, we cannot exclude the possibility that the same patients may have been counted twice or more in the DPC database if readmitted or transferred to another hospital. Fifth, the DPC database was allowed to select “unknown” answer from multiple choices in a certain item (e.g., for the smoking category, ‘non-smoker,’ ‘current smoker,’ and ‘unknown’), so this may have affected the accuracy of the DPC database; for example, smoking cessation. The accuracy of the preset data from the DPC database may not affect final results of the measured QIs, because physicians generally change the preset DPC data based on the EMRs. This procedure, however, may increase the burden on responsible physicians to measure the defined QIs. Therefore, continuous effort is required to improve efficiency and collection of the defined QI.
Future Directions
The association between the adherence rate of each QI and outcome remains uncertain and requires further investigation. Recently, composite performance measures have become increasingly used when reporting on the quality of stroke care.34–36
Because the number of developed QIs in the CTGS initiatives is high, composite performance measures may reduce the information burden by distilling the available indicators into a simple summary. To develop a composite performance measure, weighting of each QI would need to account for their clinical importance or relationship with outcome. Because CSCs are not yet certified, the hospitals’ characteristics are mixed. The QIs for CSCs would act as quality controls among hospitals and would serve as the baseline for certification. We plan to conduct a cluster-randomized quality improvement trial, using QIs with low adherence and great variability, such as medication at discharge (PSC9-12) or DTN (PSC 7), randomizing hospitals to QI intervention plus indicator feedback vs. indicator feedback alone, to prove the effectiveness of QIs.
Conclusions
The CTGS program is the first nationwide quality improvement initiative in stroke and allows prospective evaluation of quality of acute stroke care in Japan. The DPC database contributed to evaluation of the QIs through efficient data collection at low cost and less administrative burden. This multifaceted quality improvement intervention is useful in promoting the optimal use of evidence-based interventions for the management of AIS and TIA.
Acknowledgments
We thank the J-ASPECT study collaborators as contributors to data collection (Supplementary Table 2).
Sources of Funding
This research was supported by the Japan Agency for Medical Research and Development, Grants-in-Aid from the Japanese Ministry of Health, Labor and Welfare under Grant No. JP19ek0210088. The funding sources had no role in the study design, data collection and analysis, manuscript preparation, or decision to publish.
Disclosures
Dr. Hashimoto reports speaker fees from Bristol-Myers Squibb, Byer Yakuhin, Daiichi-Sankyo and Pfizer. Dr. Sakai reports a research grant from Terumo; lecturer’s fees from Jimro, Otsuka, Johnson & Johnson, Medtronic, Stryker, and Medico’s Hirata; membership on the advisory boards for Medtronic and Jimro. Dr. Miyachi reports lecturer’s fees from Medtronic. Dr. Kitazono reports speaker fees from Bayer Yakuhin, and Daiichi-Sankyo, consulting fees from Chugai Pharmaceutical, and grant support from Takeda Pharmaceutical, Daiichi-Sankyo, Mitsubishi K.K. Tanabe Pharma, Eisai, Astellas Pharma, Chugai Pharmaceutical, and MSD. Dr. Miyamoto reports grants from Carl Zeiss Meditec, MIZUHO Corporation, Siemens Healthcare K.K., Philips Japan, Brain Lab, Otsuka Pharmaceutical, Chugai Pharmaceutical, Nihon Medi-Physics, Eisai, CSL Behring, Mitsubishi Tanabe Pharma, Pfizer, MSD, Sanofi, Medtronic Japan, Dai-ichi Sankyo, and Nihon Kohden. Dr. Minematsu reports personal fees from Bayer, Yakuhin, Otsuka Pharmaceutical, Boehringer-Ingelheim, AstraZeneca, Pfizer, Mitsubishi Tanabe Pharma Corporation, Japan Stryker, Daiichi-Sankyo, Astellas Pharma, Nippon Chemiphar, Fuji Film RI Pharma, CSL Behring, Medicos Hirata, EPS Corporation, HEALIOS K.K., and T-PEC Corporation, outside the submitted work. Dr. Iihara reports grant support from AstraZeneca, Otsuka Pharmaceutical, and Nihon Medi-Physics. The other authors report no conflicts of interest. Dr. Kitazono is a member of
Circulation Journal
’s Editorial Team.
IRB Information
Kyushu University Institutional Review Board (reference no. 29-271).
Supplementary Files
Please find supplementary file(s);
http://dx.doi.org/10.1253/circj.CJ-20-0639
References
- 1.
Quality of Care and Outcomes Research in CVD and Stroke Working Groups. Measuring and improving quality of care A report From the American Heart Association/American College of Cardiology First Scientific Forum on Assessment of Healthcare Quality in Cardiovascular Disease and Stroke Quality. Circulation 2000; 101: 1483–1493.
- 2.
Holloway RG, Vickrey BG, Benesch C, Hinchey JA, Bieber J. Development of performance measures for acute ischemic stroke. Stroke 2001; 32: 2058–2074.
- 3.
Alberts MJ, Hademenos G, Latchaw RE, Jagoda A, Marler JR, Mayberg MR, et al. Recommendations for the establishment of primary stroke centers for the Brain Attack Coalition. JAMA 2000; 283: 3102–3109.
- 4.
Alberts MJ, Latchaw RE, Selman WR, Shephard T, Hadley MN, Brass LM, et al. Recommendations for comprehensive stroke centers: A consensus statement from the Brain Attack Coalition. Stroke 2005; 36: 1597–1618.
- 5.
Adams R, Acker J, Alberts M, Andrews L, Atkinson R, Fenelon K, et al. Recommendations for improving the quality of care through stroke centers and systems: An examination of stroke center identification options. Stroke 2002; 33: e1–e7.
- 6.
Joint Commission. Performance measures for comprehensive stroke centers. https://www.jointcommission.org/performance_measures_for_comprehensive_stroke_centers/ (accessed July 31, 2019).
- 7.
Iihara K, Nishimura K, Kada A, Nakagawara J, Ogasawara K, Ono J, et al. Effects of comprehensive stroke care capabilities on in-hospital mortality of patients with ischemic and hemorrhagic stroke: J-ASPECT study. PLoS One 2014; 9: e96819.
- 8.
Kurogi R, Kada A, Nishimura K, Kamitani S, Nishimura A, Sayama T, et al. Effect of treatment modality on in-hospital outcome in patients with subarachnoid hemorrhage: A nationwide study in Japan (J-ASPECT Study). J Neurosurg 2018; 128: 1318–1326.
- 9.
Nishimura A, Nishimura K, Onozuka D, Matsuo R, Kada K, Kamitani S, et al. Development of quality indicators of stroke centers and feasibility of their measurement using a nationwide insurance claims database in Japan: J-ASPECT Study. Circ J 2019; 83: 2292–2302.
- 10.
Matsuda S, Fujimori K, Kuwabara K, Ishikawa KB, Fushimi K. Diagnosis procedure combination as an infrastructure for the clinical study. Asian Pacific J Dis Manag 2011; 5: 81–87.
- 11.
Suzuki S, Yasunaga H, Matsui H, Fushimi K, Yuki S, Yamasoba T. Cerebral infarction after intraarterial and intravenous chemoradiotherapy for head and neck cancer: A retrospective analysis using a Japanese inpatient database. Head Neck 2016; 38: 1354–1358.
- 12.
Yamana H, Moriwaki M, Horiguchi H, Kodan M. Validity of diagnoses, procedures, and laboratory data in Japanese administrative data. J Epidemiol 2017; 27: 476–482.
- 13.
Sacks D, Baxter B, Campbell BC V, Carpenter JS, Cognard C, Dippel D, et al. Multisociety consensus quality improvement revised consensus statement for endovascular therapy of acute ischemic stroke. J Vasc Interv Radiol 2018; 29: 441–453.
- 14.
Fitch K, Bernstein SJ, Aguilar MD, Burnand B, LaCalle JR, Lazaro P, et al. The RAND/UCLA appropriateness method user’s manual. Santa Monica, CA: RAND, 2001.
- 15.
Fonarow GC, Smith EE, Saver JL, Reeves MJ, Hernandez AF, Peterson ED, et al. Improving door-to-needle times in acute ischemic stroke: The design and rationale for the American Heart Association/American Stroke Association’s target: Stroke initiative. Stroke 2011; 42: 2983–2989.
- 16.
Fakhraldeen M, Segal E, de Champlain F. Effect of the use of ambulance-based thrombolysis on time to thrombolysis in acute ischemic stroke: A randomized clinical trial. Can J Emerg Med 2015; 17: 709–712.
- 17.
Toyoda K, Koga M, Naganuma M, Shiokawa Y, Nakagawara J, Furui E, et al. Routine use of intravenous low-dose recombinant tissue plasminogen activator in japanese patients: General outcomes and prognostic factors from the SAMURAI register. Stroke 2009; 40: 3591–3595.
- 18.
Uenaka T, Yoneda Y, Yamamoto S, Hara Y, Yamashita H. Brain imaging modality before systemic thrombolysis for ischemic stroke within three hours. Eur Neurol 2010; 64: 241–245.
- 19.
Albers GW, Marks MP, Kemp S, Christensen S, Tsai JP, Ortega-Gutierrez S, et al. Thrombectomy for stroke at 6 to 16 hours with selection by perfusion imaging. N Engl J Med 2018; 378: 708–718.
- 20.
Nogueira RG, Jadhav AP, Haussen DC, Bonafe A, Budzik RF, Bhuva P, et al. Thrombectomy 6 to 24 hours after stroke with a mismatch between deficit and infarct. N Engl J Med 2018; 378: 11–21.
- 21.
Olson DWM, Cox M, Constable M, Britz GW, Lin CB, Zimmer LO, et al. Development and initial testing of the stroke rapid-treatment readiness tool. J Neurosci Nurs 2014; 46: 267–273.
- 22.
Xian Y, Xu H, Lytle B, Blevins J, Peterson ED, Hernandez AF, et al. Use of strategies to improve door-to-needle times with tissue-type plasminogen activator in acute ischemic stroke in clinical practice: Findings from target: Stroke. Circ Cardiovasc Qual Outcomes 2017; 10: 1–8.
- 23.
American Heart Association. Target: Stroke Phase III door-to-device time key best practice strategies. https://www.heart.org/-/media/files/professional/quality-improvement/target-stroke/target-stroke-phase-iii/9-17-update/final-door-to-device-best-practice-one-pager.pdf?la=en (accessed October 31, 2019).
- 24.
Kern R, Nagayama M, Toyoda K, Steiner T, Hennerici MG, Shinohara Y. Comparison of the European and Japanese guidelines for the management of ischemic stroke. Cerebrovasc Dis 2013; 35: 402–418.
- 25.
Hosomi N, Nagai Y, Kohriyama T, Ohtsuki T, Aoki S, Nezu T, et al. The Japan Statin Treatment Against Recurrent Stroke (J-STARS): A multicenter, randomized, open-label, parallel-group study. EBioMedicine 2015; 2: 1071–1078.
- 26.
Ueshima H, Sekikawa A, Miura K, Turin TC, Takashima N, Kita Y, et al. Cardiovascular disease and risk factors in Asia: A selected review. Circulation 2011; 118: 2702–2709.
- 27.
Ziff OJ, Banerjee G, Ambler G, Werring DJ. Statins and the risk of intracerebral haemorrhage in patients with stroke: Systematic review and meta-analysis. J Neurol Neurosurg Psychiatry 2019; 90: 75–83.
- 28.
Heuschmann PU, Biegler MK, Busse O, Elsner S, Grau A, Hasenbein U, et al. Development and implementation of evidence-based indicators for measuring quality of acute stroke care: The Quality Indicator Board of the German Stroke Registers Study Group (ADSR). Stroke 2006; 37: 2573–2578.
- 29.
Keenan CR, White RH. The effects of race/ethnicity and sex on the risk of venous thromboembolism. Curr Opin Pulm Med 2007; 13: 377–383.
- 30.
Kawase K, Okazaki S, Toyoda K, Toratani N, Yoshimura S, Kawano H, et al. Sex difference in the prevalence of deep-vein thrombosis in Japanese patients with acute intracerebral hemorrhage. Cerebrovasc Dis 2009; 27: 313–319.
- 31.
Goyal M, Menon BK, Van Zwam WH, Dippel DWJ, Mitchell PJ, Demchuk AM, et al. Endovascular thrombectomy after large-vessel ischaemic stroke: A meta-analysis of individual patient data from five randomised trials. Lancet 2016; 387: 1723–1731.
- 32.
Lloyd M. A randomized trial of intraarterial treatment for acute ischemic stroke. N Engl J Med 2015; 372: 11–20.
- 33.
Campbell BCV, Mitchell PJ, Kleinig TJ, Dewey HM, Churilov L, Yassi N, et al. Endovascular therapy for ischemic stroke with perfusion-imaging selection. N Engl J Med 2015; 372: 1009–1018.
- 34.
Schwamm LH, Fonarow GC, Reeves MJ, Pan W, Frankel MR, Smith EE, et al. Get With the Guidelines-Stroke is associated with sustained improvement in care for patients hospitalized with acute stroke or transient ischemic attack. Circulation 2009; 119: 107–115.
- 35.
Peterson ED, DeLong ER, Masoudi FA, O’Brien SM, Peterson PN, Rumsfeld JS, et al. ACCF/AHA 2010 position statement on composite measures for healthcare performance assessment. Circulation 2010; 121: 1780–1791.
- 36.
Heidenreich PA, Zhao X, Hernandez AF, Schwamm LH, Smith E, Reeves M, et al. Impact of an expanded hospital recognition program for stroke quality of care. J Am Heart Assoc 2017; 6: e004278.
