Abstract
Background:
Recently, dynamic chest radiography (DCR) was developed to evaluate pulmonary function using a flat-panel detector (FPD), which can evaluate blood flow in the pulmonary artery without injection of contrast agents. This study investigated the ability of a FPD to measure physiological changes in blood flow and to detect pulmonary embolism (PE) in monkeys.
Methods and Results:
DCR was performed in 5 monkeys using a FPD. Regions of interest (ROI) were placed in both lung fields of the image, and maximum changes in pixel value (∆pixel value) in the ROI were measured during 1 electrocardiogram cardiac cycle. Next, a PE model was induced using a Swan-Ganz catheter and additional images were taken. The ∆pixel value of the lungs in normal and PE models were compared in both supine and standing positions. The lung ∆pixel value followed the same cycle as the monkey electrocardiogram. ∆pixel values in the upper lung field decreased in the standing as compared to the supine position. In the PE model, the ∆pixel value decreased in the area of pulmonary blood flow occlusion and increased in the contralateral lung as compared to the normal model (normal model 1.287±0.385, PE model occluded side 0.428±0.128, PE model non-occluded side 1.900±0.431).
Conclusions:
A FPD could detect postural changes in pulmonary blood flow and its reduction caused by pulmonary artery occlusion in a monkey model.
Pulmonary embolisms (PE) occur in 60–112 per 100,000 people and is lethal in 7–11% of cases.1
However, diagnosis of PE based only on clinical symptoms is difficult, because it can present with diverse symptoms, such as chest pain, shortness of breath, palpitations and malaise.2,3
Contrast-enhanced computed tomography (CT) is the standard examination to diagnose PE, with a reported sensitivity of 85% and specificity of 96%.4,5
However, contrast-enhanced CT is associated with the risk of allergy, renal dysfunction and radiation exposure.6,7
Additionally, contrast-enhanced CT is only performed at well-equipped medical facilities.
Recently, dynamic chest radiography (DCR) has been developed to evaluate pulmonary function.8–11
DCR can be performed in an additional 10 s during conventional chest radiography. Using this technology, it is possible to evaluate blood flow in the pulmonary artery and movement of both the lungs and heart based on changes in radiographic lung density, which is caused by relative changes in regional blood volume in the lungs. Moreover, additional advantages of DCR are its portability and accessibility in daily clinical settings. DCR was shown to detect respiratory changes, pulmonary circulation and decreases in pulmonary blood flow in normal lungs and in a porcine model of PE without the need for contrast agent injection.12
Previous studies suggested that this method might be able to diagnose PE more quickly and easily. In a previous study, DCR showed a decrease in radiographic lung density in areas of pulmonary blood flow occlusion compared to lung fields where pulmonary blood flow was not occluded.12
However, it is not clear whether the magnitude of the change in radiographic lung density reflects a change in pulmonary blood pressure or a change in the diameter of the pulmonary artery. In addition, it is not clear whether DCR can detect not only large changes in pulmonary circulation resulting from total occlusion of the pulmonary artery, but also small changes in pulmonary circulation resulting from physiological fluctuations. In contrast, distribution of blood flow in the lungs depends on the patient’s posture, with increased blood volume in the lower lung in the standing position and the dorsal side in the supine position, due to the effect of gravity. However, it is not clear whether changes in blood flow distribution can be observed as changes in radiographic lung density on DCRs.
Therefore, we conducted a basic experimental study using expandable and non-expandable tubes, along with an animal study using a monkey model of PE. The aim of this study was to address the main cause of changes in radiographic lung density during cardiac function, whether it is related to change in pulmonary blood pressure or change in pulmonary artery diameter, and to investigate whether DCR can measure physiological changes in blood flow and be used to detect complete occlusion of pulmonary blood flow in a monkey model.
Methods
Basic Experiment
The outline of the basic experimental setup is shown in
Figure 1. In this experiment, 2 different types of tubes were prepared. Tube #1, which was a pressure-resistant tube (pressure tube, PT06; Merit Medical Systems, South Jordan, UT, USA) composed of polycarbonate, with an outer diameter of 3.2 mm, inner diameter of 1.6 mm, length of 150 mm, and pressure-resistant up to 200 pounds per square inch, was connected to Tube #2, an elastic tube (artificial vessel; Polysis Co., Ltd., Hamamatsu, Shizuoka, Japan), composed of a water-soluble urethane base, outer diameter 3.3 mm, inner diameter 2.0 mm, length 100 mm; the proximal end of Tube #1 was connected to the pressure sensor module (blood pressure transducer, PL2503TSB; Edwards Lifesciences Corporation, Irvine, CA, USA) and a syringe, whereas the distal end of Tube #2 was closed. The pressure sensor module was connected to the patient monitor (Life Scope VS, BSM3562; Nihon Kohden Corp., Tokyo, Japan) to measure the internal pressure in the experimental tube system. The syringe, and Tubes #1 and #2 were filled with blood taken from a healthy volunteer, and the internal pressure was changed by manually operating the syringe. The internal pressure was changed from 0 to 50 mmHg and sequential radiographs of the tube were captured at the same time under the following imaging exposure conditions: 60 kV, 125 mA/pulse, 15 frames/s, source to image distance (SID)=1.2 m. Regions of interest (ROI) were set at each frame of the sequential radiographs, the average pixel value in the ROI in each frame was calculated, and the averaged pixel value over 25 frames was calculated. The ROI size in the longitudinal direction of the tube was 50 pixels (constant) and that in the cross-sectional direction was fit to the inner diameter of the tube, which was near the edge of the bright region of the radiographs.

The experimental protocol for this part of the study was approved by the institutional Animal Experiment and Use Committee of Shiga Medical University (approval number 16-157). The care and use of monkeys followed the standard operating procedures at Shiga Medical University, which addresses the housing, feeding, cleaning, veterinary care, environmental enrichment, and so on, according to “Standards relating to the Care and Keeping and Reducing Pain of Laboratory Animals, Ministry of Environment, Japan”, “Guide for the Care and Use of Laboratory Animals, 8th edition” and “IPS International Guidelines for the Acquisition, Care, and Breeding of Nonhuman Primates Second Edition”. Five monkeys (body weight 5–10 kg) were anesthetized and their ventilation was controlled using a mechanical ventilator (COMPOS X; Metran Co., Kawaguchi, Japan), which was set to provide a tidal volume of 100 mL at the rate of 20 breaths/min throughout the experiment. The PE model was constructed using a catheter procedure (Fogarty catheter, T - 080 - 5 F; Edwards Lifesciences) while confirming the position of the catheter tip under X-ray fluoroscopy (the intervention was performed by a cardiologist with 11 years of interventional cardiology experience). Vascular occlusion lasted for ~5 cardiac cycles and was reversible. In addition, 15 mL of iomeprol (Eisai Co., Ltd., Tokyo, Japan) was injected into the animals’ veins and a digital subtraction image was created to determine the area of occluded blood circulation. The study was performed with the monkeys fixed on a table that could be tilted by 90 degrees to the vertical position. Four monkeys were imaged in both supine and standing positions. One monkey was imaged in only the supine position due to circulatory problems. In all cases, we tried to occlude the left and right lower pulmonary arteries with a Swan-Ganz catheter, but due to procedural problems, the right pulmonary artery could not be occluded in 2 cases. Therefore, we were able to create PE models in 3 right and 5 left pulmonary arteries in the supine position, and in 3 right and 4 left pulmonary arteries in the standing position. After the experiment, all monkeys were returned to the breeding facility in an awake condition.
Measurements
We placed ROIs on the left and right lung fields in the DCR images and measured the average and maximum change in the pixel value of the ROI in 1 electrocardiogram (ECG) cycle. For image analysis of the PE model, we confirmed that the ROI was on a pulmonary blood flow occluded area by using contrast-enhanced imaging. In addition to the experimental study mentioned above, sequential chest radiographs were obtained using a dynamic FPD imaging system (Test Model; Konica Minolta, Inc., Tokyo, Japan), consisting of an indirect-conversion FPD (PaxScan, 4343CB; Varex Imaging Corporation, Salt Lake City, UT, USA), X-ray tube (RAD-94/B-130H; Varian Medical Systems, Inc., Palo Alto, CA, USA), and an X-ray generator (Epsilon, EPS45RF; EMD Technologies, Quebec, Canada). Imaging was performed in the supine and standing positions and anteroposterior direction (60 kV; 125 mA/pulse; 15 frames/s; SID=1.2 m), while monitoring the animal’s ECG (Life Scope; Nihon Kohden, Tokyo, Japan). Each image sequence consisted of images continuously obtained by X-ray pulses for ~8 s during breath-holding. We confirmed high linearity between the entrance dose to the detector and the pixel value output; high entrance dose to the detector was related to high pixel values. Matrix size was 1,024×1,024 pixels, pixel size was 417×417 µm2, and the gray-scale image range was 16 bits.
Image Analysis
As in a previous study,12
images were analyzed using a prototype software (Konica Minolta Inc., Japan) and a free image processing software (Image-J ver. 1.46r; National Institutes of Health, MD, USA). To facilitate image analysis, the central image region was cropped to 512×512 pixels. Sequential images were preprocessed to evaluate blood flow. The image was logarithmically transformed and bandpass-filtered images were created to exclude respiratory variations in pixel values. The cut-off frequency of the bandpass filter was set to the fundamental frequency of the heartbeat ±0.1 Hz. ROIs were set on the bandpass-filtered images and the magnitude of changes in pixel values was measured. The ROI shape was a circle with a diameter of 32 pixels. The 4 ROIs were manually positioned in the upper and lower lung fields for each lung. The average pixel value within the ROI was calculated for each frame of dynamic images. As previously reported,12
changes in average pixel values showed the same cycle as the ECG, with a decrease during diastole and increase during systole. Representative figures are shown in
Figure 2. The dynamic image contained more than 3 cardiac cycles, and the maximum change in average pixel value in each cardiac cycle was calculated. The average value of the maximum change in pixel value for 3 cycles was set as the ∆pixel value.

To evaluate intra- and inter-examiner variability of the measurement method, 3 independent examiners measured the ∆pixel value from an extracted case, 5 times and at 3 different points (the left lower lung field of the normal model, and the left and right lower lung fields in the left PE model). We calculated intraclass correlation coefficients (ICCs) of intra- and inter-examiner variability using the IBM SPSS Statistics 22 software package (IBM Japan, Tokyo, Japan). The 3 intra-examiner ICCs were 0.999, 95% confidence interval (CI): 0.994–1.000 (examiner A); 0.997, 95% CI: 0.987–1.000 (examiner B); and 0.995, 95% CI: 0.974–1.000 (examiner C). Inter-examiner ICCs were 0.999 (95% CI: 0.992–1.000). In each of the other cases, ∆pixel values were measured once by the same examiner.
Statistical Analysis
Statistical analyses were performed with the IBM SPSS Statistics 22 software package (IBM Japan). We evaluated the correlation between pixel value and pressure in both the pressure resistant tube and the elastic tube in the basic experiment using Pearson’s correlation test. In normal lung models, we used the t-test to evaluate the difference between ∆pixel values in the standing and supine positions in the right and left upper and lower lung fields. In the normal and PE models, we evaluated the difference between ∆pixel values in normal lung fields, on the occluded side of PE models and on the non-occluded side of PE models in both supine and standing positions using the t-test. P<0.05 was considered significant in all analyses.
Color-Mapping Images
For visual interpretation, changes in pixel values were quantified and visualized in the form of a color display; that is, as changes in a color scale. First, a minimum-intensity projection image (MINIP), where the lung pixel values were the highest in the entire cardiac cycle, was created for use as a base image. Differences in pixel values in the MINIP image were sequentially calculated throughout all frames and were superimposed on the original images in the form of a color display. In the resulting images (hereafter called “color-mapping images”), lower entrance dose to the detector is expressed as a deeper red color, whereas higher entrance dose to the detector is expressed as a deeper blue color. Finally, we investigated whether occluded blood circulation could be observed as color-defective areas.
Results
The basic experiment showed that when the elastic tube was filled with blood, the pixel value changed in inverse correlation to changes in blood pressure. In contrast, in the pressure resistant tube, the pixel value showed minimal change, with no correlation to blood pressure (Elastic tube: R=−0.908, P=0.0005; Pressure resistant tube: R=−0.234, P=0.613;
Figure 3).
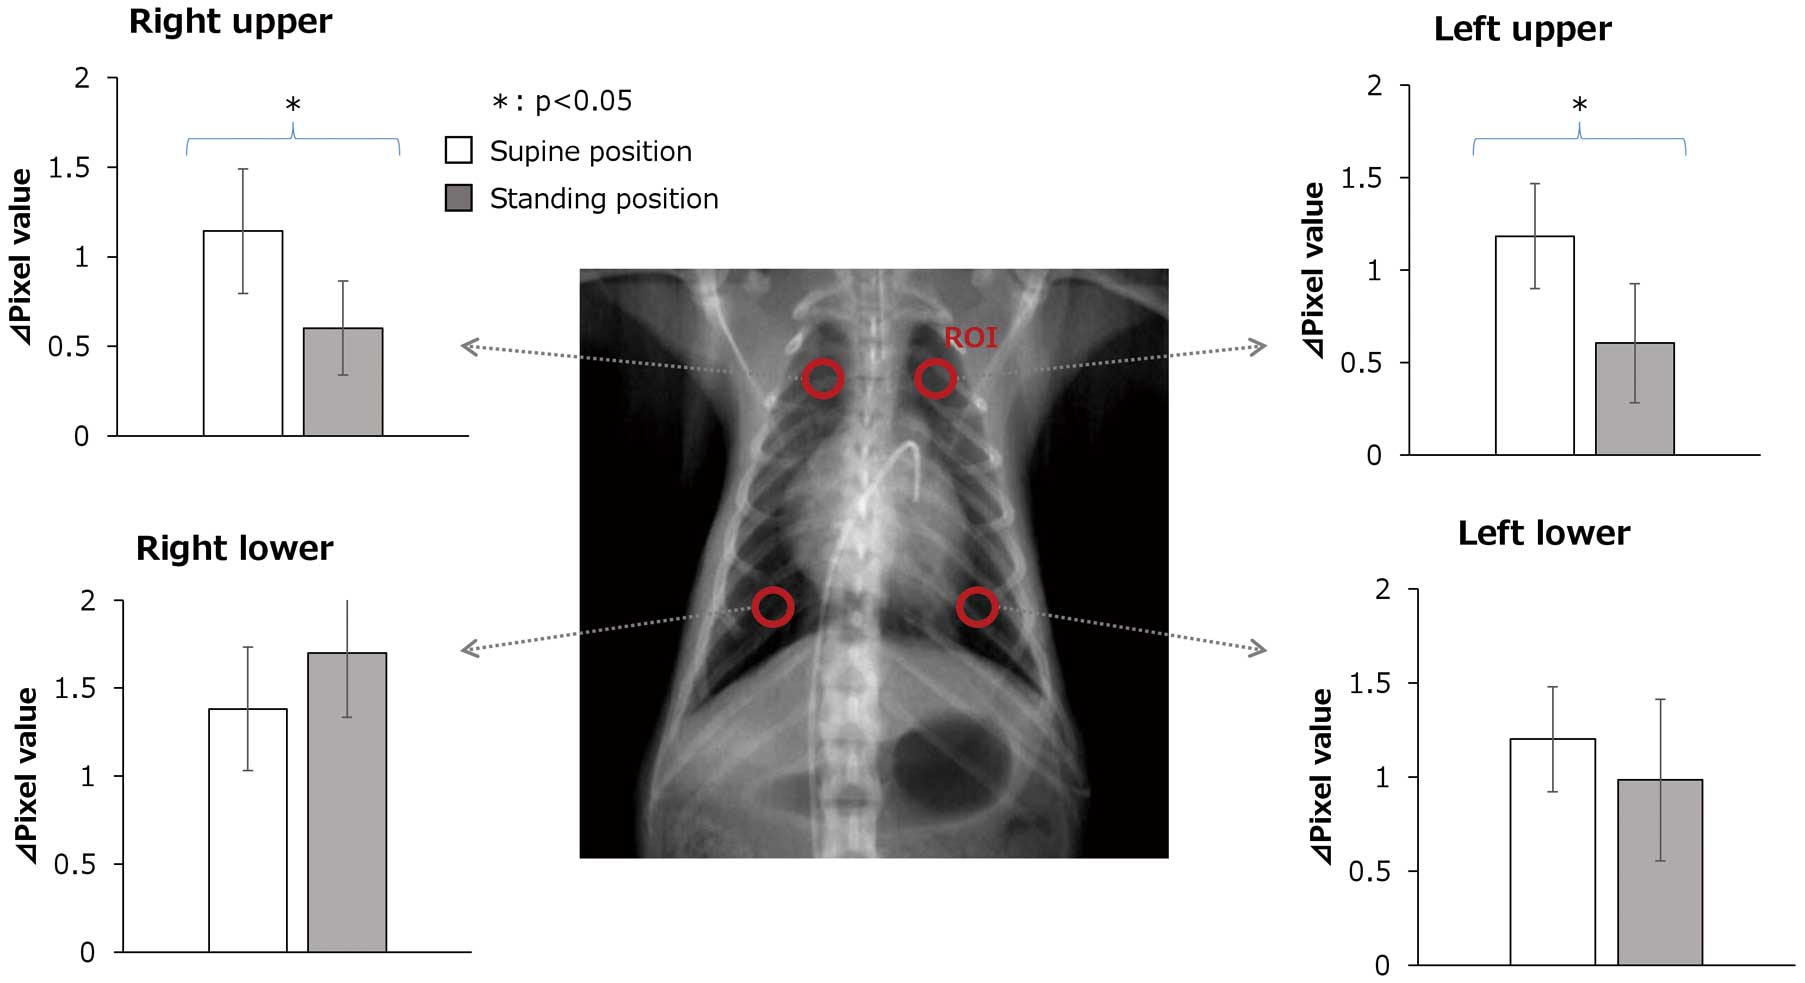
Figure 4
shows the maximum ∆pixel value in right upper, right lower, left upper and left lower lung fields in the normal lung model in supine and standing positions. In the standing position, ∆pixel values in the right and left upper lung fields were significantly lower than in the supine position. ∆pixel values in the right and left lower lung fields were not significantly different between the 2 positions. The average values, standard deviations and P values were as follows:
Right upper: supine 1.144±0.602 vs. standing 0.602±0.264, P=0.038; left upper: supine 1.184±0.284 vs. standing 0.606±0.321, P=0.027; right lower: supine 1.382±0.352 vs. standing 1.700±0.367, P=0.246; left lower: supine 1.202±0.279 vs. standing 0.986±0.430, P=0.428.
Figure 5
shows ∆pixel values of left and right lower lung fields in the normal lung model and left PE model in the supine position in the same monkey. Compared with the normal model, ∆pixel values of the left lower lung field decreased and ∆pixel values of the right lower lung field increased in the left PE model.
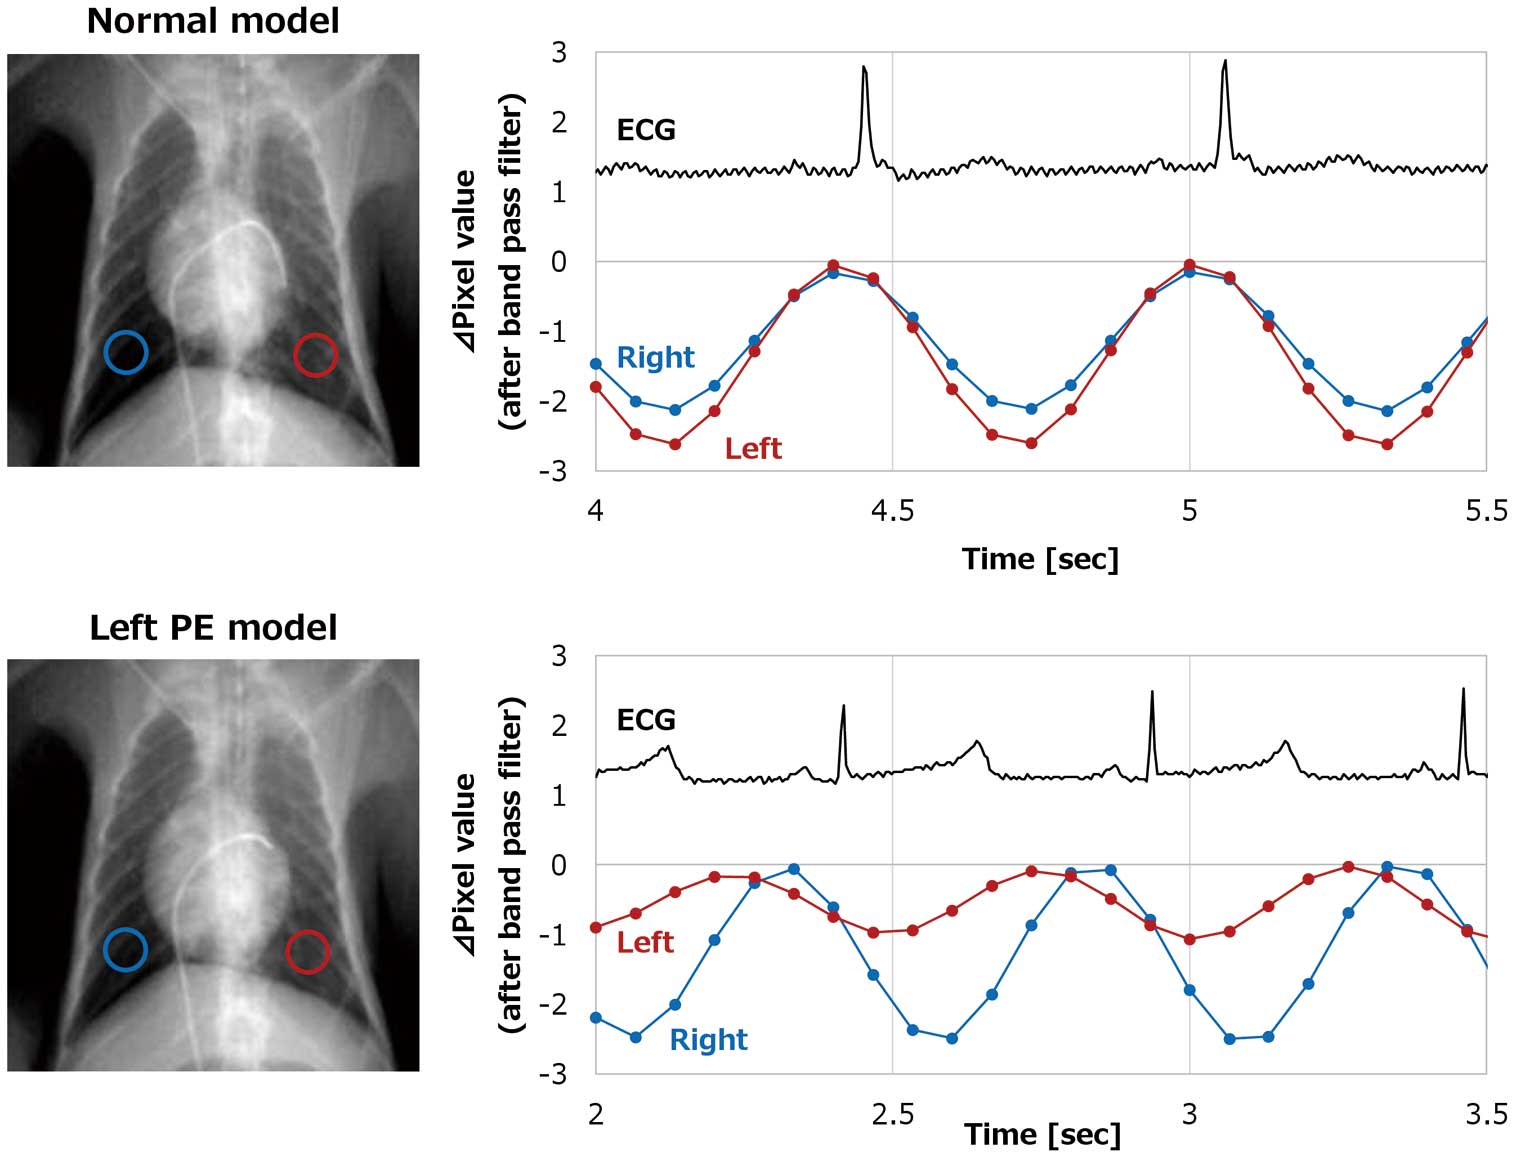
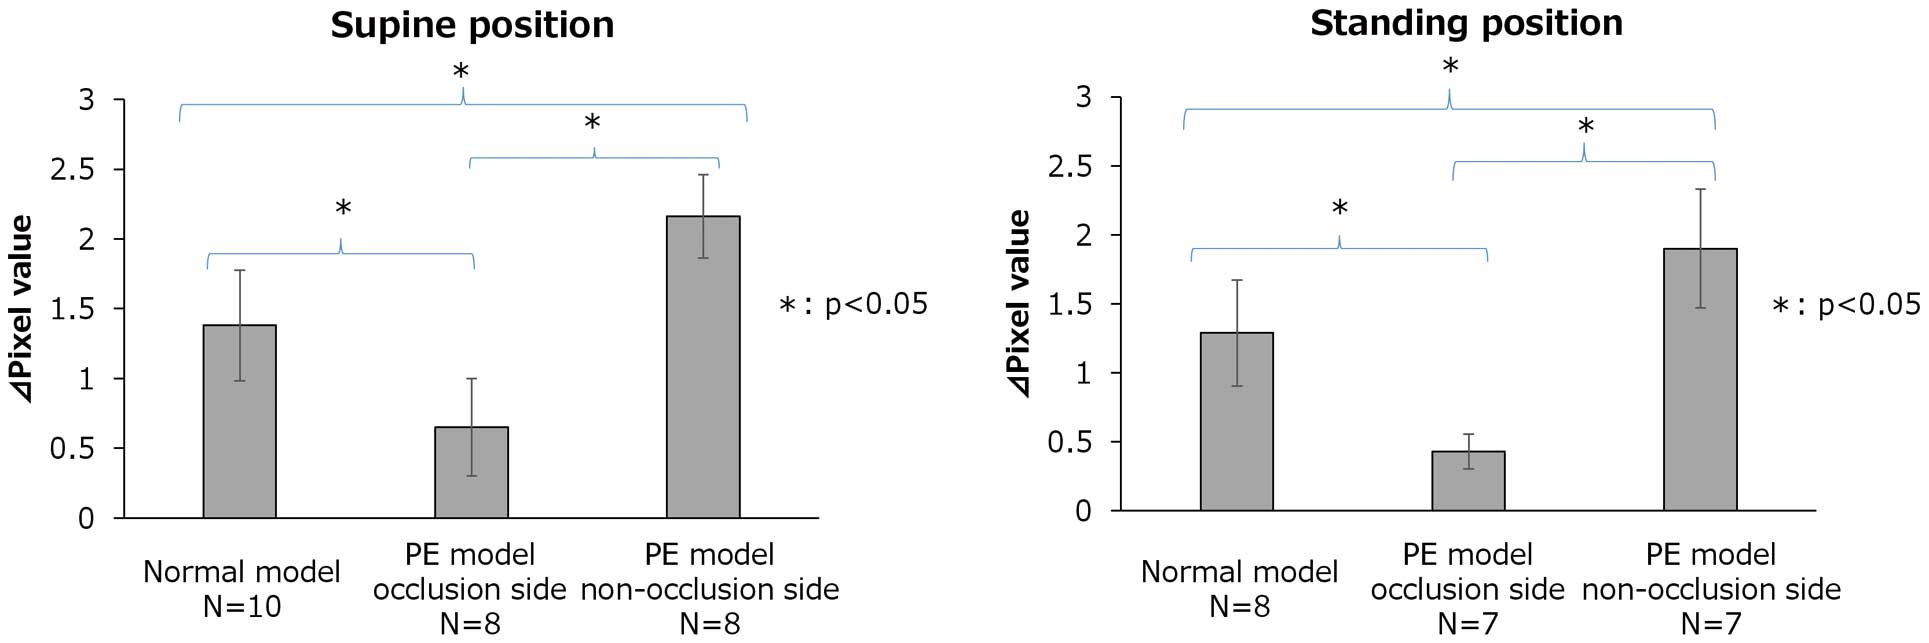
Figure 6
shows ∆pixel values measured in the lower lung fields of normal lung models and in the occlusion and non-occlusion sides in PE models in supine and standing positions, respectively. In the PE model, the ∆pixel value was significantly lower in the lung field where the pulmonary artery was blocked and significantly higher in the lung field where the pulmonary artery was not blocked, compared to the normal model. Additionally, in the PE model, ∆pixel values were significantly lower in the lung field where the pulmonary artery was blocked compared to the lung field where the pulmonary artery was not blocked. The average values, standard deviations, and p values were as follows.
Supine position: normal model 1.38±0.396; PE model occlusion side 0.65±0.350; PE model non-occlusion side 2.162±0.300; normal model vs. PE model occlusion side P=0.001; normal model vs. PE model non-occlusion side P=0.001; PE model occlusion side vs. PE model non-occlusion side P=0.001.
Standing position: normal model 1.287±0.385; PE model occlusion side 0.428±0.128; PE model non-occlusion side 1.900±0.431; normal model vs. PE model occlusion side P=0.018; normal model vs. PE model non-occlusion side P=0.001; PE model occlusion side vs. PE model non-occlusion side P=0.001.
As shown in
Figure 7
and
Supplementary Movie, changes in pixel values in normal and PE models were expressed as color maps. In normal models, both lungs changed to red. In PE models, the lung field where the pulmonary artery was occluded could be visualized as a color defect area.
Discussion
In the basic experiment, the pixel value in the elastic tube changed in inverse correlation to blood pressure changes. However, in the non-expandable pressure resistant tube, the pixel value changed only slightly, and no correlation was recognized with blood pressure. In the animal experiments, ∆pixel values in the standing position in the upper lung field decreased as compared to those in the supine position of normal lungs. In PE models, the ∆pixel value showed a smaller decrease in the lower lung field when the pulmonary artery was blocked, whereas the ∆pixel value increased in the lower lung field of the unblocked side compared to that in the normal model.
Normally, in the standing position, pulmonary blood flow decreases in the upper lung field and increases in the lower lung field.13
It is also known that when blood flow decreases in the lung field with pulmonary artery occlusion, it shows a compensatory increase in the non-occluded lung areas. In this study, changes in pixel values similar to these changes in blood flow were observed. Therefore, the magnitude of the change in pixel values in the lung field might correlate with pulmonary artery blood flow.
The reason for the correlation between the ∆pixel value and pulmonary artery blood flow might be that the ∆pixel value represents pulsation of the pulmonary artery. Our basic study suggested that ∆pixel values were not related to changes in the density of fluid in the lumen, but were due to changes in blood vessel diameter resulting from an increase in pulse pressure. The reason the ∆pixel value in the upper lung field decreased significantly in the standing compared to the supine position might be that pulse pressure in the upper lung field decreased and change in blood vessel diameter decreased with a postural change in blood flow. The reason for absence of significant differences between the ∆pixel value in the lower lung field in the supine and standing positions might be that the decrease in blood vessel volume in the ROI due to lung expansion offsets the increase in blood vessel diameter due to the increase in pulse pressure in the standing position. Further, the reason for the difference in pixel values between the normal and PE models might be that the pulmonary pulse pressure decreased as a result of blocking pulmonary blood flow, leading to a decrease in change in blood vessel diameter and pixel value at the occlusion site.
FPD might be able to diagnose PE faster, is less invasive and less expensive than contrast-enhanced CT and perfusion scintigraphy, and can even be performed at locations outside a hospital setting. Yamasaki et al recently reported a case in which DCR was useful for detecting CTEPH and pulmonary artery stenosis; the lung perfusion defect of DCR was similar to the lung perfusion scintigraphy of the CTEPH patient.14
In this study, we could not compare pulmonary blood flow scintigraphy with DCR, but for the report of CTEPH, DCR might also be an alternative examination for pulmonary scintigraphy in acute PE.14
To evaluate intra- and inter-examiner variability of the measurement method, 3 independent examiners measured the ∆pixel value on 5 occasions and at 3 different points obtained from an extracted case. The characteristics of a FPD might be particularly useful in disaster medicine. In recent years, PE accompanying disasters has become a problem in Japan. Deaths due to PE were reported following all 3 major earthquakes that occurred in the past decade.15,16
With the Great East Japan Earthquake, it was reported that 30% of patients who were forced to stay in their cars after the earthquake developed deep venous thrombosis and PE.17
A FPD is expected to be effective during such disasters. A FPD will be made portable in the future, and it might be possible to easily perform on-site evaluations to exclude PE. In addition, the fact that examination is possible in the standing position makes performing examinations quicker, and allows evaluation of a wider area of the lung.
In this study, FPD could detect not only complete occlusion of the pulmonary artery, but also physiological reduction in pulmonary blood flow, suggesting its possible utility in the detection of reduction in pulmonary blood flow resulting from partial occlusion by PE. If FPD is able to identify blood vessel pulsations, it might be useful for diagnosis of pulmonary arteriosclerosis, in which pulsation of the pulmonary artery is diminished. In addition, we could evaluate pulmonary blood flow even in monkeys the same size as human infants in this study. Therefore, a FPD might be useful in the diagnosis of congenital heart diseases associated with changes in pulmonary blood flow in infants.
Study Limitations
Various factors affect the change in pixel value during DCR. Unlike humans, monkeys do not develop arteriosclerosis. Therefore, it is unknown whether a FPD can evaluate pulmonary blood flow in humans as well as it does in monkeys. PE occurs in both central and peripheral pulmonary arteries. In this study, we could only create a central occlusion, but not a peripheral occlusion model. Therefore, further study is needed to determine whether a FPD can detect PE in peripheral pulmonary arteries.
Conclusions
A FPD was able to detect postural changes in pulmonary blood flow and its reduction by pulmonary artery occlusion in a monkey model, without the need for contrast injection.
Acknowledgments
The authors wish to thank Noritsugu Matsutani and Shintarou Muraoka for operating the FPD and performing image analyses, and Ikuo Kawamoto and Mitsuru Murase for management of the monkeys.
Disclosures
All authors declare no conflicts of interest.
IRB Information
The experimental protocol for this part of the study was approved by the institutional Animal Experiment and Use Committee of Shiga Medical University (approval number 16-157).
Data Availability
The datasets analyzed during the current study are available from the corresponding author upon reasonable request.
Approval
All authors approved the final version of this manuscript.
Supplementary Files
Supplementary Movie.
Dynamic chest radiography (DCR) images of the normal model (Left upper), color maps of the normal model (Right upper), DCR of the right PE model (Left lower) and color maps of the right PE model (Right lower). In the color maps, increases in pixel value changes are shown in blue and decreases in red.
Please find supplementary file(s);
http://dx.doi.org/10.1253/circj.CJ-20-0835
References
- 1.
Benotti JR, Dalen JE. The natural history of pulmonary embolism. Clin Chest Med 1984; 5: 403–410.
- 2.
Moser KM, Fedullo PF, LitteJohn JK, Crawford R. Frequent asymptomatic pulmonary embolism in patients with deep venous thrombosis. JAMA 1994; 271: 223–225.
- 3.
Stein PD, Willis PW 3rd, DeMets DL. History and physical examination in acute pulmonary embolism in patients without preexisting cardiac or pulmonary disease. Am J Cardiol 1981; 47: 218–223.
- 4.
Konstantinides SV, Meyer G, Becattini C, Bueno H, Geersing GJ, Harjola VP, et al. 2019 ESC Guidelines for the diagnosis and management of acute pulmonary embolism developed in collaboration with the European Respiratory Society (ERS). Eur Heart J 2020; 41: 543–603.
- 5.
Stein PD, Fowler SE, Goodman LR, Gottschalk A, Hales CA, Hull RD, et al. Multidetector computed tomography for acute pulmonary embolism. N Engl J Med 2006; 354: 2317–2327.
- 6.
Cochran ST, Bomyea K, Sayre JW. Trends in adverse events after IV administration of contrast media. AJR Am J Roentgenol 2001; 176: 1385–1388.
- 7.
Sodickson A, Baeyens PF, Andriole KP, Prevedello LM, Nawfel RD, Hanson R, et al. Recurrent CT, cumulative radiation exposure, and associated radiation-induced cancer risks from CT of adults. Radiology 2009; 251: 175–184.
- 8.
Tanaka R, Sanada S, Fujimura M, Yasui M, Hayashi N, Tsuji S, et al. Development of pulmonary blood flow evaluation method with a dynamic flat-panel detector: Quantitative correlation analysis with findings on perfusion scan. Radiol Phys Technol 2010; 3: 40–45.
- 9.
Tanaka R, Sanada S, Okazaki N, Kobayashi T, Fujimura M, Yasui M, et al. Evaluation of pulmonary function using breathing chest radiography with a dynamic flat panel detector: Primary results in pulmonary diseases. Invest Radiol 2006; 41: 735–745.
- 10.
Yamada Y, Ueyama M, Abe T, Araki T, Nishino M, Jinzaki M, et al. Difference in diaphragmatic motion during tidal breathing in a standing position between COPD patients and normal subjects: Time-resolved quantitative evaluation using dynamic chest radiography with flat panel detector system (“dynamic X-ray phrenicography”). Eur J Radiol 2017; 87: 76–82.
- 11.
Tanaka R, Sanada S, Fujimura M, Yasui M, Tsuji S, Hayashi N, et al. Pulmonary blood flow evaluation using a dynamic flat-panel detector: Feasibility study with pulmonary diseases. Int J Comput Assist Radiol Surg 2009; 4: 449–455.
- 12.
Tanaka R, Tani T, Nitta N, Tabata T, Matsutani N, Muraoka S, et al. Detection of pulmonary embolism based on reduced changes in radiographic lung density during cardiac beating using dynamic flat-panel detector: An animal-based study. Acad Radiol 2019; 26: 1301–1308.
- 13.
Hlastala MP, Bernard SL, Erickson HH, Fedde MR, Gaughan EM, McMurphy R, et al. Pulmonary blood flow distribution in standing horses is not dominated by gravity. J Appl Physiol (1985) 1996; 81: 1051–1061.
- 14.
Yamasaki Y, Abe K, Hosokawa K, Kamitani T. A novel pulmonary circulation imaging using dynamic digital radiography for chronic thromboembolic pulmonary hypertension. Eur Heart J 2020; 41: 2506.
- 15.
Sakuma M, Nakamura M, Hanzawa K, Kobayashi T, Kuroiwa M, Nakanishi N, et al. Acute pulmonary embolism after an earthquake in Japan. Semin Thromb Hemost 2006; 32: 856–860.
- 16.
Watanabe H, Kodama M, Tanabe N, Nakamura Y, Nagai T, Sato M, et al. Impact of earthquakes on risk for pulmonary embolism. Int J Cardiol 2008; 16: 152–154.
- 17.
Shibata M, Chiba H, Sasaki K, Ueda S, Yamamura O, Hanzawa K. The utility of on-site ultrasound screening in population at high risk for deep venous thrombosis in temporary housing after the great East Japan Earthquake. J Clin Ultrasound 2017; 45: 566–574.