Abstract
Background:
Data regarding complex relationships between age, sex, obesity and N-terminal pro B-type natriuretic peptide (NT-proBNP) remain scarce. Thus, we investigated sex-specific associations of obesity and NT-proBNP levels among adults in the general healthy population in Korea.
Methods and Results:
The associations of age, sex and obesity-associated parameters (waist circumference [WC], body mass index [BMI] and body weight) with NT-proBNP were analyzed in 39,937 healthy adult participants. Multivariable regression models adjusted for factors known to affect NT-proBNP were used to identify associations between NT-proBNP and obesity-related parameters. NT-proBNP levels were higher in females than males. Older age was also associated with higher NT-proBNP levels in the overall population (P<0.001). When accounting for age in multivariable linear regression models, there was a strong inverse association between WC, BMI, and NT-proBNP in females and a weaker inverse association in males, with a significant difference between the sexes (P interaction <0.001). After adjusting for the effects of WC and BMI on each other, abdominal obesity was associated with lower NT-proBNP levels in females but not males (P interaction <0.001).
Conclusions:
In this large sample of young and healthy Asians, younger age, male sex, and increases in obesity-related parameters were related to lower levels of NT-proBNP. Further comprehensive studies are needed to understand the factors affecting NT-proBNP levels in different populations.
Levels of B-type natriuretic peptide (BNP) and N-terminal pro BNP (NT-proBNP) help differentiate between cardiac and non-cardiac causes of dyspnea and are useful in predicting prognosis and monitoring treatment efficacy in patients with heart failure (HF). Both BNP and NT-proBNP are affected by demographic characteristics, such as age, sex, obesity, and renal function,1–4
and their complex inter-relationships leaves uncertainties in the interpretation of the results of these biomarkers.
Editorial p ????
It is well-known that circulating NT-proBNP concentrations are generally higher in females than in males. In addition, circulating NT-proBNP concentrations are reported to increase with age and decrease with obesity. However, in real-world practice, these factors have a complex effect on NT-proBNP levels, making it difficult to identify a uniform relationship. In a recent large-scale general population cohort study, lower NT-proBNP concentrations in obese individuals were better explained by sex than by obesity.5
Another recent study demonstrated complex relationships between obesity, sex, and HF.6
The authors of that study concluded that using cut-off values adjusted for sex, age, and body mass index (BMI) improves the diagnostic and prognostic accuracy of natriuretic peptides in HF patients.6
However, these previous studies were small or included patients with underlying diseases that could affect NT-proBNP levels, making it difficult to completely exclude the effects of medication or the disease itself on natriuretic peptide concentrations; in addition, it is not known whether the results of studies on Westerners can be applied to Asian populations. The availability of routine plasma NT-proBNP measurements on >30,000 young individuals in the Kangbuk Samsung Health Study (KSHS) allows comprehensive investigation of the association of these demographics with NT-proBNP levels and provides an opportunity to assess whether age, sex, and obesity modify these relationships. Therefore, in the present study we investigated the associations of age, sex, and obesity with NT-proBNP levels in a very large, relatively young, healthy, and well-characterized Asian cohort.
Methods
Study Population
The study population consisted of individuals involved in a comprehensive health screening program that included measurement of NT-proBNP levels at Kangbuk Samsung Hospital, Seoul, Korea, from 2016 to 2018 (n=44,123). The screening program aimed to promote health through the early detection of chronic diseases and their risk factors. In addition, the Korean Industrial Safety and Health Law requires employees to participate in an annual or biennial health examination. For the present cross-sectional study, 4,186 subjects were excluded because they had hypertension (n=2,180), coronary disease (n=140), diabetes (n=827), a history of cancer (n=1,287), or missing information (n=235). Some participants met multiple exclusion criteria. Thus, 39,937 participants were included in the final study.
Measurements
Data on demographic variables, health behaviors, educational background, past medical history, and family history of cardiovascular disease were collected using standardized, self-administered questionnaires.7
Anthropometric measurements and vital statistics were obtained by professional staff. Waist circumference (WC) was measured in standing subjects, with their weight evenly distributed on the 2 sides, arms at their sides, and facing straight ahead, to the nearest 0.1 cm at the middle point between the bottom of the cage rib and the top of the iliac crest. Body weight was measured using a digital scale to the nearest 0.1 kg in subjects wearing light clothing and no shoes. Height was measured to the nearest 0.1 cm. BMI was calculated as weight in kilograms divided into height in meters squared. Blood pressure was measured by professional nurses using an automated oscillometric device (53000; Welch Allyn, New York, NY, USA). Three consecutive blood pressure measurements were obtained and the analysis used the mean of the second and third readings.
Following a minimum 10-h fast, blood samples were obtained from subjects, with analyses conducted by the same clinical core laboratory, which is certified by the Korean Association of Quality Assurance for Clinical Laboratories. Serum total cholesterol, triglycerides, low-density lipoprotein cholesterol (LDL-C), and high-density lipoprotein cholesterol (HDL-C) concentrations were measured using Bayer Reagent Packs (Bayer Diagnostics, Leverkusen, Germany) on an automated chemistry analyzer (Advia 1650 Autoanalyzer; Bayer Diagnostics). Serum NT-proBNP concentrations were determined using an automated immunoassay analyzer (Cobas e411; Roche Diagnostics, Tokyo, Japan). The interassay coefficients of variation for quality control samples of lower and higher NT-proBNP concentrations were 1.20–5.37% and 2.28–4.33%, respectively, during the study period.
Statistical Analysis
Quantitative data are summarized as the mean±SD, unless significantly skewed, in which case data are presented as the median and interquartile range (IQR). Categorical data are expressed as numbers and percentages. Baseline variables were compared using Student’s t-test, the Wilcoxon rank-sum test or Chi-squared test, as appropriate. Skewed variables were log2
transformed to facilitate interpretation. Associations between log2-transformed NT-proBNP concentrations and obesity-related parameters were analyzed using univariable linear regression analysis and a multivariable regression model adjusted for socioeconomic factors. Using kernel-weighted local polynomial smoothing, univariable associations of anthropometric measures and age with NT-proBNP concentrations were graphically modeled. Multivariable-adjusted associations of WC with NT-proBNP concentrations were graphically assessed by means of regression analysis using a restricted cubic spline function to check for possible deviations from linearity.
Reported P values are 2-tailed, and P<0.05 was considered statistically significant. All statistical analyses were conducted using STATA version 16.1 (StataCorp, College Station, TX, USA).
Ethical Considerations
This study was approved by the Institutional Review Board of Kangbuk Samsung Hospital, which exempted the requirement for informed consent, because only deidentified data were accessed retrospectively.
Results
Associations of Demographic Characteristics With NT-proBNP
In all, 39,937 participants free of hypertension, coronary disease, or diabetes at the time of study enrollment were included.
Table 1
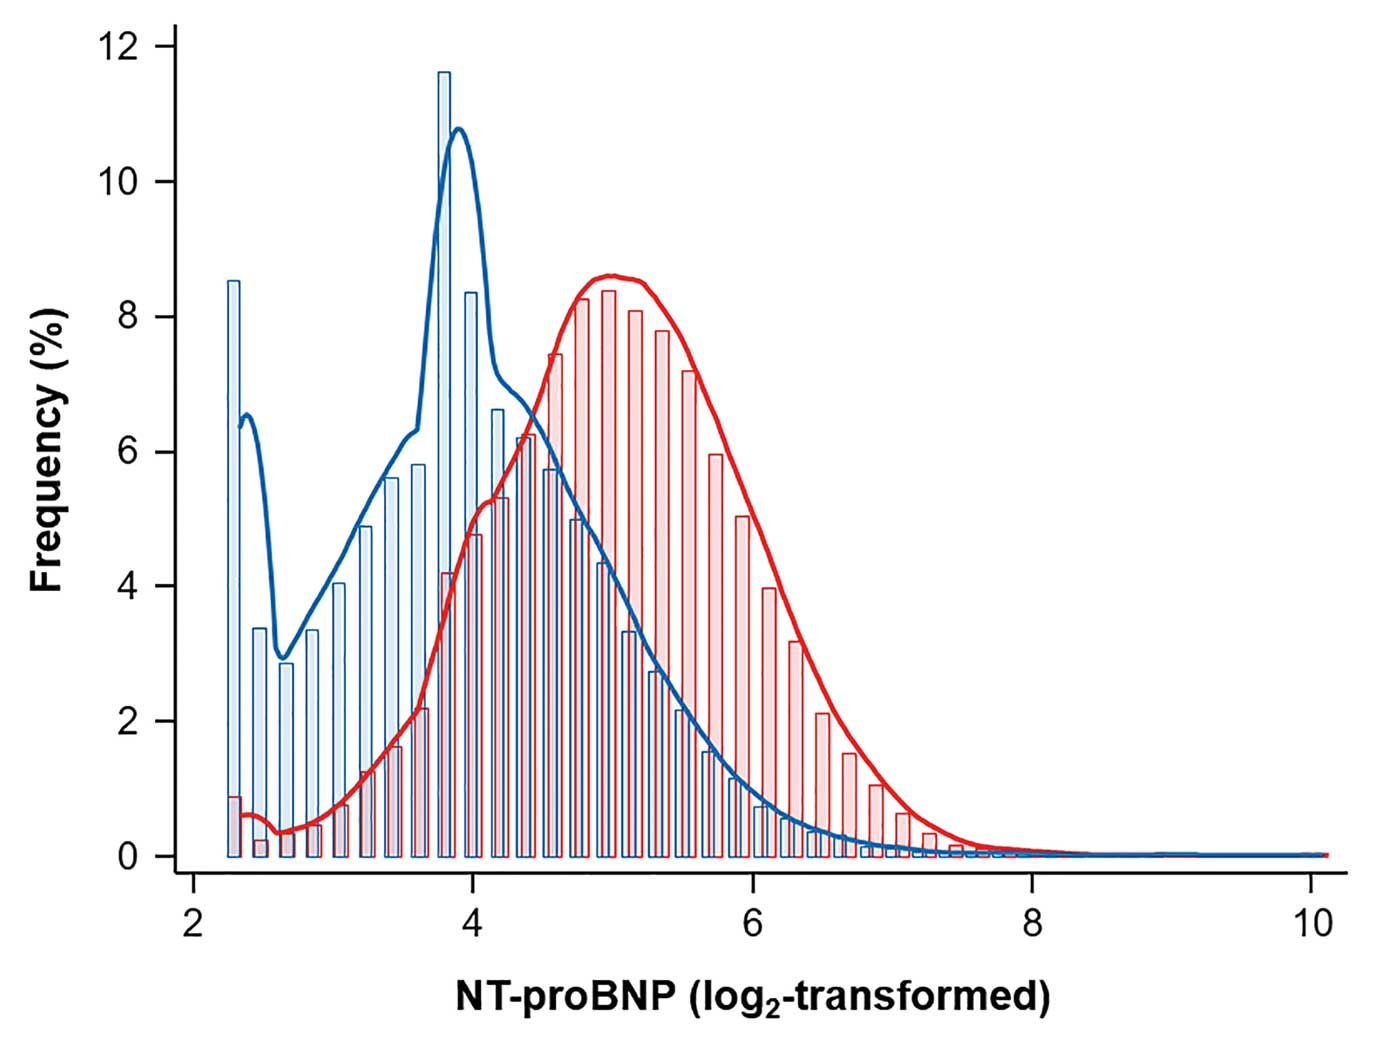
shows the baseline characteristics of the study population according to sex. The study population comprised relative young individuals (mean age 39.1±7.6 years), and 57.6% (n=23,013) was male. In general, males had significantly higher values for obesity-related parameters (BMI, WC, and weight) than females. Fasting glucose and LDL-C levels were also higher in males. The median NT-proBNP concentration in the overall population was 20.8 ng/dL (IQR 12.8–35.8 ng/dL). Median NT-proBNP concentrations were significantly higher in females than males (32.8 [IQR 21.3–50.3] vs. 14.6 [IQR 9.4–23.4] ng/dL, respectively;
Figure 1). An increase in NT-proBNP with age was observed in both sexes, albeit weaker in females (Coef. 0.38, P<0.01) than in males (Coef 0.54, P<0.027;
Supplementary Table).
Figure 2
shows the relationship between age and median NT-proBNP concentrations.
Table 1.
Baseline Characteristics According to Sex
| |
Total |
Male |
Female |
P value |
| No. subjects |
39,937 |
23,013 (57.6) |
16,924 (42.4) |
|
| NT-proBNP (ng/dL) |
20.77 [12.8–35.8] |
14.6 [9.4–23.4] |
32.8 [21.3–50.3] |
<0.001 |
| WC (cm) |
81.1±9.8 |
86.0±8.0 |
74.6±8.2 |
<0.001 |
| BMI (kg/m2) |
23.4±3.4 |
24.7±3 |
21.7±3.1 |
<0.001 |
| Weight (kg) |
67±13.3 |
74.8±10.4 |
56.3±8.7 |
<0.001 |
| Age (years) |
39.1±7.6 |
39.5±7.5 |
38.4±7.7 |
<0.001 |
| IPAQ |
|
|
|
<0.001 |
| Sedentary |
19,501 (48.8) |
9,626 (41.8) |
9,875 (58.4) |
|
| Mild |
14,294 (35.8) |
9,373 (40.7) |
4,921 (29.1) |
|
| HEPA |
6,001 (15.0) |
3,950 (17.2) |
2,051 (12.1) |
|
| Current smoker |
4,817 (12.1) |
4,625 (20.1) |
192 (1.1) |
<0.001 |
| Alcohol intake (g/day) |
4 [1–13] |
7 [3–19] |
2 [0–6] |
<0.001 |
| High alcohol intakeA |
3,967 (10.6) |
3,138 (14.1) |
829 (5.5) |
<0.001 |
| Higher educationB |
33,462 (83.8) |
20,298 (88.2) |
13,164 (77.8) |
<0.001 |
| SBP (mmHg) |
109.0±12.1 |
113.8±10.9 |
102.6±10.4 |
<0.001 |
| DBP (mmHg) |
69.9±9.4 |
73.2±8.8 |
65.3±8.1 |
<0.001 |
| Hemoglobin (g/dL) |
14.5±1.6 |
15.6±0.9 |
13.2±1.1 |
<0.001 |
| Fasting glucose (mg/dL) |
93.7±10.9 |
95.7±11.2 |
91.1±9.8 |
<0.001 |
| Total cholesterol (mg/dL) |
190.5±33.1 |
195.8±33.3 |
183.3±31.3 |
<0.001 |
| LDL-C (mg/dL) |
127.1±32.1 |
135.1±31.5 |
116.2±29.7 |
<0.001 |
| HDL-C (mg/dL) |
61.2±16.6 |
55±13.9 |
69.7±16.3 |
<0.001 |
| Triglycerides (mg/dL) |
91 [65–135] |
112 [79–162] |
71 [55–97] |
<0.001 |
| eGFR (mL/min/1.73 m2) |
104.1±13.2 |
100.4±12.7 |
109.1±12.2 |
<0.001 |
Unless indicated otherwise, data are given as the mean±SD, median [interquartile range], or n (%). AHigh alcohol intake was defined as >30 g/day for men and >20 g/day for women. BHigher education was defined as college graduate or higher. BMI, body mass index; DBP, diastolic blood pressure; eGFR, estimated glomerular filtration rate; HDL-C, high-density lipoprotein cholesterol; HEPA, health-enhancing physical activity; IPAQ, International Physical Assessment Questionnaire; LDL-C, low-density lipoprotein cholesterol; NT-proBNP, N-terminal pro B-type natriuretic peptide; SBP, systolic blood pressure; WC, waist circumference.
We then analyzed tertiles of NT-proBNP according to sex to see the association between NT-proBNP concentrations and clinical characteristics (Table 2). As the tertiles of NT-proBNP increased, the age of the population increased, showing the same pattern in both sexes. Obesity-related parameters, fasting glucose, and cholesterol levels were inversely related to NT-proBNP in both sexes. We also examined the sex-specific populations in WC tertiles to identify the association of abdominal obesity with baseline clinical features and NT-proBNP concentrations (Table 3). Increases in WC were positively associated with increases in sedentary behavior, weight, blood pressure, fasting glucose, and cholesterol levels. In both sexes, increases in WC were significantly associated with decreases in NT-proBNP levels.
Table 2.
Baseline Characteristics According to NT-proBNP Tertiles (T1–3) for Males and Females
| |
Males |
Females |
| T1 |
T2 |
T3 |
P value |
T1 |
T2 |
T3 |
P value |
| NT-proBNP (ng/dL) |
5.0–11.5 |
11.5–19.7 |
19.7–1,072 |
|
5.0–25.0 |
25.0–43.0 |
43.0–11,879 |
|
| No. subjects |
7,638 |
7,698 |
7,677 |
|
5,629 |
5,643 |
5,652 |
|
| WC (cm) |
87.1±8.13 |
85.9±8.0 |
84.9±7.6 |
<0.001 |
75.9±8.8 |
74.4±7.9 |
73.5±7.7 |
<0.001 |
| BMI (kg/m2) |
25.2±3.1 |
24.7±3 |
24.2±2.8 |
<0.001 |
22.3±3.4 |
21.6±3 |
21.3±2.9 |
<0.001 |
| Weight (kg) |
76.2±10.6 |
74.9±10.5 |
73.3±9.9 |
<0.001 |
57.7±9.5 |
56.1±8.2 |
55.3±8.1 |
<0.001 |
| Age |
37.9±6.5 |
39.3±7.2 |
41.4±8.2 |
<0.001 |
37.6±7.2 |
38.5±7.6 |
39.1±8.3 |
<0.001 |
| IPAQ |
|
|
|
<0.001 |
|
|
|
0.108 |
| Sedentary |
3,334 (43.7) |
3,178 (41.3) |
3,114 (40.6) |
|
3,365 (59.8) |
3,288 (58.3) |
3,222 (57.0) |
|
| Mild |
3,029 (39.7) |
3,202 (41.6) |
3,142 (40.9) |
|
1,596 (28.4) |
1,627 (28.8) |
1,698 (30.0) |
|
| HEPA |
1,267 (16.6) |
1,297 (16.9) |
1,386 (18.1) |
|
643 (11.4) |
700 (12.4) |
708 (12.5) |
|
| Current smoker |
1,509 (19.8) |
1,453 (18.9) |
1,663 (21.7) |
<0.001 |
72 (1.3) |
47 (0.8) |
73 (1.3) |
0.001 |
| Alcohol intake (g/day) |
7 [3–19] |
7 [3–17] |
7 [3–20] |
<0.001 |
2 [1–6] |
2 [0–5] |
2 [0–5] |
<0.001 |
| High alcohol intakeA |
1,051 (14.1) |
979 (13.2) |
1,108 (14.9) |
0.009 |
294 (5.8) |
268 (5.3) |
267 (5.3) |
0.477 |
| Higher educationB |
6,705 (87.8) |
6,888 (89.5) |
6,705 (87.3) |
<0.001 |
4,392 (78.0) |
4,406 (78.1) |
4,366 (77.3) |
0.538 |
| SBP (mmHg) |
114.4±10.5 |
113.6±10.8 |
113.4±11.4 |
<0.001 |
103±9.8 |
102.1±10.1 |
102.7±11.3 |
<0.001 |
| DBP (mmHg) |
73.6±8.6 |
73±8.7 |
72.9±9.2 |
<0.001 |
65.9±7.7 |
65±7.9 |
65.2±8.7 |
<0.001 |
| Fasting glucose (mg/dL) |
96±11.3 |
95.7±11.4 |
95.3±11.1 |
<0.001 |
92±11.1 |
90.9±9.1 |
90.3±8.9 |
<0.001 |
| Total cholesterol (mg/dL) |
201.1±34.5 |
195.2±32.7 |
190.9±32 |
<0.001 |
187.8±31.8 |
182.7±31.4 |
179.6±30.1 |
<0.001 |
| LDL-C (mg/dL) |
139.9±32.2 |
135.3±31 |
130.1±30.5 |
<0.001 |
120.9±30.4 |
115.8±29.7 |
112±28.3 |
<0.001 |
| HDL-C (mg/dL) |
54±13.6 |
55±13.9 |
56.1±14.1 |
<0.001 |
69.5±17 |
69.8±16.2 |
69.7±15.7 |
0.626 |
| Triglycerides (mg/dL) |
120 [84–176] |
111 [79–160] |
106 [76–150] |
<0.001 |
73 [56–100] |
70 [54–95] |
71 [55–95] |
<0.001 |
| eGFR (mL/min/1.73 m2) |
100.9±12.5 |
100±12.7 |
100.2±12.9 |
<0.001 |
109.1±12 |
109.1±11.9 |
109±12.6 |
0.900 |
Unless indicated otherwise, data are given as the mean±SD, median [interquartile range], or n (%). AHigh alcohol intake was defined as >30 g/day for men and >20 g/day for women. BHigher education was defined as college graduate or higher. Abbreviations as in Table 1.
Table 3.
Baseline Characteristics According to WC Tertiles (T1–3) for Males and Females
| |
Males |
Females |
| T1 |
T2 |
T3 |
P value |
T1 |
T2 |
T3 |
P value |
| WC (cm) |
58.5–82.1 |
82.2–88.6 |
88.7–137 |
|
55–70.1 |
70.2–76.8 |
76.9–135 |
|
| No. subjects |
7,591 |
7,721 |
7,701 |
|
5,599 |
5,678 |
5,647 |
|
| NT-proBNP (ng/dL) |
15.7
[10.7–25.3] |
14.8
[9.54–23.4] |
14.5
[8.2–21.4] |
<0.001 |
35.9
[23.8–54.2] |
32.7
[21.4–50.4] |
29.8
[18.8–46.14] |
<0.001 |
| BMI (kg/m2) |
22±1.7 |
24.4±1.4 |
27.6±2.6 |
<0.001 |
19.2±1.4 |
21.2±1.4 |
24.8±3.1 |
<0.001 |
| Weight (kg) |
65.7±5.9 |
73.7±5.2 |
84.8±8.9 |
<0.001 |
49.5±4.1 |
54.9±4.1 |
64.5±8.7 |
<0.001 |
| Age |
38.9±7.7 |
40±7.4 |
39.7±7.2 |
<0.001 |
36.5±6.8 |
38.5±7.3 |
40.2±8.6 |
<0.001 |
| IPAQ |
|
|
|
<0.001 |
|
|
|
<0.001 |
| Sedentary |
2,953 (38.9) |
3,249 (42.1) |
3,424 (44.5) |
|
3,141 (56.1) |
3,327 (58.6) |
3,407 (60.3) |
|
| Mild |
3,093 (40.8) |
3,143 (40.7) |
3,137 (40.7) |
|
1,814 (32.4) |
1,602 (28.2) |
1,505 (26.7) |
|
| HEPA |
1,525 (20.1) |
1,306 (16.9) |
1,119 (14.5) |
|
629 (11.2) |
720 (12.7) |
702 (12.4) |
|
| Current smoker |
1,402 (18.5) |
1,514 (19.6) |
1,709 (22.2) |
<0.001 |
60 (1.1) |
61 (1.1) |
71 (1.3) |
<0.001 |
| Alcohol intake (g/day) |
6 [3–14] |
7 [3–18] |
9 [3–21] |
<0.001 |
2 [1–6] |
2 [1–5] |
2 [0–5] |
0.130 |
| High alcohol intakeA |
853 (11.6) |
1,038 (13.8) |
1,247 (16.7) |
<0.001 |
246 (4.9) |
277 (5.4) |
306 (6.1) |
0.026 |
| Higher educationB |
6,682 (88.0) |
6,845 (88.7) |
6,771 (87.9) |
0.165 |
4,682 (83.6) |
4,555 (80.2) |
3,927 (69.5) |
<0.001 |
| SBP (mmHg) |
110±10.2 |
113.5±10.4 |
117.8±10.8 |
<0.001 |
99.3±8.6 |
101.4±9.4 |
107±11.5 |
<0.001 |
| DBP (mmHg) |
70.7±8.3 |
73.1±8.6 |
75.7±8.8 |
<0.001 |
63.9±7.4 |
64.7±7.7 |
67.4±8.7 |
<0.001 |
| Fasting glucose (mg/dL) |
93.4±10.2 |
95.8±10.6 |
97.7±12.4 |
<0.001 |
88.8±7.3 |
90.6±8 |
94±12.5 |
<0.001 |
| Total cholesterol (mg/dL) |
188.9±31.3 |
196.8±33.9 |
201.5±33.5 |
<0.001 |
178.9±28.8 |
181.5±30.1 |
189.6±33.7 |
<0.001 |
| LDL-C (mg/dL) |
127.3±30.1 |
136.6±31.3 |
141.4±31.4 |
<0.001 |
108.5±26.1 |
114.6±28.3 |
125.6±31.9 |
<0.001 |
| HDL-C (mg/dL) |
61.2±14.7 |
54.3±12.8 |
49.7±11.5 |
<0.001 |
75.7±15.7 |
70.4±15.4 |
62.9±15.3 |
<0.001 |
| Triglycerides (mg/dL) |
88 [66–120] |
115 [83–163] |
141 [101–198] |
<0.001 |
63 [50–80] |
70 [54–91] |
88 [65–123] |
<0.001 |
| eGFR (mL/min/1.73 m2) |
100.7±12.5 |
99.8±12.7 |
100.6±12.8 |
<0.001 |
110±11.8 |
109.1±11.7 |
108.1±12.9 |
<0.001 |
Unless indicated otherwise, data are given as the mean±SD, median [interquartile range], or n (%).A
High alcohol intake was defined as >30 g/day for men and >20 g/day for women.B
Higher education was defined as college graduate or higher. Abbreviations as in Table 1.
We examined the relationship between obesity-related parameters and NT-proBNP concentrations after sex-stratification using linear regression models. Model 1 was adjusted for age, and all obesity parameters showed an inverse association with NT-proBNP levels. This inverse association was stronger in females (P interaction <0.001). Weight showed a weaker association with NT-proBNP concentrations than the other obesity-related parameters (Table 4).
Table 4.
Sex-Stratified Associations of NT-proBNP With Obesity Parameters
| |
Males |
Females |
Interaction
P value |
| Coef. |
R2 |
P value |
Coef. |
R2 |
P value |
| Model 1 |
| WC (1SD) |
−1.5 |
0.030 |
<0.001 |
−3.47 |
0.022 |
<0.001 |
<0.001 |
| BMI (1SD) |
−1.66 |
0.031 |
<0.001 |
−3.57 |
0.023 |
<0.001 |
<0.001 |
| Weight (1SD) |
−1.26 |
0.029 |
<0.001 |
−2.83 |
0.018 |
<0.001 |
<0.001 |
| Model 2 |
| WC (1SD) |
−1.44 |
0.039 |
<0.001 |
−3.98 |
0.035 |
<0.001 |
<0.001 |
| BMI (1SD) |
−1.68 |
0.040 |
<0.001 |
−4.08 |
0.037 |
<0.001 |
<0.001 |
| Weight (1SD) |
−1.20 |
0.037 |
<0.001 |
−3.21 |
0.030 |
<0.001 |
<0.001 |
| Model 3 |
| WC (1SD) |
0.13 |
0.040 |
0.706 |
−1.80 |
0.037 |
0.001 |
<0.001 |
| BMI (1SD) |
−0.60 |
0.039 |
<0.001 |
−2.52 |
0.037 |
<0.001 |
<0.001 |
| Weight (1SD) |
1.35 |
0.041 |
0.001 |
3.33 |
0.039 |
<0.001 |
<0.001 |
Model 1 was adjusted for age (years). Model 2 was adjusted for age (years), SBP (mmHg), activity level (sedentary, mild, health-enhancing physical activity), smoking (current), alcohol intake (g/day), education, hemoglobin (g/dL), and renal function (eGFR). Model 3 was adjusted for all factors in Model 2 and BMI for WC, WC for BMI, and WC and BMI for weight. Abbreviations as in Table 1.
We accounted for systolic blood pressure, socioeconomic factors (activity level, current smoking, drinking, and educational level) and laboratory data (hemoglobin and estimated glomerular filtration rate [eGFR]) in Model 2. After adjustment for these covariates, there was a strong inverse association between obesity-related parameters in females and a weaker inverse association in males, with a significant difference between the sexes (P interaction <0.001). To adjust for the association of the 3 obesity-related parameters, Model 3 was created with corrections for BMI for WC, WC for BMI, and WC and BMI for weight. In Model 3, an inverse association between WC and NT-proBNP was observed in females (Coef. −2.07, P<0.001), but not in males (Coef. −0.14, P=0.66; P interaction <0.001). BMI was associated with lower NT-proBNP concentrations in both sexes.
Finally, we assessed the relationship between obesity-related parameters and NT-proBNP concentrations using regression analysis and a restricted cubic spline function. When adjusted for age, laboratory data and socioeconomic parameters (Model 2), both WC and BMI were inversely correlated with NT-proBNP concentrations (Figure 3) in both sexes. However, after correcting for the effects of WC and BMI on each other, the inverse association between WC and NT-proBNP concentrations was no longer statistically significant in males. Only an increase in BMI was significantly associated with decreases in NT-proBNP concentrations in both males and females (Figure 4).
Discussion
In this large-scale study of individuals from a general healthy population, we investigated the associations of NT-proBNP levels with age, sex, and obesity-related parameters. The study showed that females have higher NT-proBNP levels than males, aging is related to an increase in NT-proBNP levels, and an increase in obesity-related parameters is associated with lower NT-proBNP levels. In an adjusted multivariable analysis, abdominal obesity (WC) was associated with lower NT-proBNP levels in females but not in males. BMI was the only parameter associated with low levels of NT-proBNP in both sexes after multivariable adjustment.
In the general population, circulating NT-proBNP concentrations are higher in females than males. In the present study, when stratified by sex, female sex was associated with higher NT-proBNP levels than male sex. Many studies have identified additional contributing factors to higher natriuretic peptide concentrations in females,4,8,9
but the mechanism underlying this association is still not well understood. Currently, there is strong evidence that sex hormones modulate plasma concentrations of natriuretic peptides. Generally, testosterone suppresses natriuretic peptide concentrations and estrogens may increase natriuretic peptides concentrations.10–12
Past studies have shown that natriuretic peptides concentrations are higher in the elderly,13,14
and suggested that changes in BNP production, secretion, or degradation may occur with aging.4
Because existing guidelines use a single NT-proBNP cut-off value without distinction for age, many elderly patients may be misdiagnosed as having elevated natriuretic peptide levels, which may lead to substantially increased costs for further diagnosis or investigation. In the present study, NT-proBNP concentrations increased with age in the overall population, and this pattern remained identical when stratified by sex. However, females showed a weaker relationship between increasing age and increases in NT-proBNP than males. Therefore, it may be beneficial to consider both sex and age when interpreting NT-proBNP results.
Previous studies have recently shown a consistent inverse relationship between obesity and circulating BNP concentrations.15,16
A number of hypotheses have been postulated to explain the inverse relationship between obesity and circulating natriuretic peptide concentrations. Obesity may decrease BNP synthesis,17
secretion, and activity; it may promote clearance by expressing more natriuretic peptide clearance receptors;16
or it may impair the BNP signaling pathway.18
Nonetheless, there is currently no conclusive evidence in favor of any particular hypothesis. In the present study, obesity-related parameters (WC, BMI, and weight) were related to lower NT-proBNP concentrations in a multivariable analysis adjusted for age, hemoglobin, renal function, and other baseline demographics regardless of sex (Models 1 and 2). Males had a weaker inverse relationship between obesity and NT-proBNP concentrations than females. After adjusting for BMI, WC was no longer associated with NT-proBNP in males, whereas in females it still exhibited a strong inverse correlation. However, BMI was associated with lower NT-proBNP concentrations in both males and females after adjusting for other obesity-related parameters. Currently, both BMI and WC are recommended measures of obesity, and it is unclear which of the 2 is better correlated with NT-proBNP levels. Recent data from Suthahar et al showed that in a general population, sex-related decreased in NT-proBNP levels were more prominent than obesity-associated reductions.5
Suthahar et al showed that all obesity-related parameters had a strong inverse association with NT-proBNP in females and a weaker inverse association in males.5
After correcting for BMI, WC was no longer correlated with NT-proBNP levels in males, whereas the inverse association remained in females. These results are in agreement with those of the present study, suggesting that BMI is a more useful predictor of circulating NT-proBNP concentrations in healthy individuals. Women have a higher percentage of fat than men.19
For the same BMI, females have approximately 10% higher body fat than males,20
which may suggest a lower NT-proBNP concentration. In addition, women and men have different body fat distribution, with women tending to accumulate fat around the hips, buttocks, and thighs, whereas men have a larger intra-abdominal (visceral) fat mass. Although weight, BMI, and WC are highly sex dependent, the findings of the present study do not suggest that the association between levels of natriuretic peptide and central obesity (increased WC) are mediated exclusively by sex because the results were obtained from multivariable models independent of sex and trends were consistent in male and female subgroups, although the association was weak in males.
A recent study of participants in the Framingham Heart Study similarly found inverse associations between NT-proBNP and visceral fat in a multivariable adjusted analysis including BMI, with no independent association seen with abdominal subcutaneous fat.21
Therefore, a more comprehensive study is required to demonstrate the exact association between sex and body fat distribution with NT-proBNP. Similar findings were published in the Suita study, which used multivariable regression analysis to examine 1,759 subjects from urban areas in Japan without heart disease and reported an inverse association between BMI and BNP levels in both sexes (P<0.01).22
All obesity-related parameters were associated with a decrease in NT-proBNP levels, but in clinical practice, these parameters or BMI-corrected WC are not widely considered when interpreting NT-proBNP results.
Strengths and Limitations
The present study has strengths and limitations that should be considered when interpreting the findings. One strength of the study is the large number of subjects. In addition, because we excluded individuals with hypertension, coronary disease, or diabetes, the likelihood of including subjects with underlying heart disease was reduced. Asians tend to have lower BMI and different body fat distribution than Westerners, and our results demonstrating an inverse relationship between BMI and NT-proBNP showed that these associations remain valid in a cross-cultural setting.
Due to the cross-sectional design of the study, the results cannot be interpreted as a causal relationship and should be considered as hypothesis generating. Because the KSHS includes relatively young individuals, there may be limitations in directly applying our results to elderly people. Further comprehensive studies are needed to determine the complex relationships between various demographics and natriuretic peptide levels.
Conclusions
In this large sample of young and healthy Asians, younger age, male sex, and an increase in obesity-related parameters were related to lower NT-proBNP levels. Further comprehensive studies are needed to understand the significance of NT-proBNP levels in different populations.
Sources of Funding
This study did not receive any specific funding.
Disclosures
All authors take responsibility for all aspects of the reliability and freedom from bias of the data presented and their discussed interpretation. The authors declare that there are no conflicts of interest.
IRB Information
This study was approved by the Institutional Review Board of Kangbuk Samsung Hospital (Reference no. KBSMC 2018-06-001).
Supplementary Files
Please find supplementary file(s);
http://dx.doi.org/10.1253/circj.CJ-20-1104
References
- 1.
Horwich TB, Hamilton MA, Fonarow GC. B-type natriuretic peptide levels in obese patients with advanced heart failure. J Am Coll Cardiol 2006; 47: 85–90.
- 2.
Maisel AS, Clopton P, Krishnaswamy P, Nowak RM, McCord J, Hollander JE, et al. Impact of age, race, and sex on the ability of B-type natriuretic peptide to aid in the emergency diagnosis of heart failure: Results from the Breathing Not Properly (BNP) Multinational Study. Am Heart J 2004; 147: 1078–1084.
- 3.
McCullough PA, Duc P, Omland T, McCord J, Nowak RM, Hollander JE, et al. B-Type natriuretic peptide and renal function in the diagnosis of heart failure: An analysis from the Breathing Not Properly Multinational Study. Am J Kidney Dis 2003; 41: 571–579.
- 4.
Redfield MM, Rodeheffer RJ, Jacobsen SJ, Mahoney DW, Bailey KR, Burnett JC Jr. Plasma brain natriuretic peptide concentration: Impact of age and gender. J Am Coll Cardiol 2002; 40: 976–982.
- 5.
Suthahar N, Meijers WC, Ho JE, Gansevoort RT, Voors AA, van der Meer P, et al. Sex-specific associations of obesity and N-terminal pro-B-type natriuretic peptide levels in the general population. Eur J Heart Fail 2018; 20: 1205–1214.
- 6.
Clerico A, Zaninotto M, Passino C, Plebani M. Obese phenotype and natriuretic peptides in patients with heart failure with preserved ejection fraction. Clin Chem Lab Med 2018; 56: 1015–1025.
- 7.
Sung KC, Ryu S, Lee JY, Kim JY, Wild SH, Byrne CD. Effect of exercise on the development of new fatty liver and the resolution of existing fatty liver. J Hepatol 2016; 65: 791–797.
- 8.
Wang TJ, Larson MG, Levy D, Leip EP, Benjamin EJ, Wilson PW, et al. Impact of age and sex on plasma natriuretic peptide levels in healthy adults. Am J Cardiol 2002; 90: 254–258.
- 9.
Abdullah SM, Khera A, Das SR, Stanek HG, Canham RM, Chung AK, et al. Relation of coronary atherosclerosis determined by electron beam computed tomography and plasma levels of N-terminal pro-brain natriuretic peptide in a multiethnic population-based sample (the Dallas Heart Study). Am J Cardiol 2005; 96: 1284–1289.
- 10.
Chang AY, Abdullah SM, Jain T, Stanek HG, Das SR, McGuire DK, et al. Associations among androgens, estrogens, and natriuretic peptides in young women: Observations from the Dallas Heart Study. J Am Coll Cardiol 2007; 49: 109–116.
- 11.
Glisic M, Rojas LZ, Asllanaj E, Vargas KG, Kavousi M, Ikram MA, et al. Sex steroids, sex hormone-binding globulin and levels of N-terminal pro-brain natriuretic peptide in postmenopausal women. Int J Cardiol 2018; 261: 189–195.
- 12.
Lam CS, Cheng S, Choong K, Larson MG, Murabito JM, Newton-Cheh C, et al. Influence of sex and hormone status on circulating natriuretic peptides. J Am Coll Cardiol 2011; 58: 618–626.
- 13.
Yancy CW, Jessup M, Bozkurt B, Butler J, Casey DE Jr, Colvin MM, et al. 2017 ACC/AHA/HFSA focused update of the 2013 ACCF/AHA Guideline for the Management of Heart Failure: A report of the American College of Cardiology/American Heart Association Task Force on Clinical Practice Guidelines and the Heart Failure Society of America. J Card Fail 2017; 23: 628–651.
- 14.
Richards AM. The relationship of plasma NT-proBNP to age and outcomes in heart failure. JACC Heart Fail 2016; 4: 746–748.
- 15.
Ponikowski P, Voors AA, Anker SD, Bueno H, Cleland JGF, Coats AJS, et al. 2016 ESC guidelines for the diagnosis and treatment of acute and chronic heart failure: The Task Force for the Diagnosis and Treatment of Acute and Chronic Heart Failure of the European Society of Cardiology (ESC) Developed with the special contribution of the Heart Failure Association (HFA) of the ESC. Eur Heart J 2016; 37: 2129–2200.
- 16.
Madamanchi C, Alhosaini H, Sumida A, Runge MS. Obesity and natriuretic peptides, BNP and NT-proBNP: Mechanisms and diagnostic implications for heart failure. Int J Cardiol 2014; 176: 611–617.
- 17.
Gruden G, Landi A, Bruno G. Natriuretic peptides, heart, and adipose tissue: New findings and future developments for diabetes research. Diabetes Care 2014; 37: 2899–2908.
- 18.
Cabiati M, Raucci S, Liistro T, Belcastro E, Prescimone T, Caselli C, et al. Impact of obesity on the expression profile of natriuretic peptide system in a rat experimental model. PLoS One 2013; 8: e72959.
- 19.
Manolopoulos KN, Karpe F, Frayn KN. Gluteofemoral body fat as a determinant of metabolic health. Int J Obes (Lond) 2010; 34: 949–959.
- 20.
Jackson AS, Stanforth PR, Gagnon J, Rankinen T, Leon AS, Rao DC, et al. The effect of sex, age and race on estimating percentage body fat from body mass index: The Heritage Family Study. Int J Obes Relat Metab Disord 2002; 26: 789–796.
- 21.
Cheng S, Fox CS, Larson MG, Massaro JM, McCabe EL, Khan AM, et al. Relation of visceral adiposity to circulating natriuretic peptides in ambulatory individuals. Am J Cardiol 2011; 108: 979–984.
- 22.
Sugisawa T, Kishimoto I, Kokubo Y, Makino H, Miyamoto Y, Yoshimasa Y. Association of plasma B-type natriuretic peptide levels with obesity in a general urban Japanese population: The Suita Study. Endocr J 2010; 57: 727–733.


