Abstract
Background:
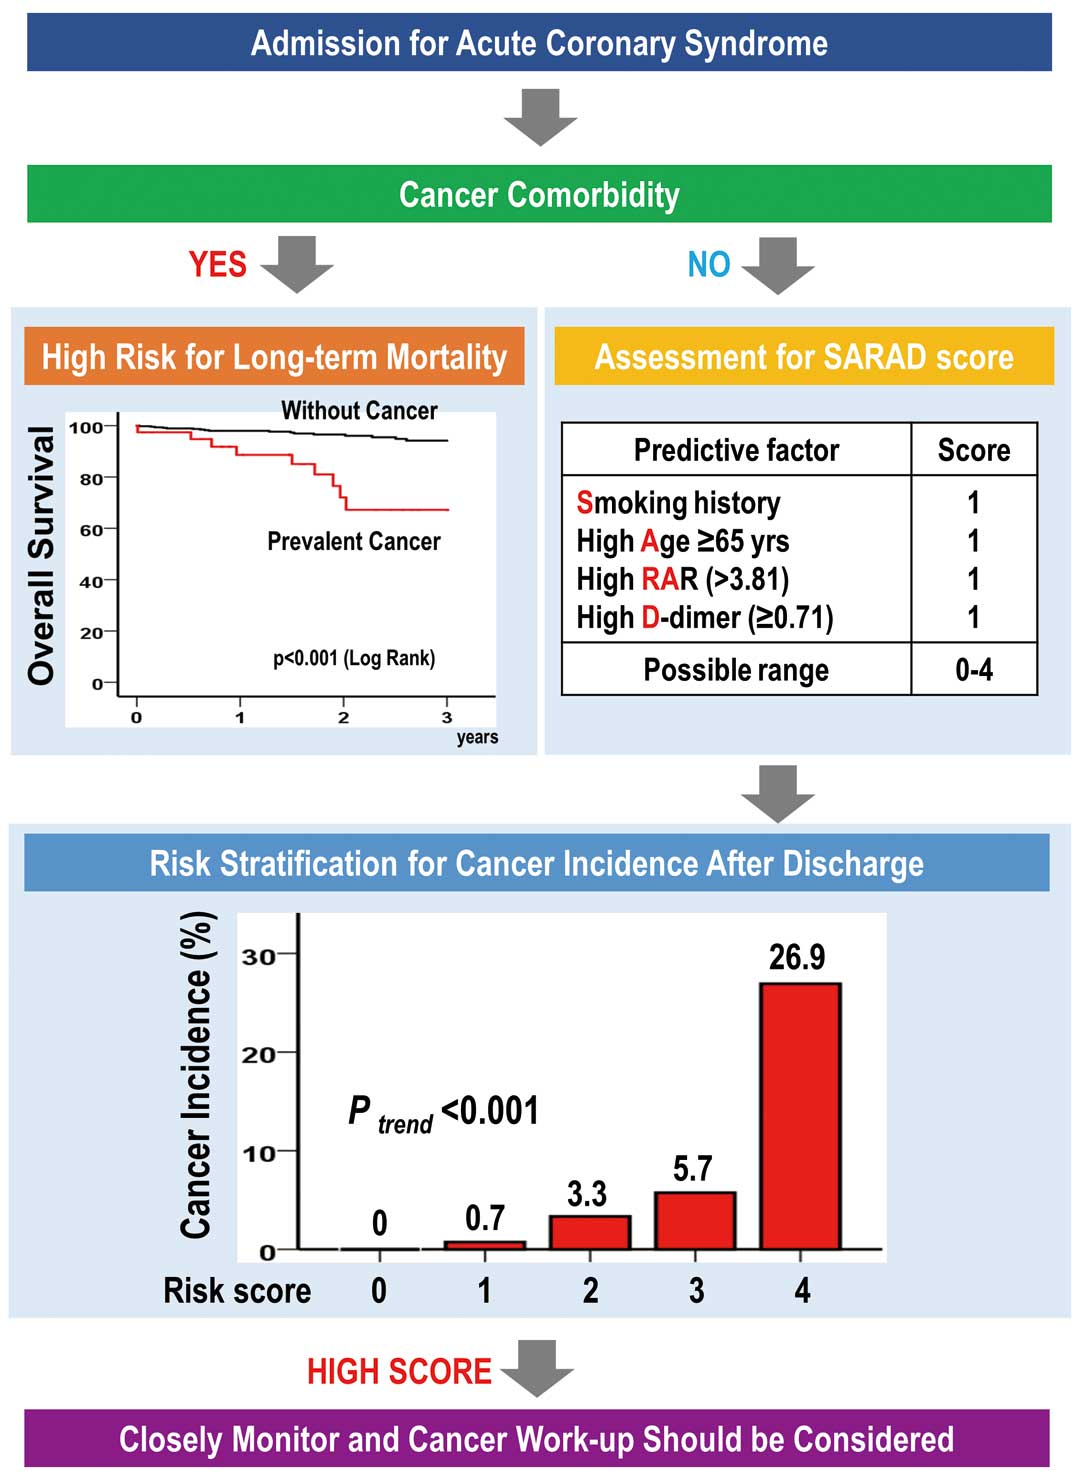
Cancer is a known prognostic factor in patients with acute coronary syndrome (ACS), but few risk assessments of cancer development after ACS have been established.
Methods and Results:
Of the 573 consecutive ACS admissions between January 2015 and March 2018 in Nobeoka City, Japan, 552 were analyzed. Prevalent cancer was defined as a treatment history of cancer, and incident cancer as post-discharge cancer incidence. The primary endpoint was post-discharge cancer incidence, and the secondary endpoint was all-cause death during follow-up. All-cause death occurred in 9 (23.1%) patients with prevalent cancer, and in 17 (3.5%) without cancer. In the multivariable analysis, prevalent cancer was associated with all-cause death. To develop the prediction model for cancer incidence, 21 patients with incident cancer and 492 without cancer were analyzed. We compared the performance of D-dimer with that of the prediction model, which added age (≥65 years), smoking history, and high red blood cell distribution width to albumin ratio (RAR) to D-dimer. The areas under the receiver-operating characteristics curves of D-dimer and the prediction model were 0.619 (95% confidence interval: 0.512–0.725) and 0.774 (0.676–0.873), respectively. Decision curve analysis showed superior net benefits of the prediction model.
Conclusions:
By adding elderly, smoking, and high RAR to D-dimer to the prediction model it became clinically useful for predicting cancer incidence after ACS.
With the super-aging of society, the number of patients with cardiovascular disease (CVD), such as acute coronary syndrome (ACS), and cancer, which are the leading causes of death, has increased,1
which not only worsens the prognosis and quality of life of patients but also carries an economic cost.2,3
CVD and cancer appear to be unrelated, but accumulating evidence has revealed shared risk factors and biological pathways.4
A previous review showed that obesity, diabetes mellitus (DM), hypertension, smoking, unhealthy diet, and low physical activity are known risk factors for both diseases.4
Controlling modifiable risk factors may prevent not only ACS but also cancer incidence.5,6
However, patients who already have CVD, such as ACS, have advanced risk factors, and cancer development may have progressed without manifestations because of the common biological mechanism between the 2 diseases. Because cancer comorbidity is a negative predictor of long-term prognosis in patients with CVD,7–10
early detection of occult cancer is vital. Recent studies have reported the association of some laboratory markers with future cancer incidence after ACS admission;11,12
however, information regarding the prediction of cancer development after ACS is limited.
Hence, in this study, we conducted a hospital-based retrospective cohort study to reconfirm the association of cancer with long-term prognosis in patients with ACS and to develop a risk prediction model for cancer incidence after ACS in a super-aging society.
Methods
Study Design, Setting, and Participants
The Nobeoka Heart Study is a population-based cohort study consisting of a cohort of inpatients with ACS and heart failure admitted to Miyazaki Prefectural Nobeoka Hospital, which is the only hospital with a cardiac catheterization room in Nobeoka City and suburbs, covering a medical care zone of ≈230,000 residents.13
Thus, almost all patients with ACS in the medical care zone were transferred to the hospital for treatment.
Between January 2015 and March 2018, 573 consecutive inpatients with ACS admitted to the hospital were enrolled by reviewing their main discharge diagnosis in the medical records. ACS, including ST-segment elevation myocardial infarction (STEMI), non-STEMI, and unstable angina, was diagnosed by a cardiologist based on the patient’s chest pain or discomfort, ECG, echocardiography, and cardiac biomarkers according to the Third Universal Definition of Myocardial Infarction.14
Of the 573 patients, 21 were excluded because of in-hospital death (n=17) or readmission (n=4). Thus, 552 patients with ACS were analyzed.
This study was conducted in accordance with the Declaration of Helsinki and its amendments. The ethics committees at Miyazaki Prefectural Nobeoka Hospital (no. 20190911-1) and National Cerebral and Cardiovascular Center (no. M30-007-6) approved the study protocol. The study was exempted from the requirement for individual informed consent because of the opt-out policy (i.e., participants were notified through the website (https://nobeoka-kenbyo.jp/info/patient/20190215/1259/) and could refuse enrollment to the study).
Data Collection
Patients’ baseline demographics, clinical data, angiographic findings, and laboratory data during hospitalization for ACS were obtained from their medical records. For the laboratory data, a peripheral blood sample was collected before discharge: the timing of blood sampling was as follows: 5 days after admission for patients with acute myocardial infarction (AMI) having a smaller infarct size, 10–12 days for patients with AMI having a larger infarct size, or 1–2 days for patients with unstable angina. We calculated the ratios between red blood cell distribution width (RDW) and platelets, neutrophils and lymphocytes, platelets and lymphocytes, lymphocytes and monocytes, C-reactive protein (CRP) and albumin, and the RDW and albumin. The risk factors for coronary artery disease, such as current or past history of smoking, hypertension, dyslipidemia, DM, and chronic kidney disease (CKD), were as defined previously.15,16
For cancer status, the medical treatment history of previous and current cancer, cancer type, and primary site were confirmed by reviewing the medical records, as previously described.17,18
Prevalent cancer was defined as previous or current history of cancer, and patients were divided into (1) current or recent cancer or (2) non-recent cancer groups. Patients with current cancer were those who planning to undergo treatment or currently undergoing treatment for cancer, and patients with recent cancer were those who had completed treatment within 1 year. In contrast, patients with non-recent cancer were those who had completed treatment >1 year ago, as described previously.7
Incident cancer was defined as cancer incidence after hospital discharge.
Outcome Definition
For the survival analysis, the primary endpoint was all-cause death during the follow-up period (≤3 years or until March 2020). For the risk prediction model development, the primary endpoint was cancer incidence after ACS (i.e., post discharge and during the follow-up period). In addition to the information available in the medical records, follow-up data were obtained from the patients, their families, or their family physicians by direct interview or telephone. The cause of death was also confirmed for patients who died.
Statistical Analysis
Categorical variables are expressed as frequencies and percentages; continuous variables, as median and interquartile range. Group comparisons were performed using the chi-square test or Fisher’s exact test for categorical variables, the Mann-Whitney U test for continuous variables, and the log-rank test for all-cause death-free survival curves. Hazard ratios (HR) and 95% confidence intervals (CI) were calculated using a Cox proportional hazards regression model to estimate the effect of cancer on all-cause death. Well-known prognostic factors9,19,20
and variables with P<0.05, including baseline characteristics (age, sex, or body mass index [BMI]), comorbidities (hemodialysis, peripheral artery disease), and laboratory data (ejection fraction [EF], hemoglobin [Hb], D-dimer, RDW to albumin ratio [RAR]), in the univariate analysis were entered in the final multivariable model. The low number of outcomes limited the number of variables in the multivariable model; thus, some multivariable analyses using the forced entry method, the stepwise backward selection method, or propensity score-adjusted model were conducted to confirm the robustness of the prognostic effect of cancer on the outcome. The predicted probability of prevalent cancer was calculated by fitting a logistic regression model, using variables entered in the final multivariable model. Laboratory markers, such as Hb, D-dimer, or RAR, were categorized according to clinically relevant cutoff or optimal cut-point, which was calculated using the Youden index method. To explore the mechanistic pathway of how cancer affects the outcome of patients with ACS, mediation analysis using a regression-based approach was performed, as previously described.21,22
Moreover, to determine the clinical variables for our risk prediction model, a sparse logistic regression model using an elastic net was used. Based on the Akaike Information Criterion, we selected the appropriate explanatory variables from all variables, including baseline characteristics (age, sex, BMI, smoking habit, ACS type, and medication), comorbidities (hypertension, dyslipidemia, DM, CKD, hemodialysis, peripheral artery disease, prior MI, heart failure, atrial fibrillation, and chronic obstructive pulmonary disease), angiographic findings (culprit lesion and revascularization), and laboratory data (EF, Hb, albumin, platelets, CRP, RDW, RAR, and D-dimer). Laboratory markers, such as EF, Hb, albumin, platelets, CRP, RDW, RAR, or D-dimer, were categorized according to clinically relevant cutoff or optimal cut-point for cancer incidence as outcome, which was calculated using the Youden index method. The variables selected in the sparse logistic model with an elastic net (elderly, smoking history, high D-dimer, high RDW, high RAR) were entered into the multivariable logistic regression models with the forced entry method, and their odds ratios and 95% CIs were calculated. The performance of the final risk prediction model was assessed using a receiver-operating characteristic analysis, a calibration plot, and the Hosmer-Lemeshow test. In addition, for right-censored data, the Greenwood-Nam-D’Agostino test was performed. Comparison of the performance of the risk prediction model with that of the conventional risk factor D-dimer11
was performed by category-free net reclassification improvement (NRI), integrated discrimination improvement (IDI), and decision curve analysis (DCA).23–25
A risk scoring system for the prediction of cancer incidence after ACS was developed using the variables in the risk prediction model; 1 point was assigned for each of the variables. The risk score was calculated from the sum of the points. Validity of the risk scoring system was assessed by the
k-fold cross-validation. A two-sided P<0.05 indicated a significant difference. Statistical analyses were performed with SPSS version 23.0 (IBM Corp., Armonk, NY, USA), SAS version 9.4 (SAS Institute, Cary, NC, USA), and R software V.3.6.3 (http://www.r-project.org).
Results
Baseline Characteristics in the Survival Analysis Cohort
Among the 552 patients with ACS, 39 with prevalent cancer and 492 without cancer were included in the survival analysis (Supplementary Figure 1). The demographic and angiographic characteristics, laboratory findings, and treatments are presented in
Supplementary Table 1. Patients with prevalent cancer tended to be older and more likely to have low BMI and receive anticoagulation therapy than those without cancer. In the prevalent cancer group, the prostate, colon/rectum, and lungs were the most common primary cancer sites (Supplementary Figure 2).
Prognostic Impact of Cancer in Patients With ACS
During the follow-up period of up to 3 years after discharge, all-cause death occurred in 9 (23.1%) patients with prevalent cancer and in 17 (3.5%) patients without cancer. Details of the causes of death are summarized in
Supplementary Table 2. The Kaplan-Meier survival curve showed that the 3-year survival free from all-cause death was worse in patients with prevalent cancer than in those without cancer (Supplementary Figure 3). In addition, survival free from death tended to be worse in patients with current or recent cancer than in those with non-recent cancer; however, the difference was not significant (Supplementary Figure 3). Univariate and multivariable Cox proportional hazard models adjusted for known risk factors showed prevalent cancer, current or recent cancer, and non-recent cancer as independent prognostic factors for all-cause death (Table 1A,B). Moreover, the multivariable model identified a positive association of underweight, anemia, and high RAR as inflammatory markers with all-cause death (Table 1A,B).
Table 1.
(A) Association of Prevalent Cancer With All-Cause Death in the Cox Proportional Hazard Regression Model, (B) Association of Current or Recent and Non-Recent Cancer With All-Cause Death in the Cox Proportional Hazard Regression Model
| |
Univariate |
Multivariable |
| Forced entry model 1 |
Forced entry model 2 |
Forced entry model 3 |
Forced entry model 4 |
Stepwise model |
Propensity score-adjusted* |
| HR (95% CI) |
HR (95% CI) |
P value |
HR (95% CI) |
P value |
HR (95% CI) |
P value |
HR (95% CI) |
P value |
HR (95% CI) |
P value |
HR (95% CI) |
P value |
| (A) |
| Prevalent cancer |
6.41 (2.86, 14.3) |
6.80 (2.89, 16.0) |
<0.001 |
7.15 (3.05, 16.8) |
<0.001 |
7.46 (3.28, 17.0) |
<0.001 |
6.98 (3.06, 15.9) |
<0.001 |
6.83 (2.95, 15.8) |
<0.001 |
6.68 (2.91, 15.3) |
<0.001 |
| Age (by 10 years) |
1.40 (0.98, 2.00) |
0.85 (0.55, 1.32) |
0.473 |
– |
– |
– |
– |
– |
– |
NS |
|
– |
– |
| Female |
1.33 (0.59, 2.98) |
1.11 (0.48, 2.56) |
0.813 |
– |
– |
– |
– |
– |
– |
NS |
|
– |
– |
| BMI |
| <18.5 |
5.50 (2.46, 12.3) |
6.91 (2.88, 16.6) |
<0.001 |
– |
– |
– |
– |
4.54 (1.91, 10.7) |
0.001 |
4.70 (1.95, 11.3) |
0.001 |
– |
– |
| ≥18.5, <25 |
Ref. |
Ref. |
Ref. |
– |
– |
– |
– |
Ref. |
Ref. |
Ref. |
Ref. |
– |
– |
| ≥25 |
0.11 (0.01, 0.83) |
0.11 (0.02, 0.89) |
0.039 |
– |
– |
– |
– |
0.15 (0.02, 1.12) |
0.064 |
0.18 (0.02, 1.36) |
0.096 |
– |
– |
| Hemodialysis |
8.48 (2.92, 24.7) |
– |
– |
9.38 (2.26, 38.9) |
0.002 |
– |
– |
– |
– |
10.0 (3.22, 31.2) |
<0.001 |
– |
– |
| Peripheral artery disease |
3.92 (0.93, 16.6) |
– |
– |
0.74 (0.10, 5.32) |
0.767 |
– |
– |
– |
– |
NS |
|
– |
– |
| LV dysfunction (EF <40%) |
2.90 (0.995, 8.46) |
– |
– |
1.82 (0.50, 6.59) |
0.360 |
– |
– |
– |
– |
NS |
|
– |
– |
| Anemia (Hb <10) |
5.52 (2.39, 12.7) |
– |
– |
– |
– |
3.54 (1.43, 8.76) |
0.006 |
2.50 (1.01, 6.16) |
0.047 |
NS |
|
– |
– |
| High D-dimer (>1) |
5.13 (2.16, 12.2) |
– |
– |
– |
– |
3.27 (1.24, 8.62) |
0.017 |
– |
– |
3.68 (1.44, 9.38) |
0.006 |
– |
– |
| High RAR (>3.53) |
3.68 (1.69, 8.01) |
– |
– |
– |
– |
1.57 (0.67, 3.67) |
0.301 |
2.50 (1.14, 5.49) |
0.023 |
NS |
|
– |
– |
| (B) |
| Cancer status |
| Without cancer |
Ref. |
Ref. |
Ref. |
Ref. |
Ref. |
Ref. |
Ref. |
Ref. |
Ref. |
Ref. |
Ref. |
Ref. |
Ref. |
| Non-recent cancer |
3.85 (1.30, 11.4) |
4.09 (1.29, 13.0) |
0.017 |
3.69 (1.15, 11.8) |
0.028 |
4.41 (1.45, 13.5) |
0.009 |
4.13 (1.33, 12.8) |
0.014 |
3.00 (0.95, 9.50) |
0.062 |
3.69 (1.21, 11.2) |
0.021 |
| Current or recent cancer |
13.6 (5.03, 37.0) |
12.8 (4.26, 38.7) |
<0.001 |
19.6 (6.98, 54.8) |
<0.001 |
15.0 (5.44, 41.1) |
<0.001 |
13.6 (4.67, 39.7) |
<0.001 |
24.3 (7.66, 77.3) |
<0.001 |
16.5 (6.01, 45.5) |
<0.001 |
| Age (by 10 years) |
1.40 (0.98, 2.00) |
0.87 (0.56, 1.36) |
0.545 |
– |
– |
– |
– |
– |
– |
NS |
|
– |
– |
| Female |
1.33 (0.59, 2.98) |
1.35 (0.55, 3.31) |
0.510 |
– |
– |
– |
– |
– |
– |
NS |
|
– |
– |
| BMI |
| <18.5 |
5.50 (2.46, 12.3) |
5.33 (2.09, 13.6) |
<0.001 |
– |
– |
– |
– |
3.89 (1.60, 9.44) |
0.003 |
3.27 (1.26, 8.49) |
0.015 |
– |
– |
| ≥18.5, <25 |
Ref. |
Ref. |
Ref. |
– |
– |
– |
– |
Ref. |
Ref. |
Ref. |
Ref. |
– |
– |
| ≥25 |
0.11 (0.01, 0.83) |
0.10 (0.01, 0.75) |
0.026 |
– |
– |
– |
– |
0.11 (0.01, 0.88) |
0.038 |
0.13 (0.02, 1.04) |
0.054 |
– |
– |
| Hemodialysis |
8.48 (2.92, 24.7) |
– |
– |
10.2 (2.59, 40.3) |
0.001 |
– |
– |
– |
– |
9.49 (2.96, 30.4) |
<0.001 |
– |
– |
| Peripheral artery disease |
3.92 (0.93, 16.6) |
– |
– |
1.14 (0.17, 7.44) |
0.892 |
– |
– |
– |
– |
NS |
|
– |
– |
| LV dysfunction (EF <40%) |
2.90 (0.995, 8.46) |
– |
– |
1.71 (0.51, 5.69) |
0.384 |
– |
– |
– |
– |
NS |
|
– |
– |
| Anemia (Hb <10) |
5.52 (2.39, 12.7) |
– |
– |
– |
– |
3.04 (1.22, 7.55) |
0.017 |
2.17 (0.87, 5.42) |
0.098 |
NS |
|
– |
– |
| High D-dimer (>1) |
5.13 (2.16, 12.2) |
– |
– |
– |
– |
3.53 (1.34, 9.29) |
0.011 |
– |
– |
3.60 (1.32, 9.80) |
0.012 |
– |
– |
| High RAR (>3.53) |
3.68 (1.69, 8.01) |
– |
– |
– |
– |
1.74 (0.76, 3.99) |
0.188 |
3.00 (1.32, 6.85) |
0.009 |
2.19 (0.87, 5.50) |
0.096 |
– |
– |
*Adjusted for propensity score calculated variables such as baseline characteristics (age, sex, or BMI), comorbidities (hemodialysis, peripheral artery disease), and laboratory data (EF, Hb, D-dimer, or RAR). BMI, body mass index; CI, confidence interval; EF, ejection fraction; Hb, hemoglobin; HR, hazard ratio; LV, left ventricular; NS, not selected; RAR, red blood cell distribution width to albumin ratio.
To determine whether underweight, anemia, and inflammation were mediators of the association of cancer with all-cause death, exploratory parallel mediation analyses were performed (Supplementary Figure 4). The results of the mediation analyses of the direct and indirect effects of cancer on all-cause death are shown in
Supplementary Table 3. The indirect effects of cancer through underweight, anemia, and inflammation were insignificant; thus, these conditions were not mediators of the association of cancer with all-cause death.
Baseline Characteristics in the Prediction Model Development Cohort
For the development of the risk prediction model, 21 patients with incident cancer and 492 without cancer were analyzed (Supplementary Figure 1). Their demographic and angiographic characteristics, laboratory findings, and treatments are presented in
Supplementary Table 4. The patients with incident cancer tended to have hypertension and were more likely to have a past or current history of smoking than those without cancer. In the incident cancer group, the colon/rectum, stomach, prostate, and bladder were the most common primary cancer sites (Supplementary Figure 2), and the patients were diagnosed at a median time of 11.5 months after discharge (Supplementary Figure 5). The age-adjusted incidence rate (/100,000 people) of cancer in patients with ACS was 928.5 (Supplementary Table 5).
Development of Risk Prediction Model for Incident Cancer
Among the variables, such as patient demographic and angiographic characteristics and laboratory findings, age ≥65 years, past or current history of smoking, high D-dimer level (≥0.71), high RAR (>3.81), and high RDW (>14.5) were identified as positive predictors of incident cancer based on the sparse logistic regression analysis with elastic net. High RDW was excluded from the final risk prediction model because of its significant positive correlation with high RAR (Table 2).
Table 2.
Univariate and Multivariable Analysis for Predictors of Incident Cancer After ACS
| |
Univariate |
Multivariable |
| Elastic net |
Forced entry model 1 |
Forced entry model 2 |
| OR (95% CI) |
P value |
Standardized
coefficient |
OR (95% CI) |
P value |
OR (95% CI) |
P value |
| Elderly (age ≥65 years) |
4.49 (1.03, 19.5) |
0.045 |
0.0235 |
4.46 (0.96, 20.7) |
0.057 |
4.64 (1.00, 21.5) |
0.050 |
| Smoking history |
2.74 (0.91, 8.28) |
0.073 |
0.0438 |
5.23 (1.67, 16.4) |
0.005 |
5.29 (1.69, 16.6) |
0.004 |
| High D-dimer (≥0.71) |
3.70 (1.23, 11.2) |
0.020 |
0.0046 |
2.49 (0.76, 8.17) |
0.131 |
2.73 (0.84, 8.86) |
0.094 |
| High RAR (>3.81) |
3.86 (1.57, 9.46) |
0.003 |
0.0405 |
2.99 (1.14, 7.79) |
0.025 |
NS* |
|
| High RDW (>14.5) |
3.94 (1.52, 10.2) |
0.005 |
0.0667 |
NS* |
|
3.12 (1.14, 8.55) |
0.027 |
Model 1: Hosmer-Lemeshow test; chi-square 1.340, P=0.969. Model 2: Hosmer-Lemeshow test; chi-square 1.624, P=0.951. *Significant positive correlation was observed between high RAR and RDW. Spearman’s rank correlation coefficient (r)=0.596. ACS, acute coronary syndrome; CI, confidence interval; NS, not selected; OR, odds ratio; RAR, red blood cell distribution width to albumin ratio; RDW, red blood cell distribution width.
For the risk prediction model for cancer incidence, the area under the curve (AUC) was 0.774 (95% CI 0.676–0.873), the Hosmer-Lemeshow goodness-of-fit chi-square was 1.493 (P=0.993), and the Greenwood-Nam-D’Agostino test chi-square was 1.707 (P=0.635); these values indicated that the prediction model had good discrimination and calibration (Supplementary Figure 6). The AUC of D-dimer, which is an established predictor of cancer incidence and mortality,11
was 0.619 (95% CI 0.512–0.725). Combining old age, smoking history, and RAR with D-dimer resulted in an overall category-free NRI of 0.747 (95% CI 0.335–1.159) and IDI of 0.069 (95% CI 0.031–0.108) (Supplementary Table 6).
Results of the DCA for both D-dimer alone and the prediction model for cancer incidence in patients with ACS are shown in
Figure 1. With threshold probabilities of 0–5%, both D-dimer and the prediction model were clinically useful; nevertheless, the prediction model showed the maximum net benefit with threshold probabilities of 5–20%. To confirm the robustness of these findings, a 4-fold cross-validation was performed. The cross-validated decision curve showed a similar standardized net benefit at each threshold probability (Figure 1).
Scoring System for Cancer Incidence
For the development of a simple predictive model, smoking history, age ≥65 years, high RAR, and high D-dimer level (SARAD) were assigned 1 point each in the SARAD scoring system. The prediction score was calculated from the sum of the risks present. The SARAD score ranged from 0 to 4 points. The distribution of the score and the corresponding cancer incidence are shown in
Figure 2. A higher risk score tended to be associated with a higher risk of cancer incidence. The AUC of the SARAD score was 0.760 (95% CI 0.656–0.864), which was almost similar to the cross-validated AUC (Supplementary Table 7). Moreover, the Hosmer-Lemeshow goodness-of-fit chi-square was 1.622 (P=0.991), and the Greenwood-Nam-D’Agostino test chi-square was 2.540 (P=0.468).
Discussion
This study reconfirmed that cancer comorbidity is associated with poor long-term prognosis in patients with ACS, which is consistent with previous reports.8–11
This study also identified smoking history, age ≥65 years, high RAR, and high D-dimer level as positive predictors of cancer incidence. Among the patients with ACS and these 4 predictors, 25% developed cancer after discharge. Thus, the SARAD risk score system, which included the aforementioned predictors, may be used to predict cancer incidence in patients hospitalized for ACS (Figure 3).
CVD and cancer are leading causes of death, especially in a super-aging society. The Global Burden of Disease Study 2017 showed that CVD is associated with the highest number of deaths (≈17.8 million), followed by neoplasms (9.56 million).1
In addition, total deaths due to CVD increased by 21.1%, with a 25.4% increase in those with cancer, although a decrease in the overall mortality rates was observed. Especially in developed countries with a super-aging society, the disease burden of CVD or cancer may be increasing. Because almost all risk factors for these diseases are shared,4
patients may experience 1 of the diseases and subsequently develop the other, or may have both simultaneously.
Tabata et al investigated the prevalence of cancer comorbidity, the 1-year outcome of cancer, and the influence of cancer on the risk of cardiovascular events in patients undergoing percutaneous coronary intervention.7
In their single-center observational study of 701 patients with drug-eluting stent implantation, they showed that 16.3% of the patients had a medical history of malignant disease, which was positively associated with a high risk of target lesion revascularization, cardiovascular events, and all-cause death. In our study, 7.1% of the patients with ACS had prevalent cancer. The smaller prevalence in our study could be attributed to the difference in the study population between our study and the previous study (i.e., ACS only vs. ischemic heart disease including acute and chronic coronary syndrome, respectively). Another single-center prospective study of 1,819 patients with ACS showed a cancer prevalence of 3.4%,8
and a retrospective study including 6,068 patients showed a prevalence of 9.6%,26
which is almost consistent with the result of our study.
As regards the effect of cancer on the prognosis of patients with ACS, almost all studies show that cancer comorbidity is associated with poor prognosis.8–10,26,27
A previous study showed that prevalent and incident cancers are strongly associated with a high risk of all-cause death, which increased by 4- or 5-fold.8
The French registry on acute STEMI or non-STEMI showed that non-cardiovascular death occurred more frequently during the first 1 year, and the HR for non-cardiovascular death before 12 months in AMI survivors with a history of cancer was 5.08 (95% CI 2.84–9.09).10
Similarly, our study showed that patients with ACS with prevalent cancer had a 6- or 7-fold increased risk of all-cause death. The plausible mechanisms underlying the worse prognosis in patients with ACS having cancer comorbidity are as follows: shared biological mechanisms aggravating the conditions, such as inflammation and oxidative stress;7,28
high risk of gastrointestinal bleeding during antiplatelet therapy;26,29,30
and cancer treatment-related cardiotoxicity.31–33
Moreover, our Cox regression analysis revealed that current or recent cancer had a greater prognostic effect than non-recent cancer. This difference in prognostic effect among patients with prevalent cancer might be due to mental stress in addition to the aforementioned mechanisms.34
Furthermore, the incidence of cancer post-discharge was 4.1% in our study, which is similar to previous studies. Cordero et al reported that the cancer incidence in 1,731 patients with ACS was 3.1% during a median follow-up of 33 months, and the most frequent primary sites of cancer were the colon, lung, bladder, and pancreas.8
In a retrospective study of 4,229 consecutive patients with ACS who received dual antiplatelet therapy, Raposeiras-Roubin et al reported a cancer incidence of 7.4% during a median follow-up of 46.2 months, and genital, gastrointestinal, urinary, and lung cancers were the most common.26
In our study, gastrointestinal and urinary cancers were frequently observed and mainly diagnosed within 1 year, which is consistent with the observation in a previous study.35
In addition, some biomarkers as predictors of cancer incidence in patients with ACS have been reported. Simes et al demonstrated that D-dimer levels could predict cancer incidence and death after adjusting for other risk factors,11
and that higher baseline D-dimer levels (quartile 4 vs. 1) had a higher adjusted HR (1.16 or 1.59) for cancer incidence. Another study of 589 patients with ACS showed the association of plasma lipid levels with long-term malignancy risk,12
indicating that lower baseline levels of total cholesterol and low-density lipoprotein are independently associated with a high risk of cancer incidence.
To reduce the burden of these diseases, early diagnosis and treatment are vital to improve both prognosis and quality of life. Although risk markers have been reported, a clinically relevant risk model that can predict cancer incidence in patients with ACS has not been established. To the best of our knowledge, we are the first to develop a clinically useful risk prediction model (i.e., the SARAD score) for cancer incidence in patients with ACS. The SARAD scoring system comprises 4 factors: smoking history, age ≥65 years, high RAR, and high D-dimer level; smoking history, age, and high D-dimer level are known risk factors for cancer incidence.8,11,36,37
The RDW is a measurement of the variability of the erythrocyte volume and reflects inflammatory conditions.38
Recently accumulated evidence shows the prognostic implication of RDW in patients with cancer and indicates that an increase in the RDW level could be a negative predictor of cancer prognosis.39
Albumin, which is a type of protein produced in the liver, is an indicator of nutrition and reflects inflammatory conditions.40,41
As RDW, albumin, and D-dimer can be easily measured in hospitalized patients, the SARAD score could be easily determined in daily practice, which in turn enables cardiologists to screen for cancer in patients with ACS. Among patients with 4 points on the SARAD score, 25% will be more likely to be diagnosed with cancer. In addition, cancer incidence in patients with ACS may be higher than that in the general population in Japan (Supplementary Table 5). Thus, these patients should be closely monitored, and a complete cancer work-up should be performed. Nevertheless, the utility of the scoring system needs to be further confirmed in a future prospective study on cancer screening.
Study Limitations
First, given the retrospective observational nature of this study, a cause–result relationship between cancer and the prognosis of patients with ACS could not be assessed. In addition, bias due to unmeasured confounding factors was possible, thereby affecting the findings of this study. Second, the precision of the estimate of predictors might be limited because of the low absolute number of the outcomes. Particularly, the number of outcomes was low in the development of the risk prediction model for cancer incidence, and the predictors of cancer incidence were selected using the sparse logistic regression model with an elastic net. Third, for the cutoff value of RDW or RAR, we did not account for sex difference because there was no sex difference in the standard value of our hospital. However, other measuring instruments may have different standard values between men and women. Although the small sample size and number of outcomes in this study limited the calculation of the cutoff value of RDW or RAR, which accounted for the sex difference, a study with a large sample size is needed to calculate the cutoff value to increase the generalizability of results of this study. Finally, external validation of the SARAD scoring system could not be performed. As independent external datasets were not available, cross-validation was performed to prevent overfitting. Despite the limitations, the SARAD scoring system was shown to be a clinically useful screening tool, although an external validation study should be conducted to confirm our results.
Conclusions
We found an association of prevalent cancer with all-cause death in patients with ACS. Our novel risk prediction model (i.e., the SARAD scoring system, which includes old age, smoking history, high RAR, and high D-dimer level) may be clinically useful in predicting cancer incidence after ACS. Nevertheless, future prospective studies are needed to confirm the utility of the SARAD scoring system.
Disclosures
H.O., K.T. are members of
Circulation Journal’s Editorial Team.
IRB Information
The present study was approved by Miyazaki Prefectural Nobeoka Hospital (reference no. 20190911-1) and National Cerebral and Cardiovascular Center (reference no. M30-007-6).
Funding
This study was supported by Asahi Kasei Corporation and the Health and Labor Sciences Research Grant (Comprehensive Research on Life-Style Related Disease including Cardiovascular Deseases and Diabetes Mellitus, 21FA1012).
Competing Interests
The authors declare that there are no conflicts of interest in connection with this paper. Moreover, potential conflicts of interest unrelated to this paper are listed below: Dr. Tsujita reports remuneration for several lectures from Amgen Astellas BioPharma K.K., Kowa Pharmaceutical Co. Ltd., Daiichi Sankyo Co., Ltd., Takeda Pharmaceutical Co., Ltd., Bayer Yakuhin, Ltd., Pfizer Japan Inc., Bristol-Myers K.K., MSD K.K.; has received trust research/joint research funds from Bristol-Myers K.K., Sugi Bee Garden Co., Ltd., Kowa Pharmaceutical Co. Ltd.; and scholarship funds from ITI Co., Ltd., Abbott Medical Japan L.L.C, Abbott Vascular Japan Co., Ltd., Otsuka Pharmaceutical Co., Ltd., Cardinal Health Japan, Kaneka Medix Co., Ltd., Takeda Pharmaceutical Co., Ltd., Mitsubishi Tanabe Pharma, Chugai Pharmaceutical Co., Ltd., Terumo Co., Ltd., Nipro Corporation, Nihon Kohden Corporation, Medtronic Japan Co., Ltd., Japan Lifeline Co., Ltd., Fides-One, Inc., Fukuda Denshi Co., Ltd., and Boston Scientific Japan K.K., outside the submitted work. Other authors declare no potential conflicts of interest.
Contributors
All authors had full access to all the data in the study and the corresponding author had final responsibility for the integrity of the data and the accuracy of the data analysis. All of authors have contributed to this manuscript. M.I. performed statistical analysis. Y.M. and N.Y. handled funding and supervision. K.M., M.N., S.O., R.K., T.M., S.K., H.K., R.T., K.K., and M.I. acquired the data. K.M., M.N., S.O., R.K., Y.M., N.Y., H.O., and M.I. conceived and designed the research. M.I. drafted the manuscript. M.I., K.T., Y.I., Y.M., and N.Y. made critical revisions of the manuscript for key intellectual content.
Supplementary Files
Please find supplementary file(s);
http://dx.doi.org/10.1253/circj.CJ-21-0071
References
- 1.
Global, regional, and national age-sex-specific mortality for 282 causes of death in 195 countries and territories, 1980–2017: A systematic analysis for the Global Burden of Disease Study 2017. Lancet 2018; 392: 1736–1788.
- 2.
Leal J, Luengo-Fernández R, Gray A, Petersen S, Rayner M. Economic burden of cardiovascular diseases in the enlarged European Union. Eur Heart J 2006; 27: 1610–1619.
- 3.
Luengo-Fernandez R, Leal J, Gray A, Sullivan R. Economic burden of cancer across the European Union: A population-based cost analysis. Lancet Oncol 2013; 14: 1165–1174.
- 4.
Koene RJ, Prizment AE, Blaes A, Konety SH. Shared risk factors in cardiovascular disease and cancer. Circulation 2016; 133: 1104–1114.
- 5.
Rasmussen-Torvik LJ, Shay CM, Abramson JG, Friedrich CA, Nettleton JA, Prizment AE, et al. Ideal cardiovascular health is inversely associated with incident cancer: The Atherosclerosis Risk In Communities study. Circulation 2013; 127: 1270–1275.
- 6.
Nöthlings U, Ford ES, Kröger J, Boeing H. Lifestyle factors and mortality among adults with diabetes: Findings from the European Prospective Investigation into Cancer and Nutrition-Potsdam study. J Diabetes 2010; 2: 112–117.
- 7.
Tabata N, Sueta D, Yamamoto E, Takashio S, Arima Y, Araki S, et al. Outcome of current and history of cancer on the risk of cardiovascular events following percutaneous coronary intervention: A Kumamoto University Malignancy and Atherosclerosis (KUMA) study. Eur Heart J Qual Care Clin Outcomes 2018; 4: 290–300.
- 8.
Cordero A, López-Palop R, Carrillo P, Núñez J, Frutos A, Bertomeu-González V, et al. Prevalence and postdischarge incidence of malignancies in patients with acute coronary syndrome. Rev Esp Cardiol (Engl Ed) 2018; 71: 267–273.
- 9.
Schmidt M, Jacobsen JB, Lash TL, Bøtker HE, Sørensen HT. 25 year trends in first time hospitalisation for acute myocardial infarction, subsequent short and long term mortality, and the prognostic impact of sex and comorbidity: A Danish nationwide cohort study. BMJ 2012; 344: e356.
- 10.
Ederhy S, Cohen A, Boccara F, Puymirat E, Aissaoui N, Elbaz M, et al. In-hospital outcomes and 5-year mortality following an acute myocardial infarction in patients with a history of cancer: Results from the French registry on Acute ST-elevation or non-ST-elevation myocardial infarction (FAST-MI) 2005 cohort. Arch Cardiovasc Dis 2019; 112: 657–669.
- 11.
Simes J, Robledo KP, White HD, Espinoza D, Stewart RA, Sullivan DR, et al. D-dimer predicts long-term cause-specific mortality, cardiovascular events, and cancer in patients with stable coronary heart disease: LIPID study. Circulation 2018; 138: 712–723.
- 12.
Berton G, Cordiano R, Cavuto F, Bagato F, Mahmoud HT, Pasquinucci M. Association between plasma lipid levels during acute coronary syndrome and long-term malignancy risk: The ABC-4 study on heart disease. BMC Cardiovasc Disord 2019; 19: 119.
- 13.
Marume K, Nagatomo K, Yamamoto N, Kaichi R, Mori T, Komaki S, et al. Prognostic impact of the presence of on-duty cardiologist on patients with acute myocardial infarction admitted during off-hours. J Cardiol 2020; 76: 184–190.
- 14.
Thygesen K, Alpert JS, Jaffe AS, Simoons ML, Chaitman BR, White HD, et al. Third universal definition of myocardial infarction. Circulation 2012; 126: 2020–2035.
- 15.
Sato K, Kaikita K, Nakayama N, Horio E, Yoshimura H, Ono T, et al. Coronary vasomotor response to intracoronary acetylcholine injection, clinical features, and long-term prognosis in 873 consecutive patients with coronary spasm: Analysis of a single-center study over 20 years. J Am Heart Assoc 2013; 2: e000227.
- 16.
Ishii M, Hokimoto S, Akasaka T, Fujimoto K, Miyao Y, Kaikita K, et al. Differential effects of strong and regular statins on the clinical outcome of patients with chronic kidney disease following coronary stent implantation: The Kumamoto Intervention Conference Study (KICS) registry. Circ J 2015; 79: 1115–1124.
- 17.
Tabata N, Sueta D, Yamamoto E, Takashio S, Arima Y, Araki S, et al. A retrospective study of arterial stiffness and subsequent clinical outcomes in cancer patients undergoing percutaneous coronary intervention. J Hypertens 2019; 37: 754–764.
- 18.
Tabata N, Al-Kassou B, Sugiura A, Kandt J, Shamekhi J, Stundl A, et al. Prognostic impact of cancer history in patients undergoing transcatheter aortic valve implantation. Clin Res Cardiol 2020; 109: 1243–1250.
- 19.
Terkelsen CJ, Lassen JF, Nørgaard BL, Gerdes JC, Jensen T, Gøtzsche LB, et al. Mortality rates in patients with ST-elevation vs. non-ST-elevation acute myocardial infarction: Oobservations from an unselected cohort. Eur Heart J 2005; 26: 18–26.
- 20.
Daida H, Miyauchi K, Ogawa H, Yokoi H, Matsumoto M, Kitakaze M, et al. Management and two-year long-term clinical outcome of acute coronary syndrome in Japan: Prevention of Atherothrombotic Incidents Following Ischemic Coronary attack (PACIFIC) registry. Circ J 2013; 77: 934–943.
- 21.
Weisbord SD, Palevsky PM, Kaufman JS, Wu H, Androsenko M, Ferguson RE, et al. Contrast-associated acute kidney injury and serious adverse outcomes following angiography. J Am Coll Cardiol 2020; 75: 1311–1320.
- 22.
Hayes AF, Rockwood NJ. Regression-based statistical mediation and moderation analysis in clinical research: Observations, recommendations, and implementation. Behav Res Ther 2017; 98: 39–57.
- 23.
Alba AC, Agoritsas T, Walsh M, Hanna S, Iorio A, Devereaux PJ, et al. Discrimination and calibration of clinical prediction models: Users’ guides to the medical literature. JAMA 2017; 318: 1377–1384.
- 24.
Leening MJ, Vedder MM, Witteman JC, Pencina MJ, Steyerberg EW. Net reclassification improvement: Computation, interpretation, and controversies: A literature review and clinician’s guide. Ann Intern Med 2014; 160: 122–131.
- 25.
Fitzgerald M, Saville BR, Lewis RJ. Decision curve analysis. JAMA 2015; 313: 409–410.
- 26.
Raposeiras-Roubín S, Abu-Assi E, Muñoz-Pousa I, Cespón-Fernández M, Cobas-Paz R, Caneiro-Queija B, et al. Risk of cancer after an acute coronary syndrome according to the type of P2Y12 inhibitor. Thromb Res 2019; 174: 51–58.
- 27.
Itzhaki Ben Zadok O, Hasdai D, Gottlieb S, Porter A, Beigel R, Shimony A, et al. Characteristics and outcomes of patients with cancer presenting with acute myocardial infarction. Coron Artery Dis 2019; 30: 332–338.
- 28.
Ridker PM, Everett BM, Thuren T, MacFadyen JG, Chang WH, Ballantyne C, et al. Antiinflammatory therapy with canakinumab for atherosclerotic disease. N Engl J Med 2017; 377: 1119–1131.
- 29.
Shivaraju A, Patel V, Fonarow GC, Xie H, Shroff AR, Vidovich MI. Temporal trends in gastrointestinal bleeding associated with percutaneous coronary intervention: Analysis of the 1998–2006 Nationwide Inpatient Sample (NIS) database. Am Heart J 2011; 162: 1062–1068.e5.
- 30.
Berger JS, Bhatt DL, Steg PG, Steinhubl SR, Montalescot G, Shao M, et al. Bleeding, mortality, and antiplatelet therapy: Results from the Clopidogrel for High Atherothrombotic Risk and Ischemic Stabilization, Management, and Avoidance (CHARISMA) trial. Am Heart J 2011; 162: 98–105.e1.
- 31.
Lenneman CG, Sawyer DB. Cardio-oncology: An update on cardiotoxicity of cancer-related treatment. Circ Res 2016; 118: 1008–1020.
- 32.
Oikonomou EK, Kokkinidis DG, Kampaktsis PN, Amir EA, Marwick TH, Gupta D, et al. Assessment of prognostic value of left ventricular global longitudinal strain for early prediction of chemotherapy-induced cardiotoxicity: A systematic review and meta-analysis. JAMA Cardiol 2019; 4: 1007–1018.
- 33.
Yeh ET, Chang HM. Oncocardiology – past, present, and future: A review. JAMA Cardiol 2016; 1: 1066–1072.
- 34.
Fang F, Fall K, Mittleman MA, Sparén P, Ye W, Adami HO, et al. Suicide and cardiovascular death after a cancer diagnosis. N Engl J Med 2012; 366: 1310–1318.
- 35.
Erichsen R, Sværke C, Sørensen HT, Sandler RS, Baron JA. Risk of colorectal cancer in patients with acute myocardial infarction and stroke: A nationwide cohort study. Cancer Epidemiol Biomarkers Prev 2013; 22: 1994–1999.
- 36.
Inoue M, Sawada N, Matsuda T, Iwasaki M, Sasazuki S, Shimazu T, et al. Attributable causes of cancer in Japan in 2005: Systematic assessment to estimate current burden of cancer attributable to known preventable risk factors in Japan. Ann Oncol 2012; 23: 1362–1369.
- 37.
de Magalhães JP. How ageing processes influence cancer. Nat Rev Cancer 2013; 13: 357–365.
- 38.
Salvagno GL, Sanchis-Gomar F, Picanza A, Lippi G. Red blood cell distribution width: A simple parameter with multiple clinical applications. Crit Rev Clin Lab Sci 2015; 52: 86–105.
- 39.
Wang PF, Song SY, Guo H, Wang TJ, Liu N, Yan CX. Prognostic role of pretreatment red blood cell distribution width in patients with cancer: A meta-analysis of 49 studies. J Cancer 2019; 10: 4305–4317.
- 40.
Boldt J. Use of albumin: An update. Br J Anaesth 2010; 104: 276–284.
- 41.
Gabay C, Kushner I. Acute-phase proteins and other systemic responses to inflammation. N Engl J Med 1999; 340: 448–454.


