Abstract
Background:
The use of iodine contrast agents is one possible limitation in cryoballoon ablation (CBA) for atrial fibrillation (AF). This study investigated intracardiac echography (ICE)-guided contrast-free CBA.
Methods and Results:
The study was divided into 2 phases. First, 25 paroxysmal AF patients (Group 1) underwent CBA, and peri-balloon leak flow velocity (PLFV) was assessed using ICE and electrical pulmonary vein (PV) lesion gaps were assessed by high-density electroanatomical mapping. Then, 24 patients (Group 2) underwent ICE-guided CBA and were compared with 25 patients who underwent conventional CBA (historical controls). In Group 1, there was a significant correlation between PLFV and electrical PV gap diameter (r=–0.715, P<0.001). PLFV was higher without than with an electrical gap (mean [±SD] 127.0±28.6 vs. 66.6±21.0 cm/s; P<0.001) and the cut-off value of PLFV to predict electrical isolation was 105.7 cm/s (sensitivity 0.700, specificity 0.929). In Group 2, ICE-guided CBA was successfully performed with acute electrical isolation of all PVs and without the need for “rescue” contrast injection. Atrial tachyarrhythmia recurrence at 6 months did not differ between ICE-guided and conventional CBA (3/24 [12.5%] vs. 5/25 [20.0%], respectively; P=0.973, log-rank test).
Conclusions:
PLFV predicted the presence of an electrical PV gap after CBA. ICE-guided CBA was feasible and safe, and could potentially be performed completely contrast-free without a decrease in ablation efficacy.
Cryoballoon catheter ablation has become a standard therapy for paroxysmal atrial fibrillation (AF).1–3
Recently, the safety and efficacy of cryoballoon ablation in patients with persistent AF and/or heart failure have been reported, and the indications for cryoballoon ablation are expanding.4,5
In addition, new cryocatheters for creating “single-shot” linear lesions are being developed.6
Single-energy application is an advantage of cryoballoon ablation compared with other modalities.7
However, the use of iodine contrast dye for confirmation of balloon occlusion of the pulmonary vein (PV) ostium remains a limitation, particularly in patients with impaired renal function. Echocardiography has been proposed as a guide for ablation catheters, including cryoballoon, and as a substitute for confirmation of balloon occlusion. However, efficacy data for echocardiography-guided cryoballoon ablation of AF remain limited.8–10
This could be overcome by intracardiac echography (ICE)-guided contrast-free cryoballoon ablation.
Editorial p ????
Therefore, the aims of this study were to: (1) investigate peri-balloon leak assessed by ICE and to compare it to the leak assessed with contrast dye on fluoroscopy; (2) correlate peri-balloon leak flow velocity with electrical gap assessment by a high-density electroanatomical mapping system; and (3) investigate the feasibility of ICE-guided cryoballoon ablation compared with conventional cryoballoon ablation.
Methods
The protocol for this study was approved by the Local Ethics Committee of Osaka Saiseikai Nakatsu Hospital (No. 201903). This study was performed in full compliance with the Declaration of Helsinki with regard to investigations in humans.
Study Design
The study protocol consisted of 2 phases. First, the relationship between peri-balloon leak flow velocity assessed using ICE and the location of the electrical PV lesion gap subsequently assessed by the high-density electroanatomical mapping system was investigated (“high-density mapping validation study” [Group 1]). Details of the sample size calculation for Group 1 are provided in the
Supplementary Materials. Second, ICE-guided contrast-free cryoballoon ablation was performed using the cut-off value obtained in the first phase of the study (“ICE-guided ablation group” [Group 2]). Procedure outcomes in Group 2 were compared to those of patients who underwent conventional cryoballoon ablation before this study had started (historical control group).
Study Population
This study included patients with paroxysmal or persistent AF (AF duration <1 year) referred for catheter ablation to Osaka Saiseikai Nakatsu Hospital between July 2018 and February 2021. Patients with a history of previous catheter ablation of AF, clinically recorded atrial flutter and/or atrial tachycardia prior to the ablation, and impaired renal function (estimated glomerular filtration rate [eGFR] <60 mL/min/1.73 m2) were excluded from the study. Electrocardiogram (ECG)-gated contrast-enhanced or non-contrast computed tomography (CT) was performed for 3-dimensional (3D) reconstruction of the left atrium (LA) and PVs. Detailed methods of the 3D reconstruction using non-contrast CT data are provided in the
Supplementary Materials. Patients with a common orifice of the superior and inferior PVs (PV antrum diameter >28 mm) were also excluded from the study. Written informed consent was obtained from all patients.
The historical controls consisted of 25 consecutive patients who met the inclusion criteria of this study and had undergone conventional angiography-guided cryoballoon ablation between July 2017 and June 2018.
Vascular Access and Catheterization
All patients underwent the procedures while under local and general anesthesia, were intubated using a laryngeal mask (i-gel; Nihon Kohden, Tokyo Japan), and were ventilated. Continuous blood pressure monitoring during the procedure was performed using an arterial line in the right or left radial artery. Introducer sheaths were placed in the right internal jugular vein (IJV) and the right femoral vein (FV). A 20-pole catheter was placed in the coronary sinus via a 7-Fr sheath in the right IJV. An 8.5-Fr long sheath (SL0; AF Division, St. Jude Medical, Minneapolis, MN, USA) and a 6-Fr sheath were placed in the right FV. An additional long sheath for the ICE catheter (8.5 or 10 Fr [SL0; St. Jude Medical] for an AcuNavTM
[Siemens Medical Solutions, Mountain View, CA, USA] or ViewFlex Extra ICE catheter [St. Jude Medical], respectively) was placed in the right FV. In each case, transseptal catheterization was performed under fluoroscopic and ICE guidance. The transseptal sheath was exchanged over a guidewire for a 15-Fr steerable sheath (FlexCath Advance; Medtronic, Minneapolis, MN, USA). An ICE catheter was also advanced along the guidewire and inserted into the LA via the transseptal puncture hole.
Cryoballoon Ablation Procedure, Peri-Balloon Leak Flow Assessment and Electroanatomical Mapping
In Group 1, baseline electroanatomical mapping (Rhythmia Mapping System; IntellaMap Orion Mapping Catheter; Boston Scientific, Marlborough, MA, USA) of the LA was performed after 2 transseptal sheaths (FlexCath Advance and SL0) were placed. The PV was isolated using a 10.5-Fr, 28-mm cryoballoon catheter (Arctic Front Advance or Arctic Front Advance Pro; Medtronic) and a circular mapping catheter (Achieve; Medtronic). The circular catheter and cryoballoon were navigated to each PV using fluoroscopy, ICE imaging, and the electroanatomical mapping system. The cryoballoon ablation settings in this study were identical to the standard method reported previously11
(i.e., 180 s freeze, with an additional 60 s freeze when the time to isolation was >120 s).11
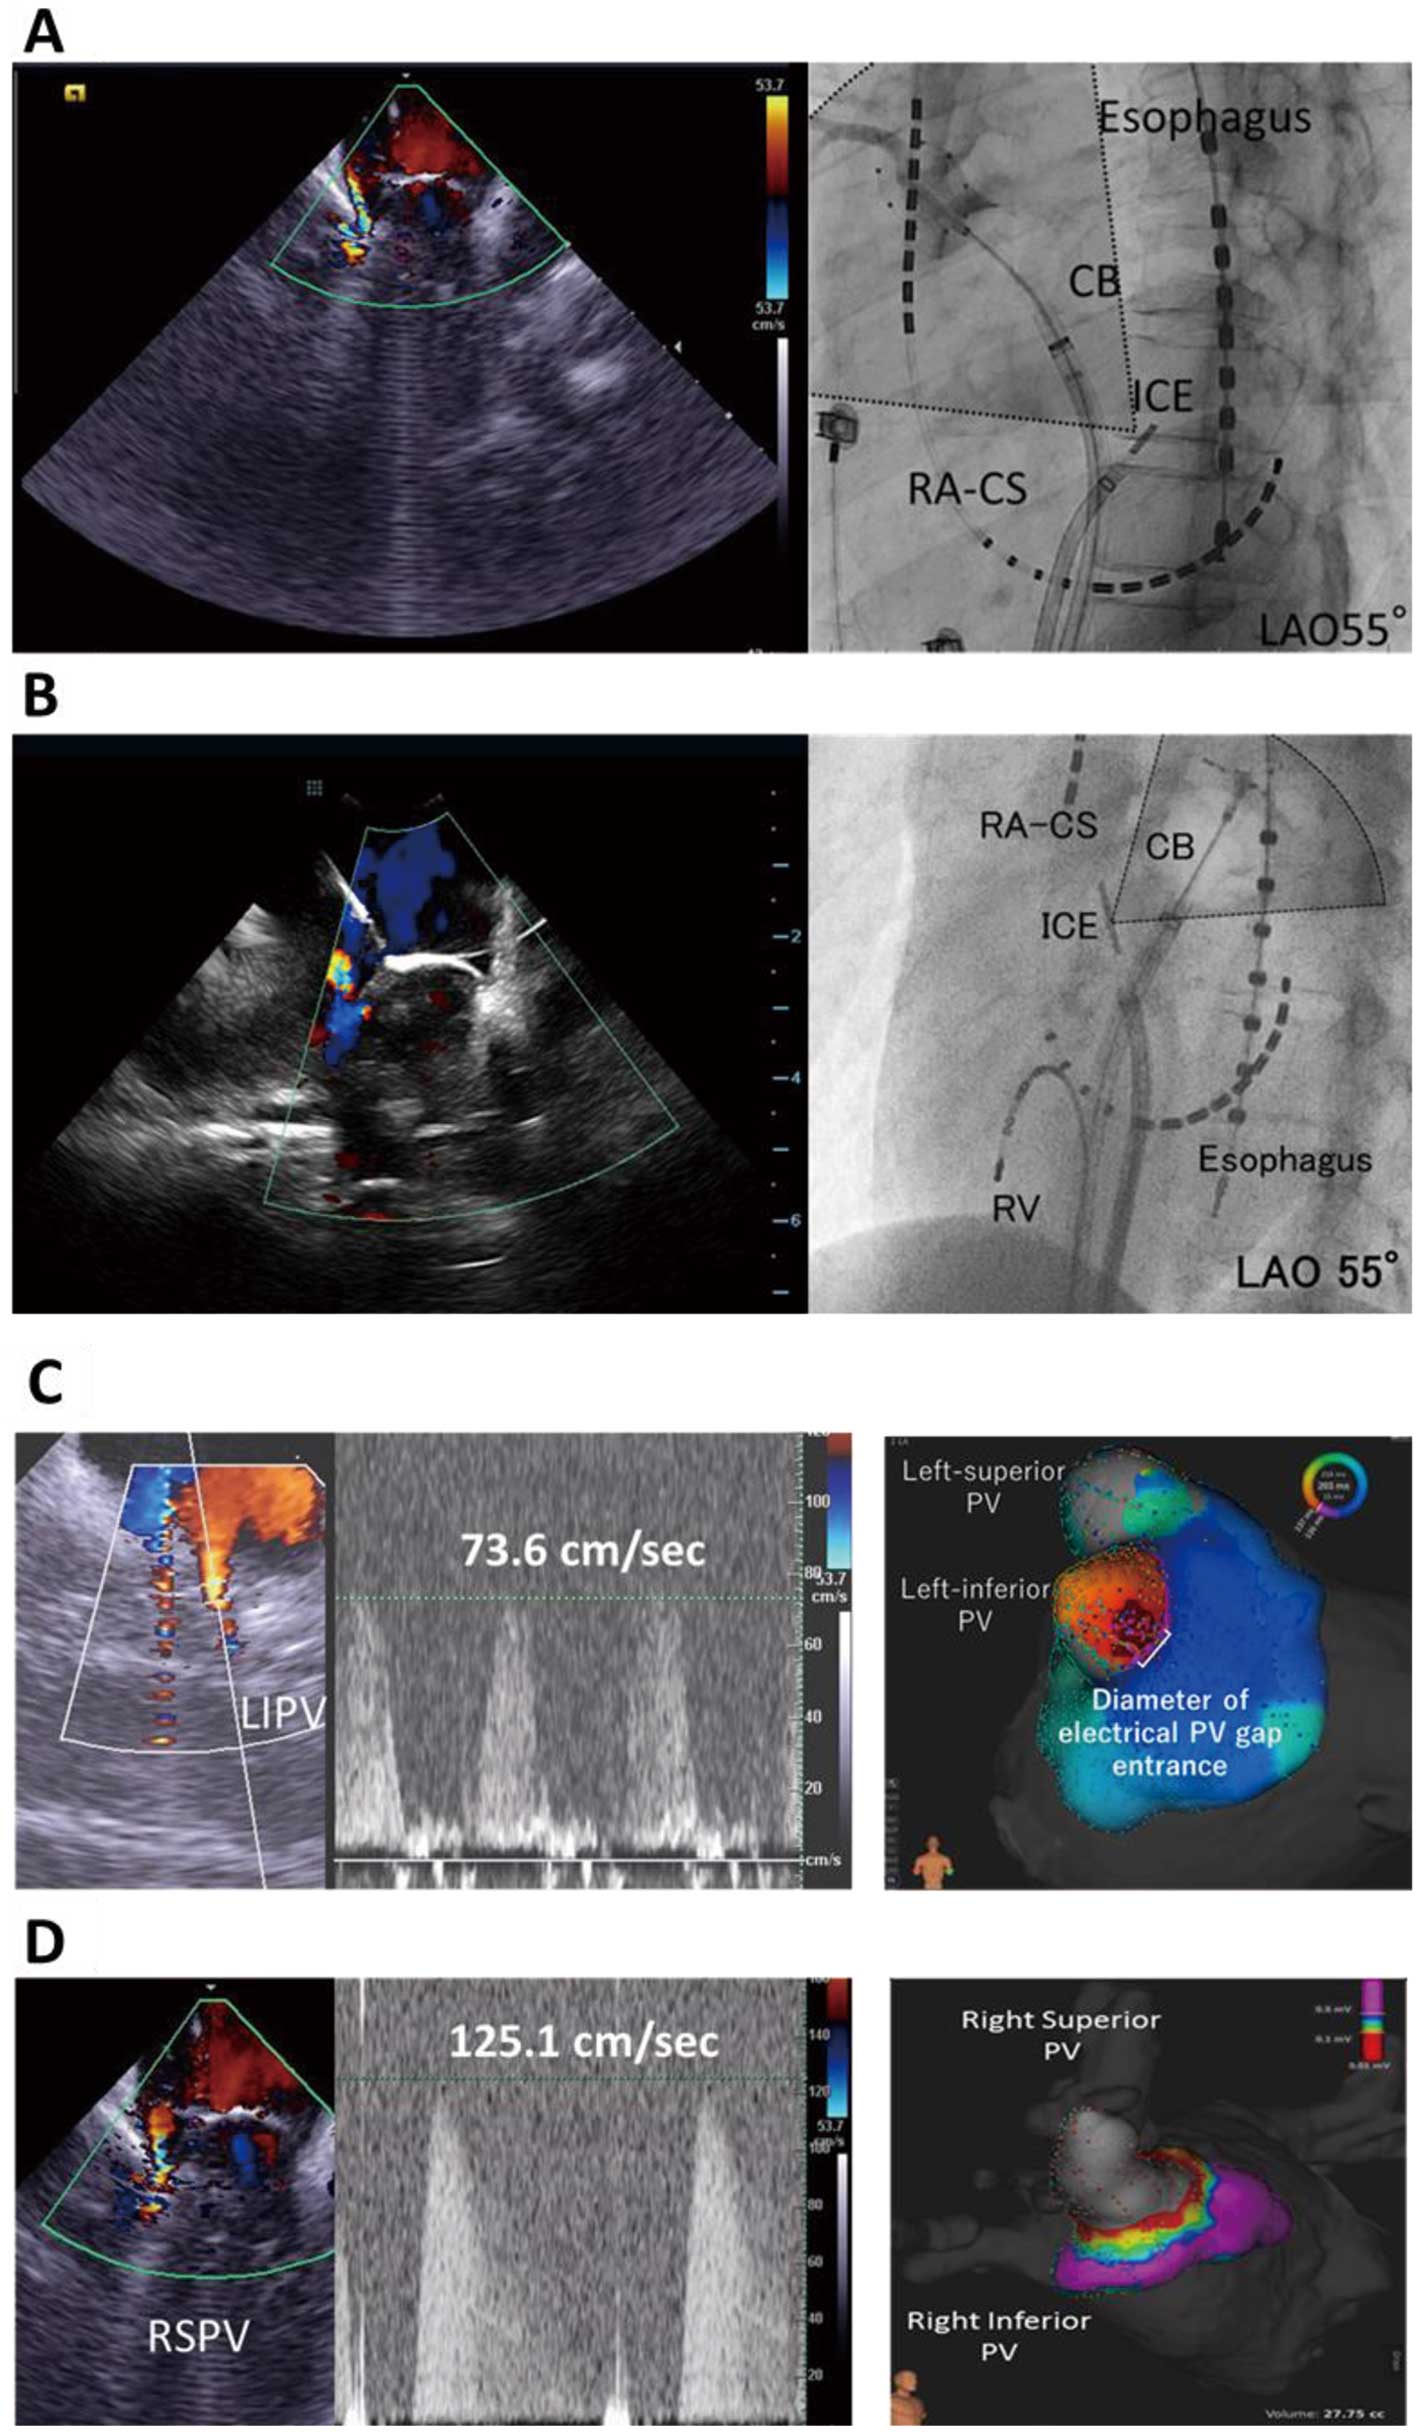
Prior to freezing, the ICE catheter (AcuNavTM; Siemens Medical Solutions) was placed in the LA and used to evaluate the location and velocity of the peri-balloon blood leak, followed by contrast injection from the cryoballoon tip to compare leakage around the balloon with ICE and fluoroscopy. Representative images of ICE evaluation are shown in
Figure 1A,B. An electroanatomical map was obtained after each freeze to identify any electrical PV lesion gap. Relationships between leak flow assessed by ICE and contrast injection, leak flow velocity, and possible electrical PV lesion gap were investigated after the ablation procedure. In this study, especially in Group 1, freezing was started immediately after ICE evaluation and the cryoballoon was not manipulated to change its position or balloon contact to correlate the peri-balloon leak flow before freezing and the electrical PV gap; nor did we use the so-called pull-down technique during the first freeze in Group 1.
In Group 2, baseline electroanatomical mapping was obtained using the EnSite NavX system (St. Jude Medical) and a 15-mm circular mapping catheter (AFocus; St. Jude Medical). The methods of cryoballoon ablation and PV leak flow assessment were identical to those in Group 1. An AcuNavTM
(Siemens Medical Solutions) or ViewFlex ExtraTM
(St. Jude Medical) was used for ICE evaluation (the method of ICE evaluation for each PV is shown in the
Supplementary Movie). Cryoenergy application was started when no there was peri-balloon leak or there was leak flow with a similar or higher velocity than the cut-off value obtained in Group 1. For cases in which the first freeze failed, the Achieve®
catheter could be inserted in a different branch of the same PV to anchor the cryoballoon. No contrast injection was performed unless ICE evaluation and PV electrical isolation had subsequently failed.
The ablation methods in the historical control group were identical to those of Group 1 except for the ICE peri-balloon leak assessment. Baseline electroanatomical mapping was obtained using the EnSite NavX system (St. Jude Medical) and a 15-mm circular mapping catheter (AFocus; St. Jude Medical).
In all groups, the presence of non-PV AF foci (NPVAF) was assessed by infusion of an isoproterenol bolus (0.025 mg) after electrical isolation of all PVs was achieved and the inducibility of atrial arrhythmia was tested by rapid atrial pacing (up to 2 : 1 pacing capture). Acute procedural success was defined as demonstration of electrical isolation of all PVs with entrance block to the PV and exit block to the LA.
Statistical Analysis
Continuous variables are expressed as the mean±SD and were compared by 2-sample t-tests, Welch’s t-tests or Mann-Whitney U tests, depending on variable distribution. Associations between continuous variables were assessed using Pearson’s or Spearman’s rank correlation tests, depending on variable distribution. Receiver operating characteristic (ROC) curve and Youden’s Index were used to determine the optimal cut-off value of peri-balloon leak flow velocity to predict electrical PV isolation. Time to event curves describing atrial tachyarrhythmia recurrence-free survival in Group 2 and historical controls were calculated using the Kaplan-Meier method and compared using log-rank tests. Statistical analyses were performed using SPSS version 21.0 (SPSS Inc., Chicago, IL, USA), and 2-sided P<0.05 was considered significant.
Results
Study Population
In all, 74 patients (first 25 patients assigned to Group 1, the next 24 patients assigned to Group 2, and 25 historical controls) were investigated. The baseline characteristics of the patients are summarized in
Table 1. Five patients (20.8%) with persistent AF were included only in Group 2. The remaining patients in Group 2 and all the patients in Group 1 and the historical controls had paroxysmal AF.
Table 1.
Baseline Characteristics
| |
Group 1 |
Group 2 |
Conventional CBA
(historical controls) |
| No. patients |
25 |
24 |
25 |
| Sex |
| No. males |
14 |
11 |
17 |
| No. females |
10 |
13 |
8 |
| Age (years) |
68±11 |
68±12 |
67±11 |
| Paroxysmal AF |
25 (100) |
19 (79.2) |
25 (100) |
| Persistent AF |
0 |
5 (20.8) |
0 |
| CHADS2 score |
| Mean±SD |
0.8±0.7 |
1.3±1.4 |
1.4±1.0 |
| Range |
0–2 |
0–5 |
0–3 |
| AF duration (months) |
29±38 |
17±28 |
14±23 |
| No. anti-arrhythmic drugs |
| Mean±SD |
0.8±0.6 |
1.1±0.8 |
0.6±0.5* |
| Range |
0–2 |
0–3 |
0–1 |
| LVEF (%) |
65.6±6.9 |
66.3±5.1 |
63.0±8.8 |
| LVDd (mm) |
45.2±3.9 |
44.4±4.8 |
46.0±5.2 |
| LA diameter (mm) |
36.7±5.6 |
38.2±5.5 |
39.2±5.3 |
| LA volume index |
29.8±9.8 |
30.5±8.1 |
28.9±7.9 |
| LAA flow (cm/s) |
52.5±21.8 |
53.1±12.0A |
44.8±17.1 |
| PV antrum diameter (S-I×A-P; mm) |
| Left superior PV |
21.1±2.7×19.5±6.2 |
20.3±2.7×17.1±3.1 |
19.2±1.8×16.5±3.0 |
| Left inferior PV |
18.7±2.3×15.5±3.5 |
16.9±2.2×12.5±3.2 |
16.6±2.0×10.9±2.1 |
| Right superior PV |
20.2±3.5×19.2±3.2 |
20.7±3.2×19.8±3.0 |
19.3±4.6×18.6±4.1 |
| Right inferior PV |
20.2±3.4×17.1±3.6 |
18.4±3.7×16.0±3.3 |
18.6±2.9×14.6±3.0 |
Unless indicated otherwise, data are given as the mean±SD or n (%). Group 1 patients underwent conventional cryoballoon ablation (CBA), with peri-balloon leak flow velocity assessed using intracardiac echography (ICE) and electrical pulmonary vein (PV) lesion gaps assessed by high-density electroanatomical mapping. Group 2 patients underwent ICE-guided CBA and were compared with the conventional CBA (historical control) group. *P<0.05 compared with Group 2 (Mann-Whitney U test). There were no significant differences in other variables between Group 2 and the CBA group. ATransesophageal echocardiography (TEE) was performed in only 5 patients because non-urgent TEE was restricted due to the COVID-19 pandemic. AF, atrial fibrillation; A-P, anterior-posterior axis; LA, left atrium; LAA, left atrial appendage; LVDd, left ventricular end-diastolic diameter; LVEF, left ventricular ejection fraction; S-I, superior-inferior axis.
Prior to the ablation procedure, all patients in Group 1 and the historical controls underwent transesophageal echocardiography (TEE) and ECG-gated contrast-enhanced CT for intracardiac thrombus assessment and 3D reconstruction of the LA and PVs. In Group 2, 5 patients underwent ECG-gated non-contrast CT for 3D reconstruction of the LA and PVs. Intracardiac thrombus assessment was performed using TEE. The remaining 19 patients in Group 2 underwent ECG-gated contrast enhanced CT for intracardiac thrombus assessment and 3D reconstruction of the LA and PVs (because of the COVID-19 pandemic, non-urgent TEE, as an aerosolizing procedure, was restricted).
Cryoballoon Ablation Procedure in the High-Density Mapping Validation Study (Group 1)
We investigated 114 freezes to 100 PVs in 25 patients. Peri-balloon leak flow assessment using ICE and contrast injection was performed during sinus rhythm in 104 of 114 freezes (91.2%); the remaining assessments were performed during AF. The outcomes of cryoballoon ablation are summarized in
Table 2. The outcomes of ICE evaluation, contrast injection, and high-density mapping are summarized in
Table 3.
Table 2.
Outcomes of the Cryoballoon Ablation Procedure
| |
Group 1 |
Group 2 |
Conventional CBA
(historical controls) |
| No. patients |
25 |
24 |
25 |
| No. PVs ablated |
100 |
97B |
100 |
| Total no. freezes |
114 |
102 |
150 |
| No. freezes per patient |
4.6±0.7 |
4.2±0.4 |
6.0±1.5* |
| Freeze time (s) |
174.8±25.4 |
175.1±33.4 |
173.0±43.5 |
| Lowest temperature (℃) |
| Cryoballoon |
−47.3±7.2 |
−49.9±7.7 |
−46.3±7.4* |
| Luminal esophagusA |
30.4±5.9 |
29.0±5.8 |
27.8±7.4 |
| No. PVs isolated with first freeze |
86 (86.0) |
92 (94.8) |
64 (64.0) |
| Time to isolationC (first freeze; s) |
45.8±27.9 |
48.1±29.3 |
41.0±23.2 |
| No. acute reconductions after first freeze |
0/86 (0) |
0/92 (0) |
3/64 (4.7) |
| No. PV requiring second freeze |
14/100 (14.0) |
5/97 (5.2) |
39/100 (39.0) |
| No. PVs isolated with second freeze |
14/14 (100) |
5/5 (100) |
27/39 (69.2) |
| Time to isolation (second freeze; s) |
47.4±28.8D |
65.8±52.2 |
59.1±29.6D |
| No. acute reconductions after second freeze |
0/4 (0) |
0/5 (0) |
1/39 |
| No. PVs requiring ≥3 freezes or touch-up ablation |
0 |
0 |
13/100 (13.0) |
| No. patients with acute successful isolation of all PVs |
25/25 (100) |
24/24 (100) |
25/25 (100) |
| Touch-up ablations for PV |
0 (0) |
0 (0) |
6 (24.0)* |
| Total procedure time (min) |
161.1±21.2 |
109.1±24.6 |
174.4±49.0* |
| LA dwell time (min) |
114.7±20.1 |
67.7±17.4 |
96.7±30.1* |
| Non-PV AF foci (n) |
1 (4.0) |
2 (8.3) |
4 (16.0) |
| Atrial arrhythmia induced by rapid pacing |
1E (4.0) |
1E (4.2) |
2E (8.0) |
| Volume of contrast injected (mL) |
25.8±14.1 |
0 |
44.4±17.7* |
| No. complications |
0 |
0 |
0 |
Unless indicated otherwise, data are given as the mean±SD or n (%). Group 1 patients underwent conventional CBA, with peri-balloon leak flow velocity assessed using ICE and electrical PV lesion gaps assessed by high-density electroanatomical mapping. Group 2 patients underwent ICE-guided CBA and were compared with the conventional CBA (historical control) group. *P<0.05 compared with Group 2 (2-sample t-tests, Welch’s t-tests or Mann-Whitney U tests). There were no significant differences in other variables between Group 2 and the CBA group. AThe lowest luminal esophagus temperature of the PV in the proximity of the esophagus (left superior PV [n=28], left inferior PV [n=32], and right inferior PV [n=1] in Group 1; left superior PV [n=24] and left inferior PV [n=25] in Group 2; left superior PV [n=36 freezes] and left inferior PV [n=42 freezes] in ICE-guided CBA.) BThe right middle PV was present in 1 of 24 patients (this patient had a total of 5 PVs). All other patients in the group had 4 PVs. CIn 33 of 100 (Group 1), 22 of 97 (Group 2) and 71 of 100 (conventional CBA) first freezes, the isolation time was not available because the ring catheter was frozen or placed in the distal PV. DIn 2 of 14 Group 1 and 29 of 39 conventional CBA second freezes, the isolation time was not available because the ring catheter was frozen or placed in the distal PV. ETypical RA atrial flutter. RA, right atrium. Other abbreviations as in Table 1.
Table 3.
Summary of Intracardiac Echography Evaluation, Contrast Injection, and High-Density Electroanatomical Mapping
| |
Group 1 |
Group 2 |
| Sinus rhythm at ICE and contrast evaluation |
104/114 (91.2) |
86/102 (84.3) |
| ICE evaluation |
| ICE catheter |
| AcuNavTM |
25 (100) |
5 (20.8) |
| ViewFlex ExtraTM |
0 |
19 (79.2) |
| PV flow velocity (cm/s) |
34.6±7.4 |
37.8±8.6 |
| Peri-balloon PV leak at SR (n) |
26 |
23 |
| No. at first freeze |
24 |
22 |
| No. at second freeze |
2 |
1 |
| Peri-balloon PV leak at AF (n) |
0 |
1 |
| PV leak flow velocity (cm/s) |
89.1±39.3 |
143.2±29.4 |
| PV with leak |
| Left superior PV |
5 (19.2) |
6 (25.0) |
| Left inferior PV |
10 (38.5) |
3 (12.5) |
| Right superior PV |
6 (23.1) |
4 (16.7) |
| Right inferior PV |
5 (19.2) |
11 (45.8) |
| Contrast injection |
| PV with leak (n) |
50 |
No rescue contrast injection |
| No. at first freeze |
46 |
|
| No. at second freeze |
4 |
|
| Left superior PV |
12 (24.0) |
NA |
| Left inferior PV |
15 (30.0) |
NA |
| Right superior PV |
12 (24.0) |
NA |
| Right inferior PV |
11 (22.0) |
NA |
| High-density mapping |
| No. points |
2,707±1,430 |
NA |
| Electrical PV gap (n) |
14 |
NA |
| Diameter of gap entrance (mm) |
8.4±3.9 |
NA |
| Left superior PV (n) |
3 (21.4) |
NA |
| Left inferior PV (n) |
7 (50.0) |
NA |
| Right-superior PV (n) |
2 (14.3) |
NA |
| Right-inferior PV (n) |
2 (14.3) |
NA |
Unless indicated otherwise, data are given as the mean±SD or n (%). Group 1 patients underwent CBA, with peri-balloon leak flow velocity assessed using ICE and electrical PV lesion gaps assessed by high-density electroanatomical mapping. Group 2 patients underwent ICE-guided CBA. In the left-superior PV, all 3 electrical gaps were located at the roof of the PV (at the 0–2 and 10–12 o’clock positions). The remaining 11 gaps in the left inferior, right superior, and right inferior PV were distributed at the bottom of the PV (4–8 o’clock position). NA, not applicable or not available; SR, sinus rhythm. Other abbreviations as in Table 1.
During the first freeze, 24 leaks were observed on ICE imaging and 46 contrast leaks were observed on fluoroscopy. All peri-balloon leaks on ICE imaging were consistent with contrast leaks following ICE evaluation. Eighty-six PVs (all 76 PVs without and 10 PVs with peri-balloon PV leak on ICE imaging) were isolated after the first freeze (time to isolation 45.8±27.9 s) and did not show any electrical PV gaps on high-density electroanatomical mapping. High-density mapping revealed an electrical gap that correlated with the site of the ICE peri-balloon leak flow in the 14 PVs that were not isolated after the first freeze.
Figure 1C,D
shows representative images of PV leak flow with and without electrical gaps.
A second freeze was performed under ICE guidance to eliminate or diminish the peri-balloon leak, consistent with the electrical gap detected by the high-density mapping after the first freeze. All PVs investigated were successfully isolated after 1 or 2 freezes. AF triggers that originated from the PV were observed in 14 patients during the procedure. One patient developed NPVAF under isoproterenol infusion. In another patient, typical right atrial flutter was induced and a cavotricuspid isthmus line was created using a focal 8-mm tip cryoablation catheter (Freezor MAX; Medtronic). No acute PV electrical reconduction or any procedure-related complications were observed in any patients.
Relationship Between Peri-Balloon PV Leak Flow and PV Electrical Gap
Of 24 peri-balloon leaks on ICE imaging after 1 freeze, 10 PVs were isolated and the remaining 14 showed an electrical PV gap with a mean diameter of 8.4±3.9 mm after the first freeze. The characteristics of the peri-balloon leak flow are summarized in
Table 3.
Figure 2A
shows the relationship between leak flow velocity and the diameter of the electrical PV gap. There was a significant negative correlation between peri-balloon leak flow velocity and electrical PV gap diameter (r=−0.715, P<0.001). Peri-balloon leak flow velocity without an electrical gap was higher than that with an electrical gap (127.0±28.6 vs. 66.6±21.0 cm/s, respectively; P<0.001;
Figure 2B). The optimal cut-off value of peri-balloon leak flow velocity to predict electrical PV isolation (area under the curve 0.943; P<0.001) was 105.7 cm/s (sensitivity 0.700, specificity 0.929). Cut-off values of peri-balloon leak flow velocity to predict electrical PV isolation per PV and flow site are provided in the
Supplementary Table.

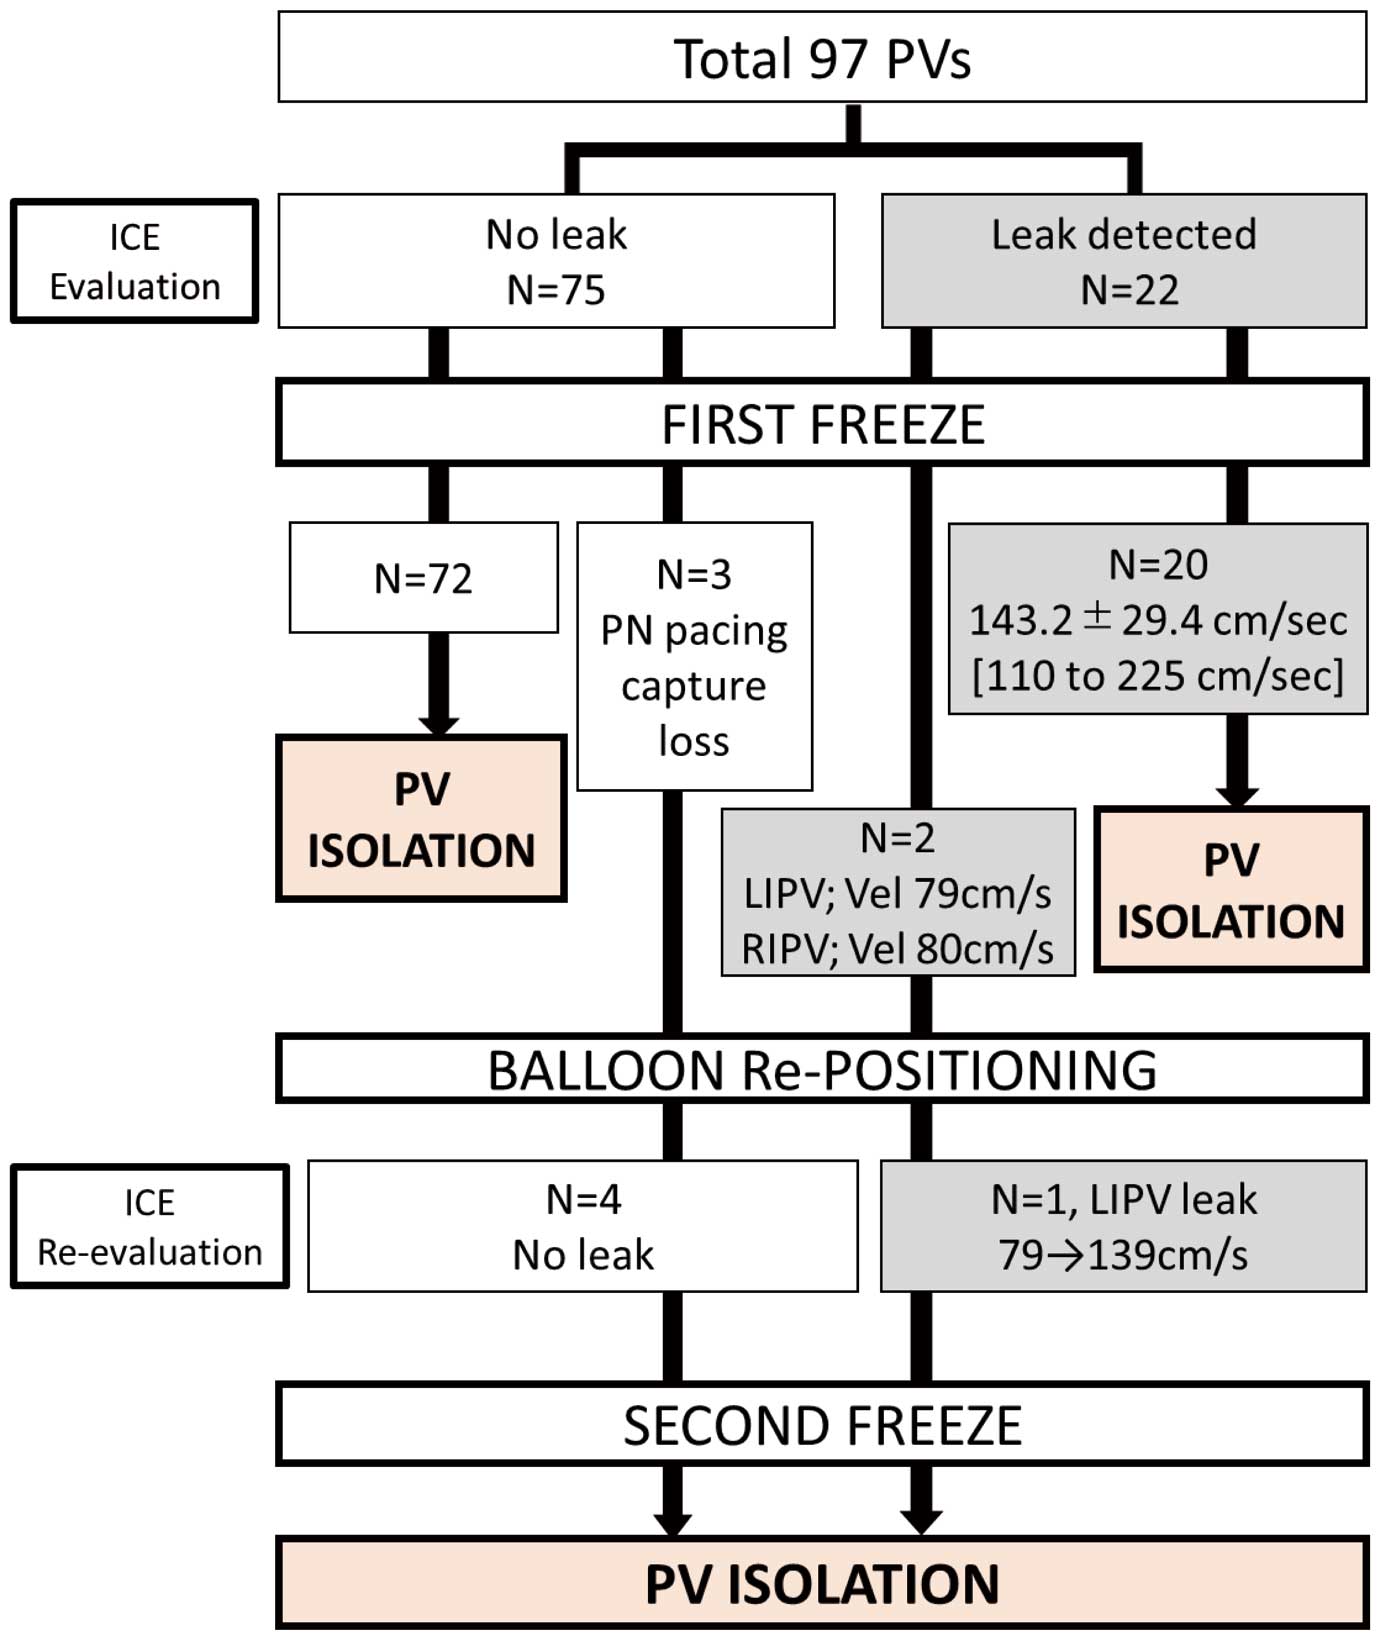
In all, 102 freezes were applied to 97 PVs in 24 patients (the right-middle PV was present in 1 patient; this patient had a total of 5 PVs). Twenty-three peri-balloon leaks were observed during all freezes. The outcomes of ICE-guided contrast-free cryoballoon ablation are summarized in
Figure 3
and
Table 2. In the 97 first freezes, 75 PVs without and 22 PVs with leak flow were successfully isolated (leak flow velocity 149.2±27.3 cm/s [range 110–225 cm/s]; time to isolation 48.1±29.3 s). Five PVs required a second freeze. Two of these PVs (left inferior and right inferior PVs with a leak flow velocity of 79 and 80 cm/s, respectively, both at the bottom direction) were not isolated after a 180-s first freeze. At the second freeze of the left inferior PV, the cryoballoon was pushed to diminish the leak flow (leak flow velocity increased from 79 to 139 cm/s;
Figure 4) and isolated during the second freeze. At the right inferior PV, the pull-down technique12
was used to eliminate the leak. Disappearance of the leak was confirmed by ICE imaging during freezing and successful isolation during the second freeze. In the remaining 3 right superior PVs, the freeze was terminated due to loss of phrenic nerve capture by a pacing catheter. The cryoballoon and phrenic nerve pacing catheter were repositioned and no peri-balloon leak was observed; subsequently, electrical isolation was achieved with a second freeze (time to isolation 28, 24 and 18 s). None of the patients required “rescue” contrast injection due to ICE guidance failure. AF triggers, originating from the PV, were observed in 13 patients during the procedure and NPVAF was observed in 2 patients (8.3%) under isoproterenol infusion. No acute PV electrical reconduction or any procedure-related complications were observed.
The procedure outcomes in the 25 historical controls (conventional cryoballoon ablation) are summarized in
Table 2. Acute electrical isolation was successful for all 100 PVs in 25 patients, but touch-up ablation was required in 6 patients (24.0%). Compared with conventional cryoballoon ablation, ICE-guided cryoballoon ablation (Group 2) was associated with a significantly lower number of freezes per patient (4.3±0.5 vs. 6.0±1.5; P<0.001) and significantly shorter total procedure time (109.1±24.6 vs. 174.4±49.0 min; P<0.001) and LA dwell time (67.7±17.4 vs. 96.7±30.1 min; P<0.001). NPVAF was observed in 4 patients (16.0%) in the historical control group. No procedure-related complications were observed.
Follow-up After Cryoballoon Ablation and Comparison Between ICE-Guided and Conventional Cryoballoon Ablation
During follow-up (mean duration 541±420 days; 507±198, 174±121, and 927±435 days in Group 1, Group 2, and the historical controls, respectively), the recurrence of atrial tachyarrhythmia was observed in 7 patients (4 [16.0%] in Group 1 and 3 [12.5%] in Group 2). Four of these 7 patients had to undergo a second session, which showed no PV reconnection in 3 patients. Reconnection of the right inferior PV was observed in the remaining patient, in whom ICE evaluation and cryoballoon ablation had been performed under AF during the first session and showed no peri-balloon leak at all PVs.
Figure 5
shows the Kaplan-Meier survival analysis (atrial tachyarrhythmia recurrence-free survival) for both groups; there was no difference in the recurrence of atrial tachyarrhythmia at 6 months between the 2 groups (3/24 [12.5%] vs. 5/25 [20.0%] in Groups 2 and 1, respectively; P=0.973, log-rank test). Similarly, recurrence of atrial tachyarrhythmia at the 1-year follow-up did not differ between the 2 groups (Supplementary Figure). In both groups, there were no procedure-related adverse events. Minor iatrogenic interatrial septum shunt was observed in 4 patients (2 [8.0%] in Group 1, 0 in Group 2, and 2 [8.0%] in the historical controls) during the 6-month follow-up.
Discussion
Main Findings
This study showed that: (1) all peri-balloon PV leakage on ICE evaluation correlated with contrast injection leaks on fluoroscopy; (2) there was a significant correlation between peri-balloon leak flow velocity and electrical PV gap diameter; (3) peri-balloon leak flow velocity was higher for PVs without than with an electrical gap, with ROC analysis showing that the optimal cut-off value of peri-balloon leak flow velocity to predict electrical PV isolation was 105.7 cm/s; and (4) in the prospective phase of the study (Group 2), ICE-guided cryoballoon ablation achieved successful electrical isolation of all PVs without “rescue” contrast injection. The short-term efficacy and safety of contrast-free ablation were comparable to those of conventional cryoballoon ablation.
Peri-Balloon PV Leak Flow on ICE Imaging: Comparison With Contrast Injection
The present study showed that peri-balloon leak flow with low velocity on ICE imaging was consistent with electrical PV gap assessed by high-density electroanatomical mapping. Several factors, including balloon contact force, cooling rate, lowest temperature duration, and convective warming, affect lesion formation using cryoenergy.13,14
Based on the result of the present study, leak flow functions as convective warming. In fact, the location of peri-balloon leak flow on ICE imaging was reported to be consistent with cryothermal lesion gaps under gross pathology in a previous animal study.15
Theoretically, leak flow velocity is a reflection of the diameter of the gap through which blood flow passes.16
Therefore, characterizing leak flows according to their velocity seems to be a reasonable method for determination of particular leak severity. Contrast leaks were more often observed compared with the number of leaks detected on ICE imaging. This could be explained by contrast injection from the balloon tip. Elevation of pressure in the occluded PV cavity may have resulted in excess contrast leak, which could have been neglected and subsequently forced an operator to unnecessary changes eliminating the contrast leak.
Efficacy and Safety of ICE-Guided Contrast-Free Cryoballoon Ablation
This study has demonstrated the feasibility of ICE-guided cryoballoon ablation. Successful electrical isolation of all PVs was achieved without “rescue” contrast injection. The acute and short-term outcomes of ICE-guided cryoballoon ablation, although evaluated in a limited number of patients, were comparable to those of the historical controls and to outcomes reported in previous cryoballoon studies.1,2,11
In addition, ICE evaluation provided real-time information of the position of the balloon and the location of peri-balloon leaks, making it possible to confirm whether a pushing or pulling technique should be used, even during freezing. However, this ICE-guide method requires 2 transseptal sheaths for the cryoballoon and ICE catheters. One possible complication of this method is an iatrogenic persistent intra-atrial shunt after double transseptal puncture.17
Of note, follow-up echocardiograms at 6 or 12 months after the procedure revealed 1 minor persistent atrial septum shunt. No other catheter-related adverse events occurred in the present study.
Study Limitations
First, this was a non-randomized study from a single center, and the number of patients investigated in each group was relatively small. This study provides robust data confirming the efficacy and utility of ICE-guided contrast-free cryoballoon ablation, but is potentially limited by the small number of subjects. Therefore, the generalizability of the results is limited. Second, ICE evaluation was performed in most patients during sinus rhythm, but the number of patients in which ICE evaluation was performed during AF was likely too small to detect a statistically significant difference. Third, the number of patients with persistent AF was small, patients with common ostium of the PVs were excluded and, subsequently, patients with a moderately or severely enlarged LA were not included in the study. Fourth, assessment of peri-balloon leak flow velocity using ICE is affected by factors such as anatomical circumstance, the angle between the ultrasound beam and leak flow (which is ideally parallel), and the experience of the operator. Leak flow velocity in some cases may have been underestimated (leak flow velocity between 100 and 120 cm/s;
Figure 3B). Fifth, the comparison between conventional and ICE-guided CB ablation was performed using historical controls in the present study. This type of study cannot completely exclude the effect of “learning curve” bias. Finally, this study provides mainly data regarding the acute outcomes of ICE-guided cryoballoon ablation. A prospective randomized multicenter study with a larger sample size and long-term follow-up is required to determine efficacy more accurately.
Conclusions
The ICE-determined flow velocity of the peri-balloon leak predicted the presence of an electrical PV gap after 1 cryoballoon freeze. This ICE-guided cryoballoon ablation technique is feasible and safe, and shows potential to provide complete contrast-free cryoballoon ablation.
Sources of Funding
This study did not receive any financial support.
Disclosures
None declared.
IRB Information
This study was approved by the Local Ethics Committee of Osaka Saiseikai Nakatsu Hospital (Protocol ID: 201903).
Data Availability
The data, analytic methods, and study materials are available from the corresponding author to other researchers for the purposes of reproducing the results or replicating the procedure upon reasonable request (information will be shared in the form of a data table, document PDF or as Excel files). Data are available immediately after publication for up to 10 years after publication.
Supplementary Files
Supplementary Movie.
The method of intra-cardiac echocardiography (ICE) evaluation for the pulmonary veins (the right-superior pulmonary vein [PV] [left upper panel], the left-superior PV [right upper panel], the right-inferior PV [left lower panel] and the left-inferior PV [right lower panel]). Fluoroscopies (RAO and LAO) on left side of each panel show the positions of catheters. The ICE catheter was manually rotated in a counter clockwise direction, viewing the cryoballoon occluding the PVs (right-superior, left-superior and left-inferior PVs), rotated in a clockwise direction, viewing the cryoballoon occluding the right-inferior PV. The left-superior PV on ICE imaging shows peri-balloon leak flow (flow velocity of 168 cm/s) from 10-11O’clock direction of balloon (viewed from the LA side). No peri-balloon leak flow was observed on ICE imaging of the remaining PVs. CB, cryoballoon; LAO, left-anterior oblique; RA-CS, 20 polar catheter placed in the right atria-coronary sinus; RAO, right-anterior oblique; RV, 10 polar catheter placed in right ventricle.
Please find supplementary file(s);
http://dx.doi.org/10.1253/circj.CJ-21-0423
References
- 1.
Packer DL, Kowal RC, Wheelan KR, Irwin JM, Champagne J, Guerra PG, et al. Cryoballoon ablation of pulmonary veins for paroxysmal atrial fibrillation: First results of the North American Arctic Front (STOP AF) pivotal trial. J Am Coll Cardiol 2013; 61: 1713–1723.
- 2.
Kuck KH, Brugada J, Furnkranz A, Metzner A, Ouyang F, Chun KR, et al. Cryoballoon or radiofrequency ablation for paroxysmal atrial fibrillation. N Engl J Med 2016; 374: 2235–2245.
- 3.
Nogami A, Kurita T, Abe H, Ando K, Ishikawa T, Imai K, et al; on behalf of the JCS/JHRS Joint Working Group. JCS/JHRS 2019 guideline on non-pharmacotherapy of cardiac arrhythmias. Circ J 2021; 85: 1104–1244.
- 4.
Su WW, Reddy VY, Bhasin K, Champagne J, Sangrigoli RM, Braegelmann KM, et al. Cryoballoon ablation of pulmonary veins for persistent atrial fibrillation: Results from the multicenter STOP Persistent AF trial. Heart Rhythm 2020; 17: 1841–1847.
- 5.
Heeger CH, Abdin A, Mathew S, Reissmann B, Yalin K, Liosis S, et al. Efficacy and safety of cryoballoon ablation in patients with heart failure and reduced left ventricular ejection fraction: A multicenter study. Circ J 2019; 83: 1653–1659.
- 6.
Suzuki A, Lehmann HI, Wang S, Parker KD, Rettmann ME, Monahan KH, et al. Biophysical properties, efficacy, and lesion characteristics of a new linear cryoablation catheter in a canine model. Heart Rhythm 2020; 17: 1967–1975.
- 7.
Chun JKR, Bordignon S, Last J, Mayer L, Tohoku S, Zanchi S, et al. Cryoballoon versus laserballoon: Insights from the first prospective randomized balloon trial in catheter ablation of atrial fibrillation. Circ Arrhythm Electrophysiol 2021; 14: e009294.
- 8.
Goya M, Frame D, Gache L, Ichishima Y, Tayar DO, Goldstein L, et al. The use of intracardiac echocardiography catheters in endocardial ablation of cardiac arrhythmia: Meta-analysis of efficiency, effectiveness, and safety outcomes. J Cardiovasc Electrophysiol 2020; 31: 664–673.
- 9.
Sun YJ, Yin XM, Cong T, Gao LJ, Chang D, Xiao XJ, et al. Comparison of cryoballoon ablation for atrial fibrillation guided by real-time three-dimensional transesophageal echocardiography vs. contrast agent injection. Chin Med J (Engl) 2019; 132: 285–293.
- 10.
Kanda T, Masuda M, Kurata N, Asai M, Iida O, Okamoto S, et al. A saline contrast-enhanced echocardiography-guided approach to cryoballoon ablation. Pacing Clin Electrophysiol 2020; 43: 664–670.
- 11.
Okumura K, Matsumoto K, Kobayashi Y, Nogami A, Hokanson RB, Kueffer F. Safety and efficacy of cryoballoon ablation for paroxysmal atrial fibrillation in Japan: Results from the Japanese Prospective Post-Market Surveillance Study. Circ J 2016; 80: 1744–1749.
- 12.
Chen S, Schmidt B, Bordignon S, Bologna F, Nagase T, Perrotta L, et al. Practical techniques in cryoballoon ablation: How to isolate inferior pulmonary veins. Arrhythm Electrophysiol Rev 2018; 7: 11–17.
- 13.
Wood MA, Parvez B, Ellenbogen AL, Shaffer KM, Goldberg SM, Gaspar MP, et al. Determinants of lesion sizes and tissue temperatures during catheter cryoablation. Pacing Clin Electrophysiol 2007; 30: 644–654.
- 14.
Avitall B, Kalinski A. Cryotherapy of cardiac arrhythmia: From basic science to the bedside. Heart Rhythm 2015; 12: 2195–2203.
- 15.
Takami M, Misiri J, Lehmann HI, Parker KD, Johnson SB, Sarmiento RI, et al. Spatial and time-course thermodynamics during pulmonary vein isolation using the second-generation cryoballoon in a canine in vivo model. Circ Arrhythm Electrophysiol 2015; 8: 186–192.
- 16.
Feng J, Khir AW. Determination of wave speed and wave separation in the arteries using diameter and velocity. J Biomech 2010; 43: 455–462.
- 17.
Aksu T, Yalin K, Guler TE, Bozyel S, Heeger CH, Tilz RR. Acute procedural complications of cryoballoon ablation: A comprehensive review. J Atr Fibrillation 2019; 12: 2208.


