Abstract
Background: The mechanism underlying the sex differences in atrial fibrillation (AF) recurrence following pulmonary vein (PV) isolation is not fully understood. We hypothesized that non-PV foci and epicardial adipose tissue (EAT) play a key role.
Methods and Results: Data from 304 consecutive patients (75% males) who underwent contrast-enhanced computed tomography and catheter ablation of AF were reviewed. The EAT around the atrium was measured separately in 4 parts of the atrium. All patients underwent high-dose isoproterenol infusions to assess the non-PV foci. Significantly more non-PV foci and less EAT around the atrium were observed in female patients than in male patients. In males, those with non-PV foci on the left atrial (LA) anterior wall had significantly greater EAT for the same lesions than those without non-PV foci. During a median follow-up of 27 months, the predictors of AF recurrence after first catheter ablation were female sex, presence of non-PV foci, LA diameter, and septal EAT index. A sex-specific analysis revealed that LA diameter was a predictor only in males and that the presence of non-PV foci in the septal region was a strong predictor in males (hazard ratio [HR]: 2.24) and females (HR: 3.65).
Conclusions: Sex-specific differences were observed in non-PV foci sites and local EAT and in regard to the predictors of AF recurrence.
Pulmonary vein isolation (PVI) is a crucial component of catheter ablation of atrial fibrillation (AF), but initial maintenance of sinus rhythm after PVI for AF is 57–77% for paroxysmal AF1 and even lower for persistent AF. Female patients in particular have a high risk of AF recurrence after catheter ablation.2,3 Recent registry data have shown that female patients with AF are significantly more likely than male patients to receive adjunctive lesion sets (in addition to PVI) during ablation of non-paroxysmal AF.4 To improve the success rate of AF catheter ablation and reduce the complications caused by excessive radiofrequency (RF) applications, establishing a sex-specific AF ablation strategy is warranted.
We hypothesized that 2 factors play a key role in the sex differences in AF recurrence following PVI: (1) ectopy originating from non-PV regions (non-PV foci), which could initiate AF and be associated with AF recurrence after PVI,5 and (2) epicardial adipose tissue (EAT), reflecting atrial fibrosis,6 and EAT volume have been associated with the development and recurrence of AF.7 These 2 factors are independently associated with AF in the general population, but the relationship between non-PV foci sites and local EAT has not been explored, and sex differences have not been clarified. The aim of the present study was (1) to investigate sex differences in non-PV foci and local EAT and the regional relationships between them, and (2) to study the effect of the non-PV foci sites and local EAT on the long-term AF recurrence for each sex following catheter ablation.
Methods
Study Population and Protocol
For this retrospective, single-center cohort study, we enrolled a total of 373 consecutive patients who underwent initial RF ablation of AF at Kobe University Hospital between January 2009 and December 2012. Exclusion criteria were: (1) contrast-enhanced computed tomography (CT) after ablation, (2) contrast-enhanced CT artifact that prevented an evaluation of EAT, (3) pacemaker implantation, and (4) inability to be administered isoproterenol. Of the 373 patients, we enrolled 304 who underwent contrast-enhanced CT before catheter ablation and received an isoproterenol infusion during catheter ablation. This study complied with the principles of the Declaration of Helsinki, and was approved by the Ethics Committee of Kobe University Hospital (no. B210211). The patients consented to the use of their anonymized clinical data for research purposes in accordance with the opt-out approach.
CT Acquisition and Evaluation of EAT
The patients were scanned using a 64-slice CT scanner (Aquilion 64 or Aquilion ONE, Canon Medical Systems, Tokyo, Japan) with a 500 ms rotation time, 64×0.5 mm collimation, and tube voltage of 120 kV. An iodinated contrast medium (300 mgI/mL iodine) was injected using the biphasic protocol (51 mL of iodinated contrast agent followed by 30 mL of normal saline) at a rate of 3.0 mL/s. The CT datasets were reconstructed with a 0.5 mm slice thickness and 0.3 mm increment. The CT data were reviewed using multiplanar reconstruction, maximum intensity projection, and 3D volume rendering, with specialized image processing software (EnSite Verismo, St. Jude Medical, CA, USA). The EAT located around the left atrium (LA) and superior vena cava (SVC) was manually traced from the pulmonary artery (PA) bifurcation to the mitral annulus. The software automatically recognized adipose tissue with an attenuation threshold of −200 to −20 Hounsfield units around the LA (Figure 1). The EAT around the LA was divided into 4 regions: (1) the anterior region, or the anterior wall from the mitral annulus to the level of the PA bifurcation, including the LA roof and LA appendage; (2) the posterior region, or the posterior wall from the coronary vein’s inferior end, including the LA inferior wall to the level of the LA roof, from the posterior septum to the LA lateral wall; (3) the septal region, or the atrial septal region up to the level of the right atrial appendage (RAA), including the coronary sinus (CS) ostium; and (4) the SVC region, or the region from the border of the right atrium and SVC, where the RAA is attached, to the height of the PA bifurcation. Two physicians independently measured the total and local EAT volumes. Considering the different physiques of male and female patients, EAT volume is presented as the EAT index (EAT volume/body surface area [mL/m2]).8

All patients underwent wide antral circumferential ablation of the PVI with a RF catheter. Additional ablation procedures were performed at the surgeons’ discretion. Non-PV foci were defined as ectopy originating from non-PV areas after the PVI that triggered AF and that occurred spontaneously or by high-dose isoproterenol provocation (0.5–20 μg/kg/min). For analysis, we divided the LA into 4 regions: anterior (LA anterior wall, including the LA appendage and LA roof), posterior (LA inferior and posterior walls and the distal CS), septal (septal interatrial septum and CS ostium), and SVC.
Repeat catheter ablation was performed in patients with recurrence of AF who desired freedom from AF. The definition of patients with non-PV foci in the present study was those who exhibited non-PV foci during any session of catheter ablation of AF.
Follow-up
All patients were followed up at the outpatient clinic at 1, 3, 6, and 12 months, and at least once yearly thereafter. The use of antiarrhythmic drugs after catheter ablation was at physician’s discretion. 12-lead ECG was performed at each visit, and Holter ECG monitoring was performed at 3 or 6 months after catheter ablation. Recurrence was defined as a documented AF episode lasting >30 s following a 3-month blanking period. Of the 304 patients who underwent a 1st catheter ablation of AF, 2nd, 3rd, and 4th catheter ablation sessions were performed in 116 (38%), 24 (8%), and 3 (1%) patients, respectively.
Statistical Analysis
The data for continuous variables are expressed as median (interquartile range) and for categorical variables as frequency and ratio (%). The continuous and categorical variables were compared using the Mann-Whitney U test and χ2
test, respectively. Intraclass correlation coefficients (ICC) were used for the assessment of the interobserver reliability of the measurement of EAT. A multivariate Cox proportional analysis was carried out to identify the relevant predictors, and hazard ratios (HRs), and 95% confidence intervals (CIs) were calculated. The AF recurrence-free rates were calculated using the Kaplan-Meier actuarial survival method, and the groups were compared using log-rank statistics. A P value <0.05 was considered statistically significant. All statistics were calculated using R statistical software (version 2.13.0; R Foundation for Statistical Computing, Vienna, Austria).
Results
Baseline Characteristics
Of the 304 patients (age 63 [57–69] years; 229 [75%] males) included in this study, 79 (26%) had non-PV foci. For male and female patients, the characteristics were compared between those with and without non-PV foci (Table 1A,B). In male patients, AF duration was significantly longer in those with non-PV foci than in those without. In female patients, only dyslipidemia was significantly more common in those with non-PV foci than in those without.
Table 1. Baseline Characteristics of Male Patients (A) and Female Patients (B)
| (A) Male |
Total
(n=229) |
Non-PV foci (+)
(n=51) |
Non-PV foci (−)
(n=178) |
P value |
| General characteristics |
| Age, years* |
62.0 (57.0–68.0) |
61.0 (57.0–67.5) |
62.5 (56.3–68.0) |
0.79 |
| Height, cm* |
170.0 (165.5–174.3) |
169.8 (165.9–174.6) |
170.1 (165.3–174.1) |
0.77 |
| Weight, kg* |
70.7 (64.2–78) |
71.4 (67.1–78.8) |
69.6 (63.4–76.7) |
0.16 |
| Body mass index, kg/m2* |
24.4 (22.7–26.7) |
24.9 (23.2–26.6) |
24.2 (22.5–26.7) |
0.15 |
| BSA, m2* |
1.82 (1.73–1.91) |
1.83 (1.76–1.91) |
1.81 (1.72–1.90) |
0.25 |
| Hypertension |
121 (53%) |
29 (57%) |
92 (52%) |
0.51 |
| Diabetes |
33 (14%) |
4 (7.8%) |
29 (16%) |
0.13 |
| Dyslipidemia |
71 (31%) |
15 (29%) |
56 (32%) |
0.78 |
| Chronic kidney disease |
1 (0.43%) |
0 |
1 (0.56%) |
1 |
| Asthma |
3 (1.3%) |
2 (3.9%) |
1 (0.56%) |
0.25 |
| Sick sinus syndrome |
28 (12%) |
6 (12%) |
22 (12%) |
0.91 |
| Sleep apnea syndrome |
26 (11%) |
9 (18%) |
17 (9.6%) |
0.11 |
| CHADS2 score |
1.1±1.1 |
1.2±1.1 |
1.0±1.1 |
0.25 |
| CHA2DS2-VASc score |
1.5±1.3 |
1.5±1.2 |
1.5±1.4 |
0.58 |
| No. of failed AADs |
0.8±1.1 |
0.9±1.1 |
0.7±1.1 |
0.22 |
| Current or past smoking, n (%) |
137 (66% 137/208) |
30 (61% 30/49) |
107 (67% 107/159) |
0.43 |
| Brinkman index* |
600 (330–900) |
520 (300–800) |
600 (367.5–900) |
0.17 |
| Paroxysmal AF |
124 (54%) |
27 (53%) |
97 (55%) |
0.84 |
| Persistent AF |
82 (36%) |
20 (39%) |
62 (35%) |
0.56 |
| Chronic AF |
23 (10%) |
4 (7.8%) |
19 (11%) |
0.55 |
| AF duration |
36 (11–77) |
60 (19–96) |
34 (10–69) |
0.01 |
| Serum creatinine, mg/dL* |
0.87 (0.80–0.98) |
0.88 (0.82–0.98) |
0.87 (0.79–0.99) |
0.63 |
| BNP, pg/mL* |
47.7 (22.7–96.6) |
50.0 (29.5–89.0) |
47.5 (21.4–96.8) |
0.37 |
| Echocardiographic parameters |
| LVEF, %* |
62.8 (57.3–66.3) |
62.9 (58.6–66.2) |
62.4 (57.0–66.2) |
0.77 |
| LAD, mm* |
41.8 (37.9–46.0) |
42.2 (37.9–46.1) |
41.6 (37.8–46.0) |
0.58 |
| (B) Female |
Total
(n=75) |
Non-PV foci (+)
(n=28) |
Non-PV foci (−)
(n=47) |
P value |
| General characteristics |
| Age, years* |
66.0 (61.0–71.0) |
67.5 (62.8–71.0) |
63.0 (60.0–70.5) |
0.1 |
| Height, cm* |
155.4 (151.8–159.8) |
155.9 (151.9–159.9) |
155.1 (151.8–159.2) |
0.92 |
| Weight, kg* |
53.6 (49.0–60.2) |
51.8 (47.6–58.3) |
53.9 (49.5–60.8) |
0.22 |
| Body mass index, kg/m2* |
22.0 (20.5–24.7) |
21.6 (19.8–23.9) |
22.3 (20.8–25.1) |
0.32 |
| BSA, m2* |
1.50 (1.45–1.61) |
1.49 (1.43–1.60) |
1.51 (1.46–1.62) |
0.27 |
| Hypertension |
37 (49%) |
12 (43%) |
25 (53%) |
0.39 |
| Diabetes |
6 (8.0%) |
2 (7.1%) |
4 (8.5%) |
1 |
| Dyslipidemia |
20 (27%) |
13 (46%) |
7 (15%) |
<0.01 |
| Chronic kidney disease |
0 |
0 |
0 |
1 |
| Asthma |
2 (2.7%) |
1 (3.6%) |
1 (2.1%) |
1 |
| Sick sinus syndrome |
19 (25%) |
10 (36%) |
9 (19%) |
0.11 |
| Sleep apnea syndrome |
6 (8.0%) |
2 (7.1%) |
4 (8.5%) |
1 |
| CHADS2 score |
0.9±1.0 |
1.0±1.1 |
0.9±0.9 |
0.95 |
| CHA2DS2-VASc score |
2.5±1.3 |
2.6±1.3 |
2.4±1.2 |
0.43 |
| No. of failed AADs |
1.1±1.3 |
1.2±1.5 |
1.0±1.1 |
0.9 |
| Current or past smoking, n (%) |
7 (10% 7/70) |
0 |
7 (16% 7/44) |
0.07 |
| Brinkman index* |
370 (105–735) |
NA |
370 (105–735) |
0.27 |
| Paroxysmal AF |
56 (75%) |
24 (86%) |
32 (68%) |
0.09 |
| Persistent AF |
16 (21%) |
4 (14%) |
12 (26%) |
0.25 |
| Chronic AF |
3 (4.0%) |
0 |
3 (6.4%) |
0.45 |
| AF duration |
41 (17–72) |
57 (27–88) |
36 (16.3–65.8) |
0.37 |
| Serum creatinine, mg/dL* |
0.66 (0.62–0.75) |
0.70 (0.63–0.79) |
0.66 (0.59–0.72) |
0.52 |
| BNP, pg/mL* |
70.0 (28.6–133.6) |
67.1 (34.1–114.6) |
74.5 (24.8–139.3) |
0.95 |
| Echocardiographic parameters |
| LVEF, %* |
64.1 (60.1–67.6) |
63.2 (60.1–66.8) |
64.5 (60.7–67.6) |
0.52 |
| LAD, mm* |
38.3 (34.3–45.2) |
36.1 (33.6–45.2) |
39.7 (36.3–45.2) |
0.22 |
AF defined as paroxysmal when it terminated spontaneously and lasted for <7 days. *Median (interquartile range). AADs, antiarrhythmic drugs; AF, atrial fibrillation; BNP, B-type natriuretic peptide; BSA, body surface area; LAD, left atrial dimension of end-systole; LVEF, left ventricular ejection fraction.
A high interobserver reliability was found in the measurement of EAT volume. The ICC (95% CI) was 0.93 (0.69–0.98) for the anterior EAT volume, 0.96 (0.58–0.99) for the posterior EAT volume, 0.97 (0.89–0.99) for the septal EAT volume, 0.90 (0.67–0.98) for the SVC EAT volume, and 0.93 (0.64–0.98) for the total EAT volume. Figure 2 shows the sex differences in the incidence of non-PV foci and the EAT index around the atrium. Non-PV foci were significantly more present in females than in males (28 of 75 [37%] vs. 51 of 229 [22%], P=0.01). A regional analysis revealed that non-PV foci on the posterior wall were significantly more frequent in females than in males (8.0% vs. 1.7%, P=0.02). In addition, female patients had a greater tendency to have non-PV foci in the SVC and interatrial septum (SVC: 13.3% vs. 6.6%, P=0.06; septum: 13.3% vs. 6.6%, P=0.06) (Figure 2A). In contrast, the total EAT index was significantly higher in males than in females. The local EAT index in each atrial region was also consistently higher in males than in females (Figure 2B).

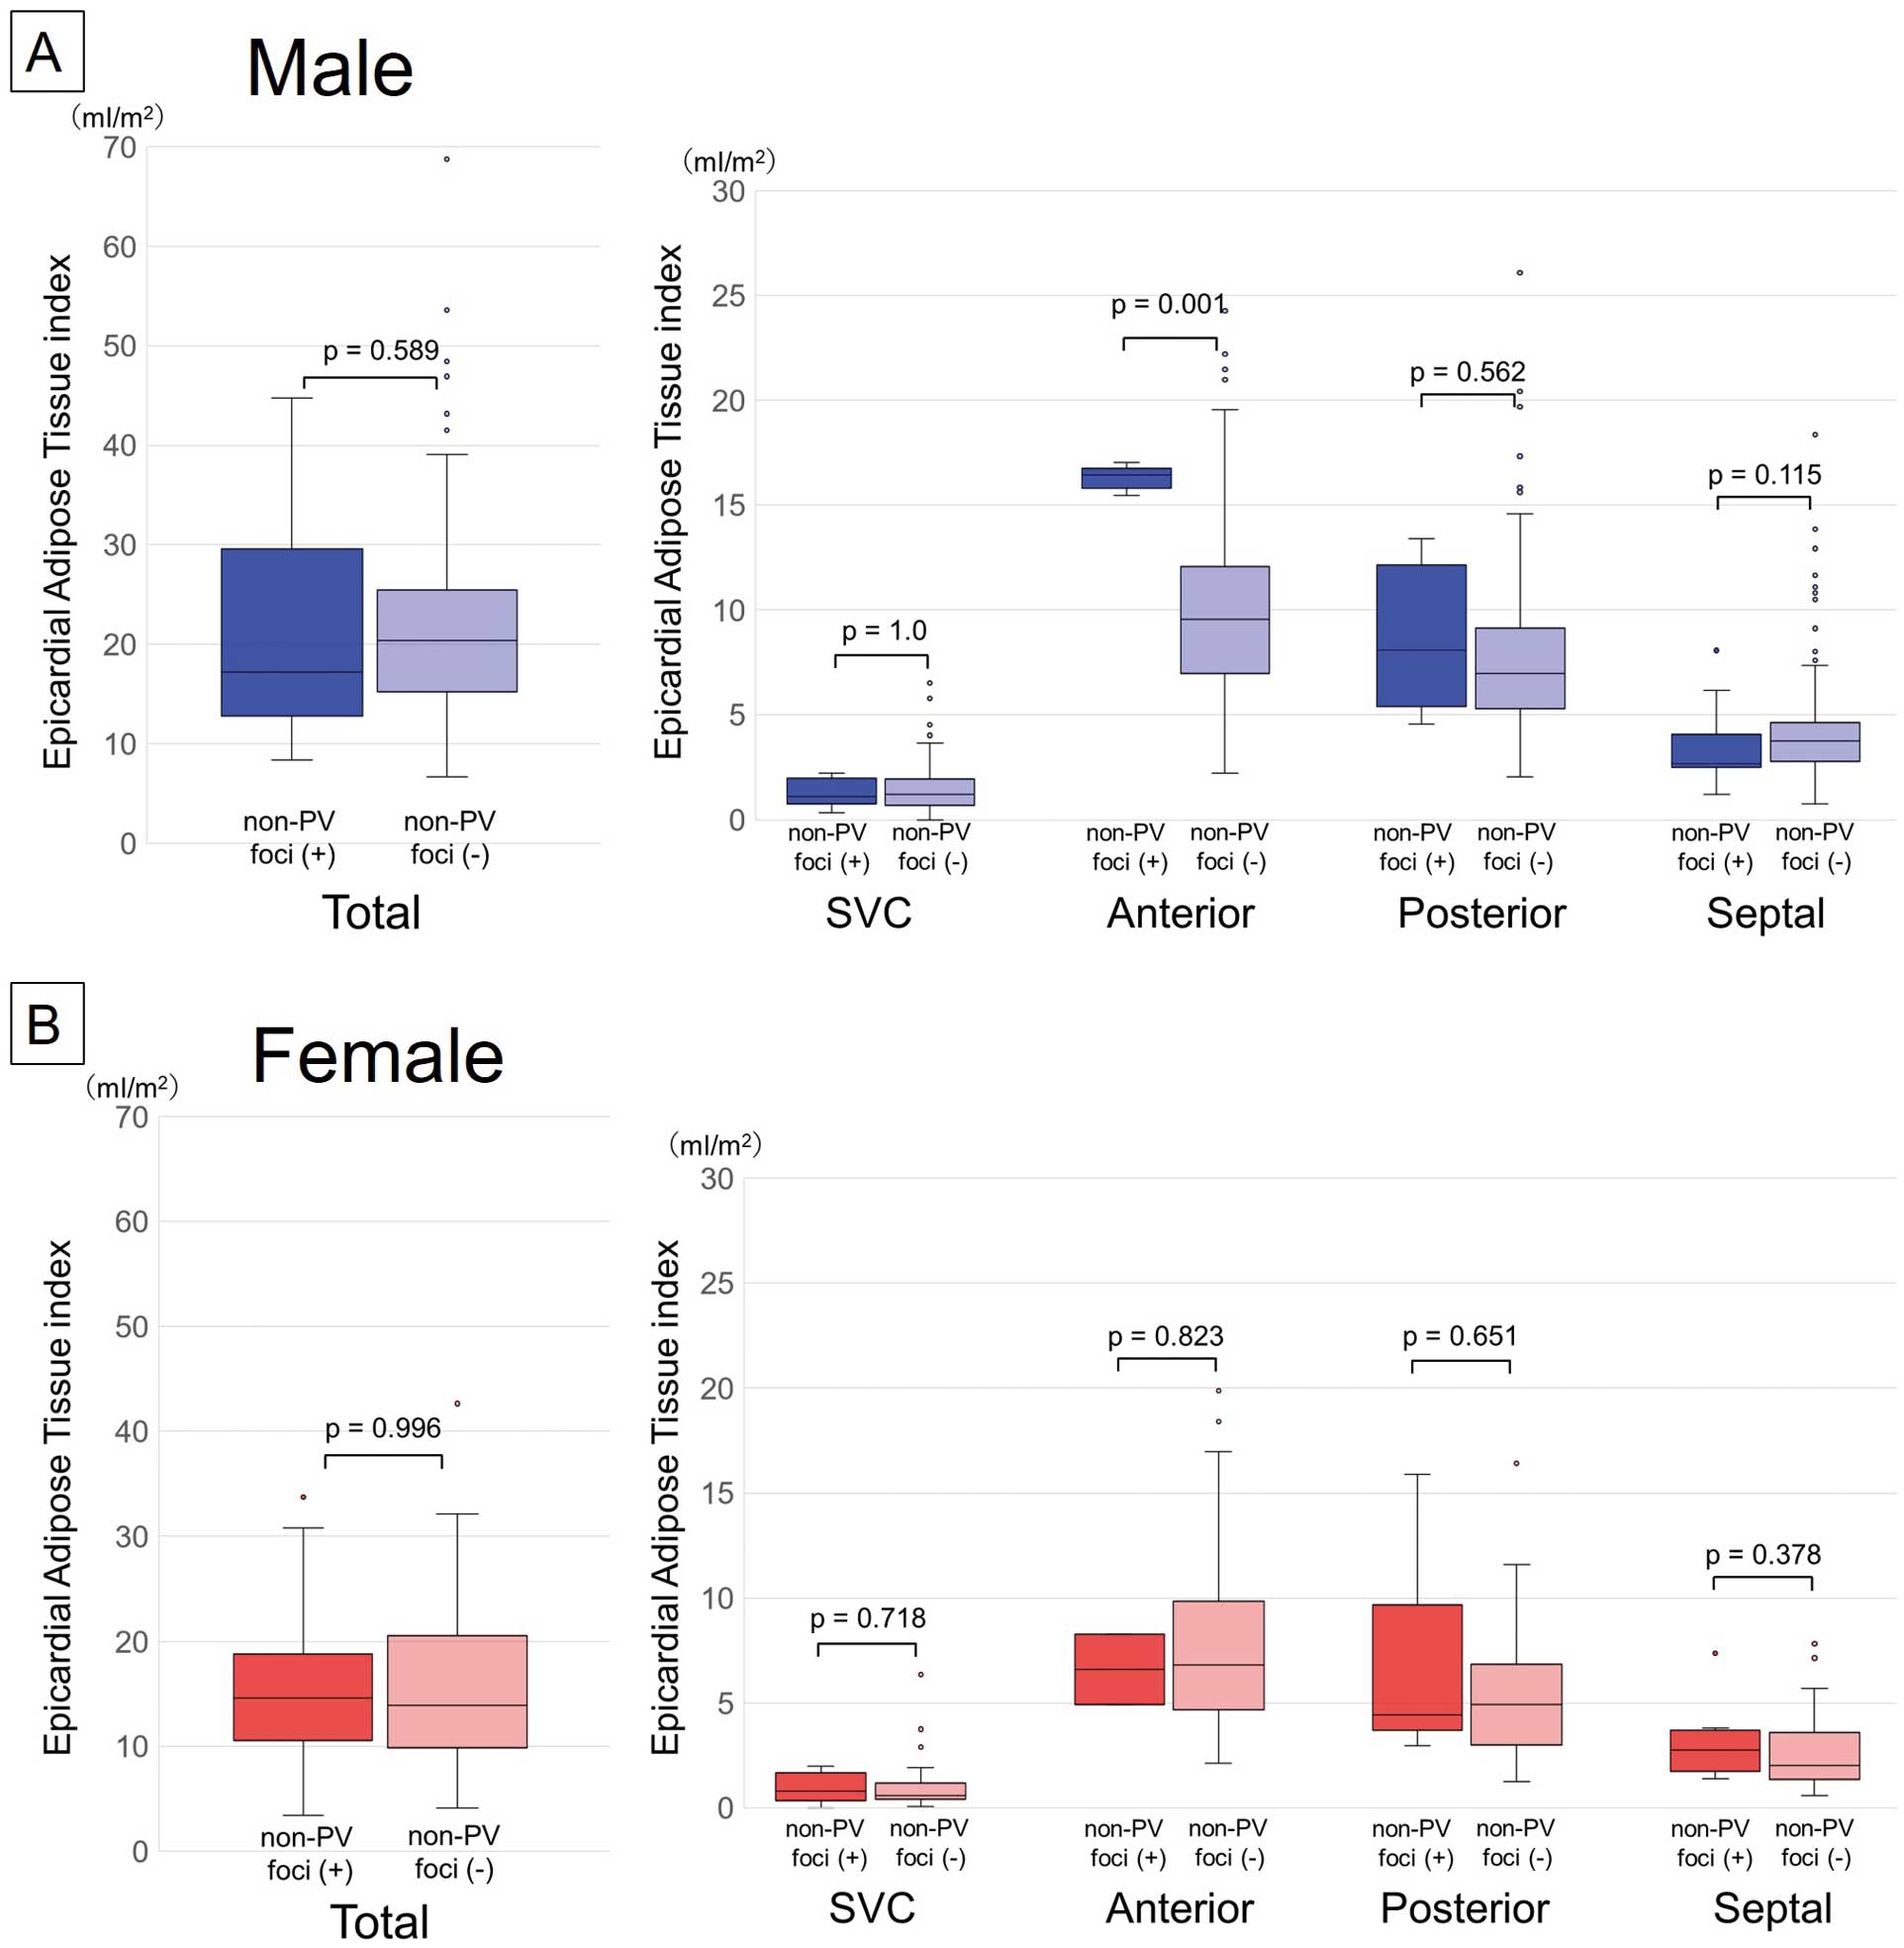
Figure 3 shows the relationship between the non-PV foci and the EAT index around the atrium for each sex. In male patients, no significant differences existed in the total EAT index between those with and without non-PV foci. However, male patients with non-PV foci on the anterior wall region had a significantly greater EAT index in the same lesion than did the patients without non-PV foci (16.4 vs. 9.6 mL, P=0.001) (Figure 3A). In female patients, the total and local EAT indices did not significantly differ between those with and without non-PV foci (Figure 3B).
Procedures for Catheter Ablation of AF
Table 2 shows the details of the procedures during the 1st and repeat catheter ablations. In addition to PVI, focal ablation and SVC isolation were more often performed in patients with non-PV foci for both sexes in the 1st catheter ablation (Table 2A). In the 2nd catheter ablation session (Table 2B), the frequency of reconnected PVs and a re-isolation of the PVs did not significantly differ between the patients with and without non-PV foci. Focal ablation and SVC isolation were also more frequently performed in patients with non-PV foci in the 2nd and 3rd catheter ablation sessions for both sexes (Table 2B,C).
Table 2. Ablation Procedures in the 1st Session (A), 2nd Session (B), 3rd Session (C), 4th Session (D)
| (A) 1st session |
Male |
Female |
Non-PV foci (+)
(n=51) |
Non-PV foci (−)
(n=178) |
P value |
Non-PV foci (+)
(n=28) |
Non-PV foci (−)
(n=47) |
P value |
| PV isolation |
51 (100) |
178 (100) |
1 |
28 (100) |
47 (100) |
1 |
| Focal ablation |
9 (18) |
11 (6.2) |
0.02 |
10 (36) |
3 (6.4) |
<0.01 |
| Coronary sinus |
0 |
0 |
1 |
0 |
0 |
1 |
| Linear ablation |
21 (41) |
71 (40) |
0.87 |
10 (36) |
13 (28) |
0.46 |
| Roof |
2 (3.9) |
7 (3.9) |
1 |
0 |
4 (8.5) |
0.29 |
| Bottom |
2 (3.9) |
1 (0.6) |
0.25 |
0 |
1 (2.1) |
1 |
| CTI |
19 (37) |
68 (38) |
0.9 |
10 (36) |
10 (21) |
0.17 |
| Mitral isthmus |
0 |
0 |
1 |
0 |
1 (2.1) |
1 |
| SVC isolation |
8 (16) |
3 (1.7) |
<0.01 |
2 (7.1) |
0 |
0.26 |
| CFAE ablation |
6 (12) |
7 (3.9) |
0.07 |
0 |
2 (4.3) |
0.71 |
| Low voltage zone ablation |
0 |
0 |
1 |
0 |
0 |
1 |
| (B) 2nd session |
Male |
Female |
Non-PV foci (+)
(n=27) |
Non-PV foci (−)
(n=60) |
P value |
Non-PV foci (+)
(n=17) |
Non-PV foci (−)
(n=12) |
P value |
| Repeat PVI |
27 (100) |
58 (97) |
0.85 |
13 (76) |
12 (100) |
0.21 |
| LSPV |
19 (70) |
42 (70) |
0.97 |
9 (53) |
9 (75) |
0.41 |
| LIPV |
12 (44) |
35 (58) |
0.23 |
4 (24) |
8 (67) |
0.05 |
| RSPV |
20 (74) |
48 (80) |
0.54 |
8 (47) |
7 (58) |
0.55 |
| RIPV |
17 (63) |
41 (68) |
0.62 |
8 (47) |
11 (92) |
0.04 |
| Focal ablation |
16 (59) |
14 (23) |
<0.01 |
10 (59) |
1 (8.3) |
<0.01 |
| Coronary sinus |
3 (11) |
1 (1.7) |
0.16 |
0 |
0 |
1 |
| Linear ablation |
16 (59) |
46 (77) |
0.10 |
12 (71) |
11 (92) |
0.36 |
| Roof |
8 (30) |
18 (30) |
0.97 |
4 (24) |
6 (50) |
0.28 |
| Bottom |
1 (3.7) |
3 (5) |
1 |
0 |
2 (17) |
0.32 |
| CTI |
12 (44) |
35 (58) |
0.23 |
10 (59) |
6 (50) |
0.64 |
| Mitral isthmus |
3 (11) |
8 (13) |
1 |
0 |
5 (42) |
0.02 |
| SVC isolation |
7 (26) |
2 (3.3) |
<0.01 |
8 (47) |
2 (17) |
0.19 |
| CFAE ablation |
9 (33) |
20 (33) |
1 |
3 (18) |
3 (25) |
0.99 |
| Low voltage zone ablation |
0 |
0 |
1 |
0 |
1 (8.3) |
0.86 |
| (C) 3rd session |
Male |
Female |
Non-PV foci (+)
(n=10) |
Non-PV foci (−)
(n=8) |
P value |
Non-PV foci (+)
(n=4) |
Non-PV foci (−)
(n=2) |
P value |
| Repeat PVI |
4 (40) |
3 (38) |
1 |
2 (50) |
1 (50) |
1 |
| LSPV |
1 (10) |
1 (13) |
1 |
0 |
0 |
1 |
| LIPV |
4 (40) |
3 (38) |
1 |
1 (25) |
0 |
1 |
| RSPV |
2 (20) |
2 (25) |
1 |
1 (25) |
1 (50) |
1 |
| RIPV |
1 (10) |
2 (25) |
0.83 |
1 (25) |
1 (50) |
1 |
| Focal ablation |
5 (50) |
1 (13) |
0.24 |
3 (75) |
0 |
0.39 |
| Coronary sinus |
0 |
0 |
1 |
0 |
0 |
1 |
| Linear ablation |
7 (70) |
8 (100) |
0.29 |
3 (75) |
1 (50) |
1 |
| Roof |
5 (50) |
7 (88) |
0.24 |
3 (75) |
1 (50) |
1 |
| Bottom |
4 (40) |
4 (50) |
1 |
2 (50) |
1 (50) |
1 |
| CTI |
3 (30) |
2 (25) |
1 |
2 (50) |
0 |
0.76 |
| Mitral isthmus |
1 (10) |
4 (50) |
0.18 |
0 |
0 |
1 |
| SVC isolation |
6 (60) |
1 (13) |
0.12 |
2 (50) |
0 |
0.76 |
| CFAE ablation |
2 (20) |
2 (25) |
1 |
1 (25) |
0 |
1 |
| Low voltage zone ablation |
0 |
0 |
1 |
0 |
0 |
1 |
| (D) 4th session |
Male |
Female |
Non-PV foci (+)
(n=1) |
Non-PV foci (−)
(n=0) |
P value |
Non-PV foci (+)
(n=0) |
Non-PV foci (−)
(n=2) |
P value |
| Repeat PVI |
0 |
0 |
1 |
0 |
0 |
1 |
| LSPV |
0 |
0 |
1 |
0 |
0 |
1 |
| LIPV |
0 |
0 |
1 |
0 |
0 |
1 |
| RSPV |
0 |
0 |
1 |
0 |
0 |
1 |
| RIPV |
0 |
0 |
1 |
0 |
0 |
1 |
| Focal ablation |
0 |
0 |
1 |
0 |
0 |
1 |
| Coronary sinus |
0 |
0 |
1 |
0 |
0 |
1 |
| Linear ablation |
1 (100) |
0 |
1 |
0 |
1 (50) |
1 |
| Roof |
1 (100) |
0 |
1 |
0 |
1 (50) |
1 |
| Bottom |
1 (100) |
0 |
1 |
0 |
1 (50) |
1 |
| CTI |
1 (100) |
0 |
1 |
0 |
0 |
1 |
| Mitral isthmus |
0 |
0 |
1 |
0 |
0 |
1 |
| SVC isolation |
0 |
0 |
1 |
0 |
0 |
1 |
| CFAE ablation |
1 (100) |
0 |
1 |
0 |
0 |
1 |
| Low voltage zone ablation |
0 |
0 |
1 |
0 |
0 |
1 |
| Rotor ablation |
0 |
0 |
1 |
0 |
1 (50) |
1 |
CFAE, complex fractionated atrial electrogram; CTI, cavotricuspid isthmus; LIPV, left inferior pulmonary vein; LSPV, left superior pulmonary vein; PV, pulmonary vein; PVI, pulmonary vein isolation; RIPV, right inferior pulmonary vein; RSPV, right superior pulmonary vein; SVC, superior vena cava. Other abbreviations as in Table 1.
AADs were used in 84 of 229 (37%) male patients and in 29 of 75 (39%) female patients after the 1st catheter ablation. In the male patients, the frequency of AAD use after catheter ablation did not significantly differ between the patients with and without non-PV foci (21 [41%] vs. 63 [35%], P=0.45). In the female patients, however, AADs after catheter ablation were significantly more often used in patients with than without non-PV foci (18 [64%] vs. 11 [23%], P<0.01). Details of the use of AADs are shown in Table 3.
Table 3. Use of Antiarrhythmic Drugs (AADs) Before and After Catheter Ablation
| |
Male |
Female |
Total
(n=229) |
Non-PV
foci (+)
(n=51) |
Non-PV
foci (−)
(n=178) |
P values |
Total
(n=75) |
Non-PV
foci (+)
(n=28) |
Non-PV
foci (−)
(n=47) |
P values |
| Before ablation |
| AAD+ |
167 (73%) |
35 (69%) |
132 (74%) |
0.43 |
55 (73%) |
22 (79%) |
33 (70%) |
0.43 |
| Sodium channel blocker |
110 (48%) |
22 (43%) |
88 (49%) |
0.43 |
36 (48%) |
14 (50%) |
22 (47%) |
0.79 |
| Class III drug |
4 (2%) |
1 (2%) |
3 (2%) |
1 |
1 (1%) |
0 |
1 (2%) |
1 |
| Class IV drug |
83 (36%) |
19 (37%) |
64 (36%) |
0.86 |
29 (39%) |
10 (36%) |
19 (40%) |
0.69 |
| After 1st catheter ablation |
| AAD+ |
84 (37%) |
21 (41%) |
63 (35%) |
0.45 |
29 (39%) |
18 (64%) |
11 (23%) |
<0.01 |
| Sodium channel blocker |
44 (19%) |
10 (20%) |
34 (19%) |
0.94 |
17 (23%) |
11 (39%) |
6 (13%) |
<0.01 |
| Class III drug |
5 (2%) |
1 (2%) |
4 (2%) |
1 |
0 (0%) |
0 |
0 |
1 |
| Class IV drug |
49 (21%) |
15 (29%) |
34 (19%) |
0.11 |
18 (24%) |
11 (39%) |
7 (15%) |
0.02 |
The patients were followed up for a median of 27 (12–95) months, mostly at the hospital or clinics. If not, we contacted the patients by telephone to ask about any AF recurrence. In Figure 4A,B, a Kaplan-Meier curve shows the AF-free survival rate after the 1st catheter ablation for patients with and without non-PV foci following a 3-month blanking period after PVI. For both sexes, the AF-free survival rate was significantly lower in those with non-PV foci than in those without. Figure 4C,D shows the AF-free survival rate after the last catheter ablation. In female patients with non-PV foci, the AF-free survival rate after the last catheter ablation did not significantly differ from that in those without non-PV foci.

Table 4 shows the multivariate analysis of the predictors of AF recurrence after 1st catheter ablation. In the total cohort (Table 4A), the predictors of AF recurrence were female sex (HR: 1.55, 95% CI [1.03–2.32]), the presence of non-PV foci (HR: 2.16, 95% CI [1.52–3.06]), LA diameter (HR: 1.03, 95% CI [1.00–1.06]), and septal EAT index (HR: 1.09, 95% CI [1.01–1.18]). Table 4B shows the sex-specific analysis of the predictors of AF recurrence. The LA diameter was a predictor in males only (HR: 1.05, 95% CI [1.01–1.09]), and the presence of non-PV foci, especially septal non-PV foci, was a strong predictor in both sexes (HR: 2.24, 95% CI [1.18–4.27] in males, HR: 3.65, 95% CI [1.50–8.86] in females).
Table 4. Predictors of AF Recurrence Among All Patients (A), Male and Female Patients (B)
| (A) All |
All patients |
|
|
|
|
| Multivariate |
Univariate |
|
|
|
|
| HR (95% CI) |
P value |
HR (95% CI) |
P value |
|
|
|
|
| Age |
0.983
(0.965–1.002) |
0.085 |
|
|
|
|
|
|
| Sex |
1.548
(1.031–2.323) |
0.035 |
1.292
(0.910–1.835) |
0.153 |
|
|
|
|
| AF type |
1.003
(0.695–1.450) |
0.985 |
|
|
|
|
|
|
| LVEF |
1.001
(0.981–1.022) |
0.909 |
|
|
|
|
|
|
| LAD |
1.033
(1.003–1.064) |
0.03 |
1.030
(1.003–1.057) |
0.03 |
|
|
|
|
| AF duration |
1.001
(0.999–1.003) |
0.32 |
|
|
|
|
|
|
| Hypertension |
0.997
(0.704–1.412) |
0.985 |
|
|
|
|
|
|
| Non-PV foci |
2.156
(1.518–3.063) |
<0.001 |
2.088
(1.501–2.904) |
<0.001 |
|
|
|
|
| SVC Non-PV |
1.719
(1.034–2.859) |
0.037 |
1.496
(0.923–2.424) |
0.102 |
|
|
|
|
| Anterior Non-PV |
1.615
(0.612–4.262) |
0.333 |
|
|
|
|
|
|
| Posterior Non-PV |
1.669
(0.722–3.862) |
0.231 |
|
|
|
|
|
|
| Septal Non-PV |
2.664
(1.612–4.401) |
<0.001 |
2.364
(1.447–3.862) |
<0.001 |
|
|
|
|
| RA Non-PV |
1.719
(1.042–2.836) |
0.034 |
1.860
(1.167–2.966) |
0.009 |
|
|
|
|
| Periatrial EAT |
1.011
(0.990–1.032) |
0.303 |
|
|
|
|
|
|
| SVC EAT |
1.032
(0.885–1.204) |
0.685 |
|
|
|
|
|
|
| Anterior EAT |
1.000
(0.957–1.045) |
0.999 |
|
|
|
|
|
|
| Posterior EAT |
1.034
(0.982–1.089) |
0.203 |
|
|
|
|
|
|
| Septal EAT |
1.094
(1.012–1.182) |
0.024 |
1.070
(1.002–1.144) |
0.044 |
|
|
|
|
| (B) Male and Female |
Male |
Female |
| Multivariate |
Univariate |
Multivariate |
Univariate |
| HR (95% CI) |
P value |
HR (95% CI) |
P value |
HR (95% CI) |
P value |
HR (95% CI) |
P value |
| Age |
0.979
(0.958–1.001) |
0.065 |
|
|
0.989
(0.947–1.032) |
0.602 |
|
|
| AF type |
0.888
(0.581–1.356) |
0.582 |
|
|
1.610
(0.725–3.574) |
0.242 |
|
|
| LVEF |
1.004
(0.981–1.028) |
0.741 |
|
|
0.984
(0.935–1.036) |
0.545 |
|
|
| LAD |
1.052
(1.013–1.093) |
0.009 |
1.051
(1.016–1.087) |
0.004 |
1.002
(0.953–1.054) |
0.938 |
|
|
| AF duration |
1.002
(0.999–1.004) |
0.232 |
|
|
1.002
(0.996–1.007) |
0.562 |
|
|
| Hypertension |
1.082
(0.706–1.656) |
0.718 |
|
|
0.741
(0.359–1.526) |
0.416 |
|
|
| Non-PV foci |
1.818
(1.186–2.789) |
0.006 |
1.854
(1.246–2.760) |
0.002 |
2.950
(1.440–6.044) |
0.003 |
2.704
(1.449–5.046) |
0.002 |
| SVC Non-PV |
1.515
(0.802–2.860) |
0.201 |
|
|
2.138
(0.873–5.238) |
0.097 |
|
|
| Anterior Non-PV |
1.081
(0.310–3.774) |
0.903 |
|
|
4.693
(0.954–23.080) |
0.057 |
|
|
| Posterior Non-PV |
1.627
(0.500–5.296) |
0.419 |
|
|
1.008
(0.284–3.575) |
0.991 |
|
|
| Septal Non-PV |
2.240
(1.177–4.265) |
0.014 |
1.467
(0.814–2.645) |
0.024 |
3.646
(1.501–8.855) |
0.004 |
2.874
(1.273–6.487) |
0.011 |
| RA Non-PV |
1.467
(0.814–2.645) |
0.203 |
|
|
2.335
(0.808–6.753) |
0.118 |
|
|
| Periatrial EAT |
1.009
(0.986–1.032) |
0.434 |
|
|
1.011
(0.950–1.076) |
0.733 |
|
|
| SVC EAT |
1.050
(0.895–1.232) |
0.551 |
|
|
0.696
(0.389–1.244) |
0.221 |
|
|
| Anterior EAT |
0.996
(0.947–1.047) |
0.873 |
|
|
1.006
(0.902–1.122) |
0.909 |
|
|
| Posterior EAT |
1.031
(0.976–1.089) |
0.28 |
|
|
1.044
(0.882–1.236) |
0.616 |
|
|
| Septal EAT |
1.082
(0.992–1.179) |
0.074 |
|
|
1.072
(0.798–1.440) |
0.646 |
|
|
CI, confidence interval; EAT, epicardial adipose tissue; HR, hazard ratio; RA, right atrium. Other abbreviations as in Tables 1,2.
Discussion
Sex Differences in Non-PV Foci
The incidence of non-PV foci has been reported to be higher in female AF patients than in male patients,9–11 which concords with our results. However, the existence of sex differences in non-PV sites remains controversial in previous studies.9–11 We found clear sex differences in the incidence of non-PV foci in different regions of the atrium. In the posterior LA in particular, the incidence of non-PV foci was 5-fold higher in female patients than in male patients. Having a LA with arrhythmogenic substrates, including the site of aortic encroachment, might explain abnormal automaticity or activity exhibiting a low voltage and fractionated electrograms with prolonged duration.12 The effects of sex hormones on the calcium handling properties in the atrium have been previously reported13 Estrogen increases the propensity for triggered activity, and in contrast, testosterone reduces triggered activity. A study on rabbits also revealed significant sex differences in late sodium currents and calcium transients in the LA posterior wall.14 Those findings could explain the sex differences we found regarding the frequency of non-PV foci in each LA region.
Sex Differences in EAT
The total and local EAT indices in each region were uniformly greater in male patients than in female patients. The amount of epicardial fat is directly related to the amount of general body adiposity.15 The Framingham Heart Study has also shown that both intrathoracic and pericardial fat volumes are larger in males than in females.16 In the present study, the body mass index in male patients was higher than in female patients, which could have caused a sex difference in the EAT index.
Relationship Between Non-PV Foci and Local EAT
To the best of our knowledge, this is the first study to investigate the regional relationship between non-PV foci sites and local EAT for each sex. A significant relationship between the presence of non-PV foci and local EAT volume was not seen at most sites around the atrium. Previous studies showed that EAT secretes adipokines that induce electrical remodeling and promote atrial fibrosis,15 which may contribute to AF substrate formation. In contrast, non-PV foci are triggers of AF and are caused by different factors in different locations. Regions capable of spontaneous depolarization have been identified at the junctions between different embryonic tissues, such as the RA–SVC junction, crista terminalis, and CS ostium.17 Catecholamine-sensitive ectopy exhibits high-frequency depolarizations with fibrillatory conduction, and catecholamine-sensitive tissue in the ligament of Marshall and CS has abnormal automaticity that could be a potential source of AF initiation.18 These complex etiologies of non-PV foci would cause a lesser relationship between non-PV foci and the local EAT volume.
However, only in male patients, those with non-PV foci on the LA anterior wall had significantly greater EAT for the same lesions than those without non-PV foci. One of the assumed mechanisms is the relationship between the activity of the ganglionated plexi (GPs) and local EAT. We previously reported that high-frequency stimulation of the GPs significantly causes rapid firing of AF in the adjacent area.19 The presence of GPs within EAT has been also previously reported, and EAT has been correlated with 93±14% of the 5 anatomical GP regions.20 The area of EAT of the LA anterior wall contains 2 major GPs (Marshall tract GP and superior left GP). In addition, Iso et al reported that an increased number of GP sites in the LA correlates with being male.21 Therefore, we assumed that the existence of greater EAT in the LA anterior region could indicate higher GP activity in male patients, resulting in a higher incidence of non-PV foci in that region. However, evidence of a direct relationship between local EAT and GPs was not revealed in the present study. A further prospective study is needed to investigate that.
Predictors of AF Recurrence
The predictors of AF recurrence (LA diameter, female sex, and existence of non-PV foci) reported in the previous studies10,11,22 were also shown in the present study. PV reconnections are a major factor in recurrence of AF; however, the 2nd catheter ablation procedures in this study showed that the frequency of reconnected PVs and re-isolation of the PVs did not significantly differ between patients with and without non-PV foci. These results suggested the existence of non-PV foci would severely affect AF recurrence. In addition, regional analysis of the non-PV foci sites and local EAT volume in the present study demonstrated that (1) the presence of non-PV foci in the septal region was a strong predictor of AF recurrence in both male and female patients, and (2) the EAT volume in the septum was a predictor of AF recurrence in the general cohort.
Non-PV Foci in the Septal Region An SVC isolation or posterior wall isolation could eliminate the origin of the non-PV foci in that region. However, identifying the exact sites of septal non-PV foci could be more difficult and take time during the 1st catheter ablation. In addition, RF applications delivered from both sides of the RA and LA septum are often needed to eliminate septal non-PV foci because of the thickness of the atrial septal wall. These technical issues with septal non-PV foci ablation might cause AF recurrence.
In female patients with non-PV foci, the AF recurrence-free rate after the last catheter ablation did not significantly differ between patients with and without non-PV foci. An ablation strategy in the repeat catheter ablation sessions would partially work to reduce or eliminate the non-PV foci. However, the number of female patients who underwent repeat catheter ablation procedures was small, and therefore we should take care when interpreting the AF recurrence rate after the last catheter ablation.
Septal EAT Volume Samanta et al23 recently reported that the interatrial septal fat volume quantified by high-resolution CT was greater in patients with atrial arrhythmia recurrence than in those without. They found that septal fat was associated with prolonged transseptal conduction time and P-wave duration. These electrical abnormalities induced by a high volume of EAT in the septum might cause AF recurrence, in which case those findings would support the results of the present study.
LA Diameter We found that LA diameter was a predictor of AF recurrence only in males, not in females. Female AF patients tend to have smaller bodies than male patients, and they often have smaller LA diameters than males.9,24 A recent study showed that female AF patients demonstrated more advanced atrial remodeling and higher AF recurrence rates post-catheter ablation than male patients.25 Sex differences in fibrosis remodeling are mainly due to the inherent differential expression of fibrosis-related genes and proteins.26 Susceptability to fibrosis remodeling in the LA would further complicate the risk of AF recurrence in female patients.
Clinical Implications
In males, local EAT on the anterior wall may be a potential ablation target for non-PV foci. If a large amount of EAT is localized on the anterior wall on the preoperative CT, it can be assumed that the patient has non-PV foci in the anterior wall region. In females, routine SVC isolation and posterior wall isolation might be useful strategies in addition to PVI to eliminate non-PV foci. Identifying the origin and eliminating septal non-PV foci is likely to be difficult technically, so careful observation of AF recurrence following catheter ablation is needed in both males and females with septal non-PV foci.
Study Limitations
First, this study was neither prospective nor experimental; it was a single-center observational study. In addition, the sample size was small, and further experimental prospective studies are needed to confirm the accuracy of our results. Second, to standardize the measurement of EAT, we should have excluded patients with renal failure who could not undergo contrast-enhanced CT. Third, procedures in addition to PVI were performed at the discretion of the surgeons, which could have affected the outcomes following AF ablation. Fourth, we enrolled patients who underwent catheter ablation between 2009 and 2012 because investigating long-term follow-up after catheter ablation was important regarding the effect of sex differences. Therefore, the ablation catheter used in AF ablation did not have a contact force-sensing function, and the electroanatomical mapping system differed from the current version. These factors might have affected the quality of the ablation procedure and the outcomes.
Conclusions
We observed sex differences in the sites of non-PV foci, the local EAT index, the regional relationship between them, and the predictors of AF recurrence. The presence of non-PV foci in the septal region was a strong predictor of AF recurrence in both sexes. The EAT volume in the septum was also a predictor of AF recurrence in the general cohort.
Acknowledgments
We thank Mr. John Martin for editing the language in the manuscript.
Funding
This study was not supported by any funding sources.
Conflicts of Interest
The Section of Arrhythmia is supported by endowments from Abbott JAPAN and Medtronic JAPAN and has received a scholarship funding from Biotronik JAPAN. K.H. chairs the Section, and K.F., M.T. belong to the Section. However, all authors report no conflicts of interest regarding this manuscript’s contents.
Disclosures
K.H. is a member of Circulation Journal’s Editorial Team.
IRB Information
The protocol for this research project was approved by the suitably constituted Ethics Committee of Kobe University Hospital, and the project conformed to the provisions of the Declaration of Helsinki (Approval No. B210211).
Data Availability
The deidentified participant data will not be shared.
References
- 1.
Perino AC, Leef GC, Cluckey A, Yunus FN, Askari M, Heidenreich PA, et al. Secular trends in success rate of catheter ablation for atrial fibrillation: The SMASH-AF cohort. Am Heart J 2019; 208: 110–119.
- 2.
Cheng X, Hu Q, Gao L, Liu J, Qin S, Zhang D. Sex-related differences in catheter ablation of atrial fibrillation: A systematic review and meta-analysis. Europace 2019; 21: 1509–1518.
- 3.
Wong GR, Nalliah CJ, Lee G, Voskoboinik A, Chieng D, Prabhu S, et al. Sex-related differences in atrial remodeling in patients with atrial fibrillation: Relationship to ablation outcomes. Circ Arrhythm Electrophysiol 2022; 15: e009925.
- 4.
Yunus FN, Perino AC, Holmes DN, Matsouaka RA, Curtis AB, Ellenbogen KA, et al. Sex differences in ablation strategy, lesion sets, and complications of catheter ablation for atrial fibrillation: An analysis from the GWTG-AFIB registry. Circ Arrhythm Electrophysiol 2021; 14: e009790.
- 5.
Shah D, Haissaguerre M, Jais P, Hocini M. Nonpulmonary vein foci: Do they exist? Pacing Clin Electrophysiol 2003; 26: 1631–1635.
- 6.
Schotten U, Verheule S, Kirchhof P, Goette A. Pathophysiological mechanisms of atrial fibrillation: A translational appraisal. Physiol Rev 2011; 91: 265–325.
- 7.
Wong CX, Abed HS, Molaee P, Nelson AJ, Brooks AG, Sharma G, et al. Pericardial fat is associated with atrial fibrillation severity and ablation outcome. J Am Coll Cardiol 2011; 57: 1745–1751.
- 8.
Hasebe H, Yoshida K, Nogami A, Ieda M. Difference in epicardial adipose tissue distribution between paroxysmal atrial fibrillation and coronary artery disease. Heart Vessels 2020; 35: 1070–1078.
- 9.
Takigawa M, Kuwahara T, Takahashi A, Watari Y, Okubo K, Takahashi Y, et al. Differences in catheter ablation of paroxysmal atrial fibrillation between males and females. Int J Cardiol 2013; 168: 1984–1991.
- 10.
Kato N, Nitta J, Sato A, Inamura Y, Takamiya T, Inaba O, et al. Characteristics of the nonpulmonary vein foci induced after second-generation cryoballoon ablation for paroxysmal atrial fibrillation. J Cardiovasc Electrophysiol 2020; 31: 174–184.
- 11.
Tanaka N, Inoue K, Kobori A, Kaitani K, Morimoto T, Kurotobi T, et al. Sex differences in atrial fibrillation ablation outcomes: Insights from a large-scale multicentre registry. Europace 2020; 22: 1345–1357.
- 12.
Allamsetty S, Lo LW, Lin YJ, Chang SL, Chung FP, Hu YF, et al. Impact of aortic encroachment to left atrium on non-pulmonary vein triggers of atrial fibrillation. Int J Cardiol 2017; 227: 650–655.
- 13.
Odening KE, Deiß S, Dilling-Boer D, Didenko M, Eriksson U, Nedios S, et al. Mechanisms of sex differences in atrial fibrillation: Role of hormones and differences in electrophysiology, structure, function, and remodelling. Europace 2019; 21: 366–376.
- 14.
Tsai WC, Chen YC, Kao YH, Lu YY, Chen SA, Chen YJ. Distinctive sodium and calcium regulation associated with sex differences in atrial electrophysiology of rabbits. Int J Cardiol 2013; 168: 4658–4666.
- 15.
Ernault AC, Meijborg VMF, Coronel R. Modulation of cardiac arrhythmogenesis by epicardial adipose tissue: JACC state-of-the-art review. J Am Coll Cardiol 2021; 78: 1730–1745.
- 16.
Lee JJ, Yin X, Hoffmann U, Fox CS, Benjamin EJ. Relation of pericardial fat, intrathoracic fat, and abdominal visceral fat with incident atrial fibrillation (from the Framingham Heart Study). Am J Cardiol 2016; 118: 1486–1492.
- 17.
Chen YJ, Chen YC, Yeh HI, Lin CI, Chen SA. Electrophysiology and arrhythmogenic activity of single cardiomyocytes from canine superior vena cava. Circulation 2002; 105: 2679–2685.
- 18.
Doshi RN, Wu TJ, Yashima M, Kim YH, Ong JJ, Cao JM, et al. Relation between ligament of marshall and adrenergic atrial tachyarrhythmia. Circulation 1999; 100: 876–883.
- 19.
Takami M, Yamashiro K, Sakamoto Y, Satoh K, Suzuki T. Impact of ganglionated plexi ablation on high-frequency stimulation-induced changes in atrial fibrillation cycle length in the pulmonary vein. J Arrhythmia 2014; 30: 356–361.
- 20.
Takahashi K, Okumura Y, Watanabe I, Nagashima K, Sonoda K, Sasaki N, et al. Anatomical proximity between ganglionated plexi and epicardial adipose tissue in the left atrium: Implication for 3D reconstructed epicardial adipose tissue-based ablation. J Interv Card Electrophysiol 2016; 47: 203–212.
- 21.
Iso K, Okumura Y, Watanabe I, Nagashima K, Takahashi K, Arai M, et al. Is vagal response during left atrial ganglionated plexi stimulation a normal phenomenon?: Comparison between patients with and without atrial fibrillation. Circ Arrhythm Electrophysiol 2019; 12: e007281.
- 22.
Oral H, Scharf C, Chugh A, Hall B, Cheung P, Good E, et al. Catheter ablation for paroxysmal atrial fibrillation: Segmental pulmonary vein ostial ablation versus left atrial ablation. Circulation 2003; 108: 2355–2360.
- 23.
Samanta R, Houbois CP, Massin SZ, Seidman M, Wintersperger BJ, Chauhan VS. Interatrial septal fat contributes to interatrial conduction delay and atrial fibrillation recurrence following ablation. Circ Arrhythm Electrophysiol 2021; 14: e010235.
- 24.
Tian XT, Xu YJ, Yang YQ. Gender differences in arrhythmias: Focused on atrial fibrillation. J Cardiovasc Transl Res 2020; 13: 85–96.
- 25.
Cochet H, Mouries A, Nivet H, Sacher F, Derval N, Denis A, et al. Age, atrial fibrillation, and structural heart disease are the main determinants of left atrial fibrosis detected by delayed-enhanced magnetic resonance imaging in a general cardiology population. J Cardiovasc Electrophysiol 2015; 26: 484–492.
- 26.
Li Z, Wang Z, Yin Z, Zhang Y, Xue X, Han J, et al. Gender differences in fibrosis remodeling in patients with long-standing persistent atrial fibrillation. Oncotarget 2017; 8: 53714–53729.