Abstract
Background: The clinical impact of relative improvements in coronary physiology in patients receiving percutaneous coronary intervention (PCI) for coronary artery disease (CAD) remains undetermined.
Methods and Results: The quantitative flow ratio (QFR) recovery ratio (QRR) was calculated in 1,424 vessels in the PANDA III trial as (post-PCI QFR−pre-PCI QFR)/(1−pre-PCI QFR). The primary endpoint was the 2-year vessel-oriented composite endpoint (VOCE; a composite of vessel-related cardiac death, vessel-related non-procedural myocardial infarction, and ischemia-driven target vessel revascularization). Study vessels were dichotomously stratified according to the optimal QRR cut-off value. During the 2-year follow-up, 41 (2.9%) VOCEs occurred. Low (<0.86) QRR was associated with significantly higher rates of 2-year VOCEs than high (≥0.86) QRR (6.6% vs. 1.4%; adjusted hazard ratio [aHR] 5.05; 95% confidence interval [CI] 2.53–10.08; P<0.001). Notably, among vessels with satisfactory post-procedural physiological results (post-PCI QFR >0.89), low QRR also conferred an increased risk of 2-year VOCEs (3.7% vs. 1.4%; aHR 3.01; 95% CI 1.30–6.94; P=0.010). Significantly better discriminant and reclassification performance was observed after integrating risk stratification by QRR and post-PCI QFR to clinical risk factors (area under the curve 0.80 vs. 0.71 [P=0.010]; integrated discrimination improvement 0.05 [P<0.001]; net reclassification index 0.64 [P<0.001]).
Conclusions: Relative improvement of coronary physiology assessed by QRR showed applicability in prognostication. Categorical classification of coronary physiology could provide information for risk stratification of CAD patients.
Pressure wire-based fractional flow reserve (FFR) is the established gold standard to evaluate the physiological stenosis of obstructive coronary artery disease (CAD) and has been strongly recommended by guidelines to direct the strategy of percutaneous coronary intervention (PCI).1–6 The quantitative flow ratio (QFR) is an angiographically derived FFR measurement that does not require the use of a pressure wire or hyperemia-inducing agents.7 Several randomized controlled trials have verified the substantial correlation between QFR and pressure wire-based FFR for discriminating the hemodynamic significance of coronary stenosis.7–10 Recently, the FAVOR (Comparison of Quantitative Flow Ratio Guided and Angiography Guided Percutaneous Intervention in Patients with Coronary Artery Disease) III China trial further demonstrated that QFR-guided PCI strategy could improve clinical outcomes compared with standard angiographic guidance,11 suggesting the practical value of QFR for guiding revascularization decisions in patients with CAD.
Moreover, previous studies showed that post-PCI QFR assessment is one of the effective metrics to quantify residual functional burden, with a suboptimal post-PCI result strongly associated with worse outcomes.12–14 The multicenter prospective HAWKEYE study demonstrated that post-PCI QFR <0.89 was associated with a 3-fold increased risk of the vessel-oriented composite endpoint (VOCE).12 However, both the pre- and post-PCI QFR reflect instantaneous hemodynamic status rather than the relative improvement in hemodynamics. Although the post-PCI hemodynamic result can be identical, the extent of elimination of physiological ischemia differs in each patient and represents different prognostic significance.
To date, the prognostic value of the relative improvement of QFR in patients undergoing PCI remains uncertain. In the present study, we proposed a new concept, namely the QFR recovery ratio (QRR), which combines pre- and post-PCI QFR to reflect the extent of elimination of physiological ischemia. We retrospectively analyzed the QRR of patients enrolled in the all-comers randomized PANDA III (Comparison of BuMA eG Based BioDegradable Polymer Stent With EXCEL Biodegradable Polymer Sirolimus-eluting Stent in “Real-World” Practice) trial (NCT02017275)15 to assess the prognostic value of QRR.
Methods
Study Design and Population
The present study was a post hoc analysis of the PANDA III trial15 (NCT02017275). In the PANDA III trial, 2,348 patients from an “all-comers” population were randomly assigned to treatment with BuMA or an Excel sirolimus-eluting stent in order to explore whether the rate of drug elution and polymer absorption could affect clinical outcomes of biodegradable polymer-based drug-eluting stents. In the present study, we included all vessels with paired analyzable pre- and post-PCI QFR. Vessels were stratified according to QRR to compare 2-year clinical outcomes.
Both the present study and the PANDA III trial complied with the Declaration of Helsinki. The PANDA III trial and the present study were approved by the Institutional Review Board of Fuwai Hospital (Reference no. 2013-462), and all patients provided written informed consent.
QFR Measurement and QRR Calculation
For the present analysis, QFR measurements (i.e., pre- and post-PCI QFR) were retrospectively performed in all eligible vessels, defined as those containing at least 1 treated lesion. Following a standard interventional procedure,9 off-line pre- and post-PCI QFR analyses were performed by well-trained technicians in 2 independent angiographic core laboratories using the AngioPlus system (Pulse Medical Imaging Technology, Shanghai, China) based on pre- and post-PCI coronary angiograms, respectively. Details of QFR assessment have been reported previously and are described in the Supplementary Methods.15,16
QRR was a dynamic index integrating both pre- and post-PCI physiological results that can indicate the extent of elimination of physiological ischemia. Specifically, QRR is calculated using the following formula:
QRR = ∆QFR(1 − pre-PCI QFR)
where ∆QFR is defined as the difference between post- and pre-PCI QFR. In case of a post-PCI QFR less than the pre-PCI QFR, the QRR was recorded as 0.
Quantitative Coronary Angiography
Quantitative coronary angiography was assessed by certified technicians blinded to outcomes in an independent core laboratory (Beijing, China) using validated software (QAngio software version 7.3; Medis Medical Imaging Systems, Leiden, Netherlands). The following quantitative coronary angiography information was obtained: reference vessel diameter (RVD), minimum lumen diameter (MLD), percentage diameter stenosis (DS%), and lesion length.
Endpoints and Follow-up
The primary endpoint for the present study was 2-year VOCE, defined as a composite of vessel-related cardiac death, non-procedural target vessel myocardial infarction (TVMI), and ischemia-driven target vessel revascularization (ID-TVR). Secondary endpoints comprised a composite of cardiac death and TVMI, as well as individual components of the VOCE. All definitions of clinical endpoints were identical to those in the original PANDA III trial, with the adjudication of all predefined adverse events performed by an independent, blinded clinical events committee. For the present study, the original records, including initial coronary angiograms and source event documents, were reviewed and assessed by 2 interventional cardiologists (R.Z. and Z.Q.) in a blinded manner. All clinical events were re-adjudicated as being either vessel related or not. If cardiac death was recorded in a patient in whom interventions were performed in multiple vessels, the index event was considered for each vessel. Unless the culprit vessel was identified, myocardial infarction (MI) was attributed to all vessels in which the intervention was initially performed.17 In case of disagreement, angiograms and the source documents were reviewed by a third cardiologist to reach a final decision.
Statistical Analysis
Continuous variables are expressed as the mean±SD or as the median with interquartile range (IQR) and were compared using Student’s t-test or the Mann-Whitney U test, as appropriate. Categorical variables were presented as counts and percentages and were compared using Pearson’s χ2
test or Fisher’s exact test, as appropriate. Receiver operating characteristic (ROC) curve analysis with area under the curve (AUC) was used to identify the optimal cut-off value of QRR for the prediction of 2-year VOCE. The predictive performance of QRR and various indices for 2-year VOCE was analyzed using ROC curves and compared by the using the DeLong method. Clinical outcomes were estimated using Kaplan-Meier methodology and compared using log-rank tests. Cox proportional hazards analysis was performed to estimate hazard ratios (HR) and 95% confidence intervals (CIs). A multivariable Cox regression model was used to adjust for confounding factors. Variables that were either statistically significant on univariable analysis (P<0.10) or considered clinically important were included in the multivariable analysis, which included age, male sex, body mass index (BMI), hypertension, diabetes, smoking history, previous MI, previous PCI, left ventricular ejection fraction (LVEF), creatinine clearance, SYNTAX score, serial lesion, diffuse lesion, severe tortuous lesions, and total stent length.12,13,18–24 Compared with the predictive model including risk predictors (age, male sex, BMI, hypertension, diabetes, smoking history, previous MI, previous PCI, LVEF, creatinine clearance, SYNTAX score, serial lesion, diffuse lesion, severe tortuous lesions, and total stent length), the additional predictive performance of the new classification by QRR and post-PCI QFR was scrutinized by ROC analysis with AUC, the category-free net reclassification index (NRI), and the integrated discrimination improvement (IDI). In addition, patient-level analysis was performed to assess consistency with vessel-level findings (for details, see Supplementary Methods). Two-sided P<0.05 was considered to be statistically significant. All analyses were performed using SPSS version 25.0 (IBM Corp., Armonk, NY, USA).
Results
In the PANDA III trial, a total of 2,989 vessels from 2,348 patients were enrolled. Of these, we excluded 843 vessels without paired analyzable pre- and post-PCI QFRs, predominately due to the absence of calibration data in the DICOM file. In addition, we further excluded 93 vessels with pre-PCI QFR <0.3, and 535 patients with clinical presentation of acute MI. Finally, 1,424 vessels from 1,157 patients were included in this study (Supplementary Figure 1). A comparison of baseline characteristics between excluded and included patients is provided in Supplementary Table 1.
Baseline Characteristics
Baseline Characteristics are summarized in Table 1. The prevalence of hypertension, hyperlipidemia, and prior MI tended to be higher among patients having at least one vessel with low (<0.86) QRR (all P>0.05). Lower LVEF and higher SYNTAX scores were observed among patients with low QRR vessels compared with those with high (≥0.86) QRR in all treated vessels (both P<0.05). Other baseline characteristics were comparable between the 2 groups.
Table 1.
Baseline Characteristics for All Patients and After Stratification According to at Least 1 Vessel With a Suboptimal QRR (<0.86) or Not (≥0.86)
| |
Total
(NP=1,157) |
QRR ≥0.86
(NP=769) |
QRR <0.86
(NP=388) |
P value |
| Age (years) |
61.25±9.93 |
60.96±10.08 |
61.82±9.62 |
0.17 |
| Male sex |
766 (66.2) |
503 (65.4) |
263 (67.8) |
0.46 |
| BMI (kg/m2) |
24.88±3.51 |
24.81±3.45 |
25.01±3.61 |
0.36 |
| Diabetes |
283 (24.5) |
178 (23.1) |
105 (27.1) |
0.16 |
| Hypertension |
764 (66.0) |
489 (63.6) |
275 (70.9) |
0.016 |
| Hyperlipidemia |
387 (33.4) |
241 (31.3) |
146 (37.6) |
0.038 |
| Smoking history |
540 (46.7) |
365 (47.5) |
175 (45.1) |
0.49 |
| Positive family history |
61 (5.3) |
45 (5.9) |
16 (4.1) |
0.27 |
| Prior myocardial infarction |
163 (14.1) |
92 (12.0) |
71 (18.3) |
0.005 |
| Prior PCI |
149 (12.9) |
101 (13.1) |
48 (12.4) |
0.79 |
| Prior stroke |
130 (11.2) |
81 (10.5) |
49 (12.6) |
0.33 |
| Peripheral vascular disease |
44 (3.8) |
29 (3.8) |
15 (3.9) |
1.00 |
| LVEF (%) |
60.41±8.01 |
60.97±7.39 |
59.31±9.01 |
0.001 |
| Creatinine clearance (mL/min) |
92.17±53.74 |
93.67±61.91 |
89.19±31.72 |
0.19 |
| SYNTAX score |
13.95±8.98 |
12.92±8.63 |
16.00±9.32 |
<0.001 |
Unless indicated otherwise, values are presented as the mean±SD or n (%). BMI, body mass index; LVEF, left ventricular ejection fraction; NP, number of patients; PCI, percutaneous coronary intervention; QRR, quantitative flow ratio recovery ratio.
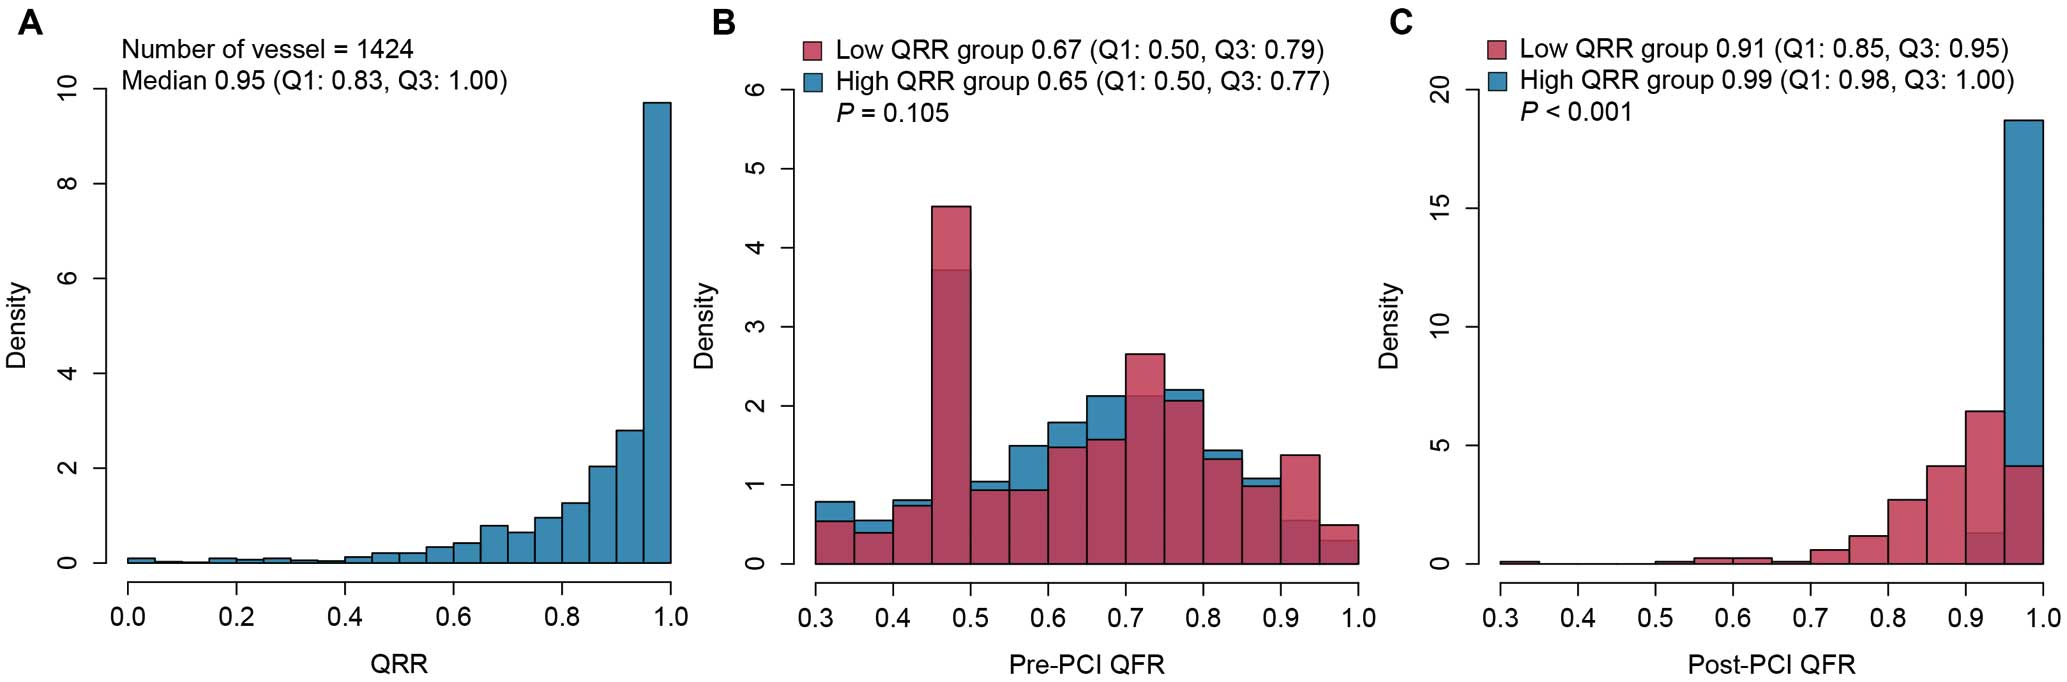
The left anterior descending artery (LAD) was most frequently analyzed (48.9%). Compared with the high QRR group, the low QRR group tended to have a higher prevalence of serial lesions (38.8% vs. 17.3%; P<0.001) and severely tortuous lesions (7.6% vs. 2.9%; P<0.001). Other variables reflecting lesion complexity were comparable between the 2 groups. In vessels with a high QRR, lesion length was greater (19.14±11.34 vs. 22.87±13.71 mm; P<0.001), more stents were used (1.46±0.70 vs. 1.31±0.52; P<0.001) and stent length was greater (36.28±20.90 vs. 30.86±16.98 mm; P<0.001) than in vessels with a low QRR. Finally, post-PCI QFR was higher in vessels with a high QRR than in those with a low QRR (0.99±0.02 vs. 0.87±0.10; P<0.001; Table 2).
Table 2.
Angiographic and Procedural Characteristics of All Study Vessels and After Stratification by the QRR Cutoff Value
| |
Total
(NV=1,424) |
QRR ≥0.86
(NV=1,017) |
QRR <0.86
(NV=407) |
P value |
| Angiographic characteristics |
| Target lesion |
|
|
|
0.003 |
| LAD |
696 (48.9) |
481 (47.3) |
215 (52.8) |
|
| LCx |
308 (21.6) |
244 (24.0) |
64 (15.7) |
|
| RCA |
420 (29.5) |
292 (28.7) |
128 (31.4) |
|
| Bifurcation lesion |
563 (39.5) |
396 (38.9) |
167 (41.0) |
0.50 |
| Severe tortuosity |
61 (4.3) |
30 (2.9) |
31 (7.6) |
<0.001 |
| Severe calcification |
64 (4.5) |
46 (4.5) |
18 (4.4) |
1.00 |
| Diffuse lesion |
658 (46.2) |
478 (47.0) |
180 (44.2) |
0.37 |
| Serial lesion |
334 (23.5) |
176 (17.3) |
158 (38.8) |
<0.001 |
| Preprocedural physiological and QCA assessment |
| Pre-PCI QFR |
0.65±0.16 |
0.64±0.16 |
0.66±0.17 |
0.058 |
| Lesion lengthA (mm) |
21.80±13.18 |
22.87±13.71 |
19.14±11.34 |
<0.001 |
| Reference lumen diameterA (mm) |
2.76±0.47 |
2.77±0.47 |
2.73±0.46 |
0.23 |
| Diameter stenosisA (%) |
72.91±16.00 |
72.96±15.85 |
72.79±16.42 |
0.85 |
| Minimum lumen diameterA (mm) |
0.71±0.46 |
0.70±0.46 |
0.71±0.48 |
0.78 |
| Procedural assessment |
| Pre-dilatation |
1,319 (92.6) |
938 (92.2) |
381 (93.6) |
0.43 |
| Stent number |
1.41±0.66 |
1.46±0.70 |
1.31±0.52 |
<0.001 |
| Stent length (mm) |
34.73±20.00 |
36.28±20.90 |
30.86±16.98 |
<0.001 |
| Post-dilatation |
817 (57.4) |
589 (57.9) |
228 (56.0) |
0.55 |
| Post-procedural physiological and QCA assessment |
| Post-PCI QFR |
0.96±0.07 |
0.99±0.02 |
0.89±0.10 |
<0.001 |
| Reference lumen diameterA (mm) |
2.77±0.45 |
2.77±0.46 |
2.76±0.44 |
0.51 |
| Diameter stenosisA (%) |
8.04±5.67 |
8.15±5.63 |
7.77±5.76 |
0.25 |
| Minimum lumen diameterA (mm) |
2.54±0.43 |
2.54±0.43 |
2.53±0.43 |
0.76 |
Unless indicated otherwise, values are presented as the mean±SD or n (%). AData derived from QCA measurement. LAD, left anterior descending; LCx, left circumflex; NV, number of vessels; QCA, quantitative coronary angiography; QFR, quantitative flow ratio; RCA, right coronary artery. Other abbreviations as in Table 1.
QRR Measurement and Clinical Outcomes
The median QRR was 0.95 (IQR 0.83–1.00), and the distribution is shown in Figure 1. In all, 41 (2.9%) VOCEs occurred at 2 years. The diagnostic performance of QRR for predicting 2-year VOCE was moderate (AUC 0.713; 95% CI 0.689–0.737; P<0.001), with the optimal cut-off value being 0.86 (sensitivity 0.610, specificity 0.770; Supplementary Figure 2). Stratified by this optimal cut-off value, 407 (28.6%) vessels had a low (<0.86) QRR, whereas 1,017 (71.4%) vessels had a high (≥0.86) QRR.
Kaplan-Meier estimates showed that vessels with a low QRR (<0.86) had a significantly higher rate of 2-year VOCEs than those with a high QRR (6.6% vs 1.4%; P<0.001; Figure 2; Table 3). After adjustment for confounding factors, low QRR remained associated with an over 5-fold increased risk for VOCEs (adjusted [a] HR 5.05; 95% CI 2.53–10.08; P<0.001). In addition, vessels with a low QRR were at a significantly higher risk of composite cardiac death and TVMI (aHR 3.01; 95% CI 1.17–7.73), TVMI (aHR 4.84; 95% CI 1.05–22.31), and ID-TVR (aHR 8.37; 95% CI, 3.14–22.30; Table 3). Results of univariable analysis between QRR and VOCE are presented listed in Supplementary Table 2. Similar results between QRR and adverse events were observed in the patient-level analysis (Supplementary Table 3).
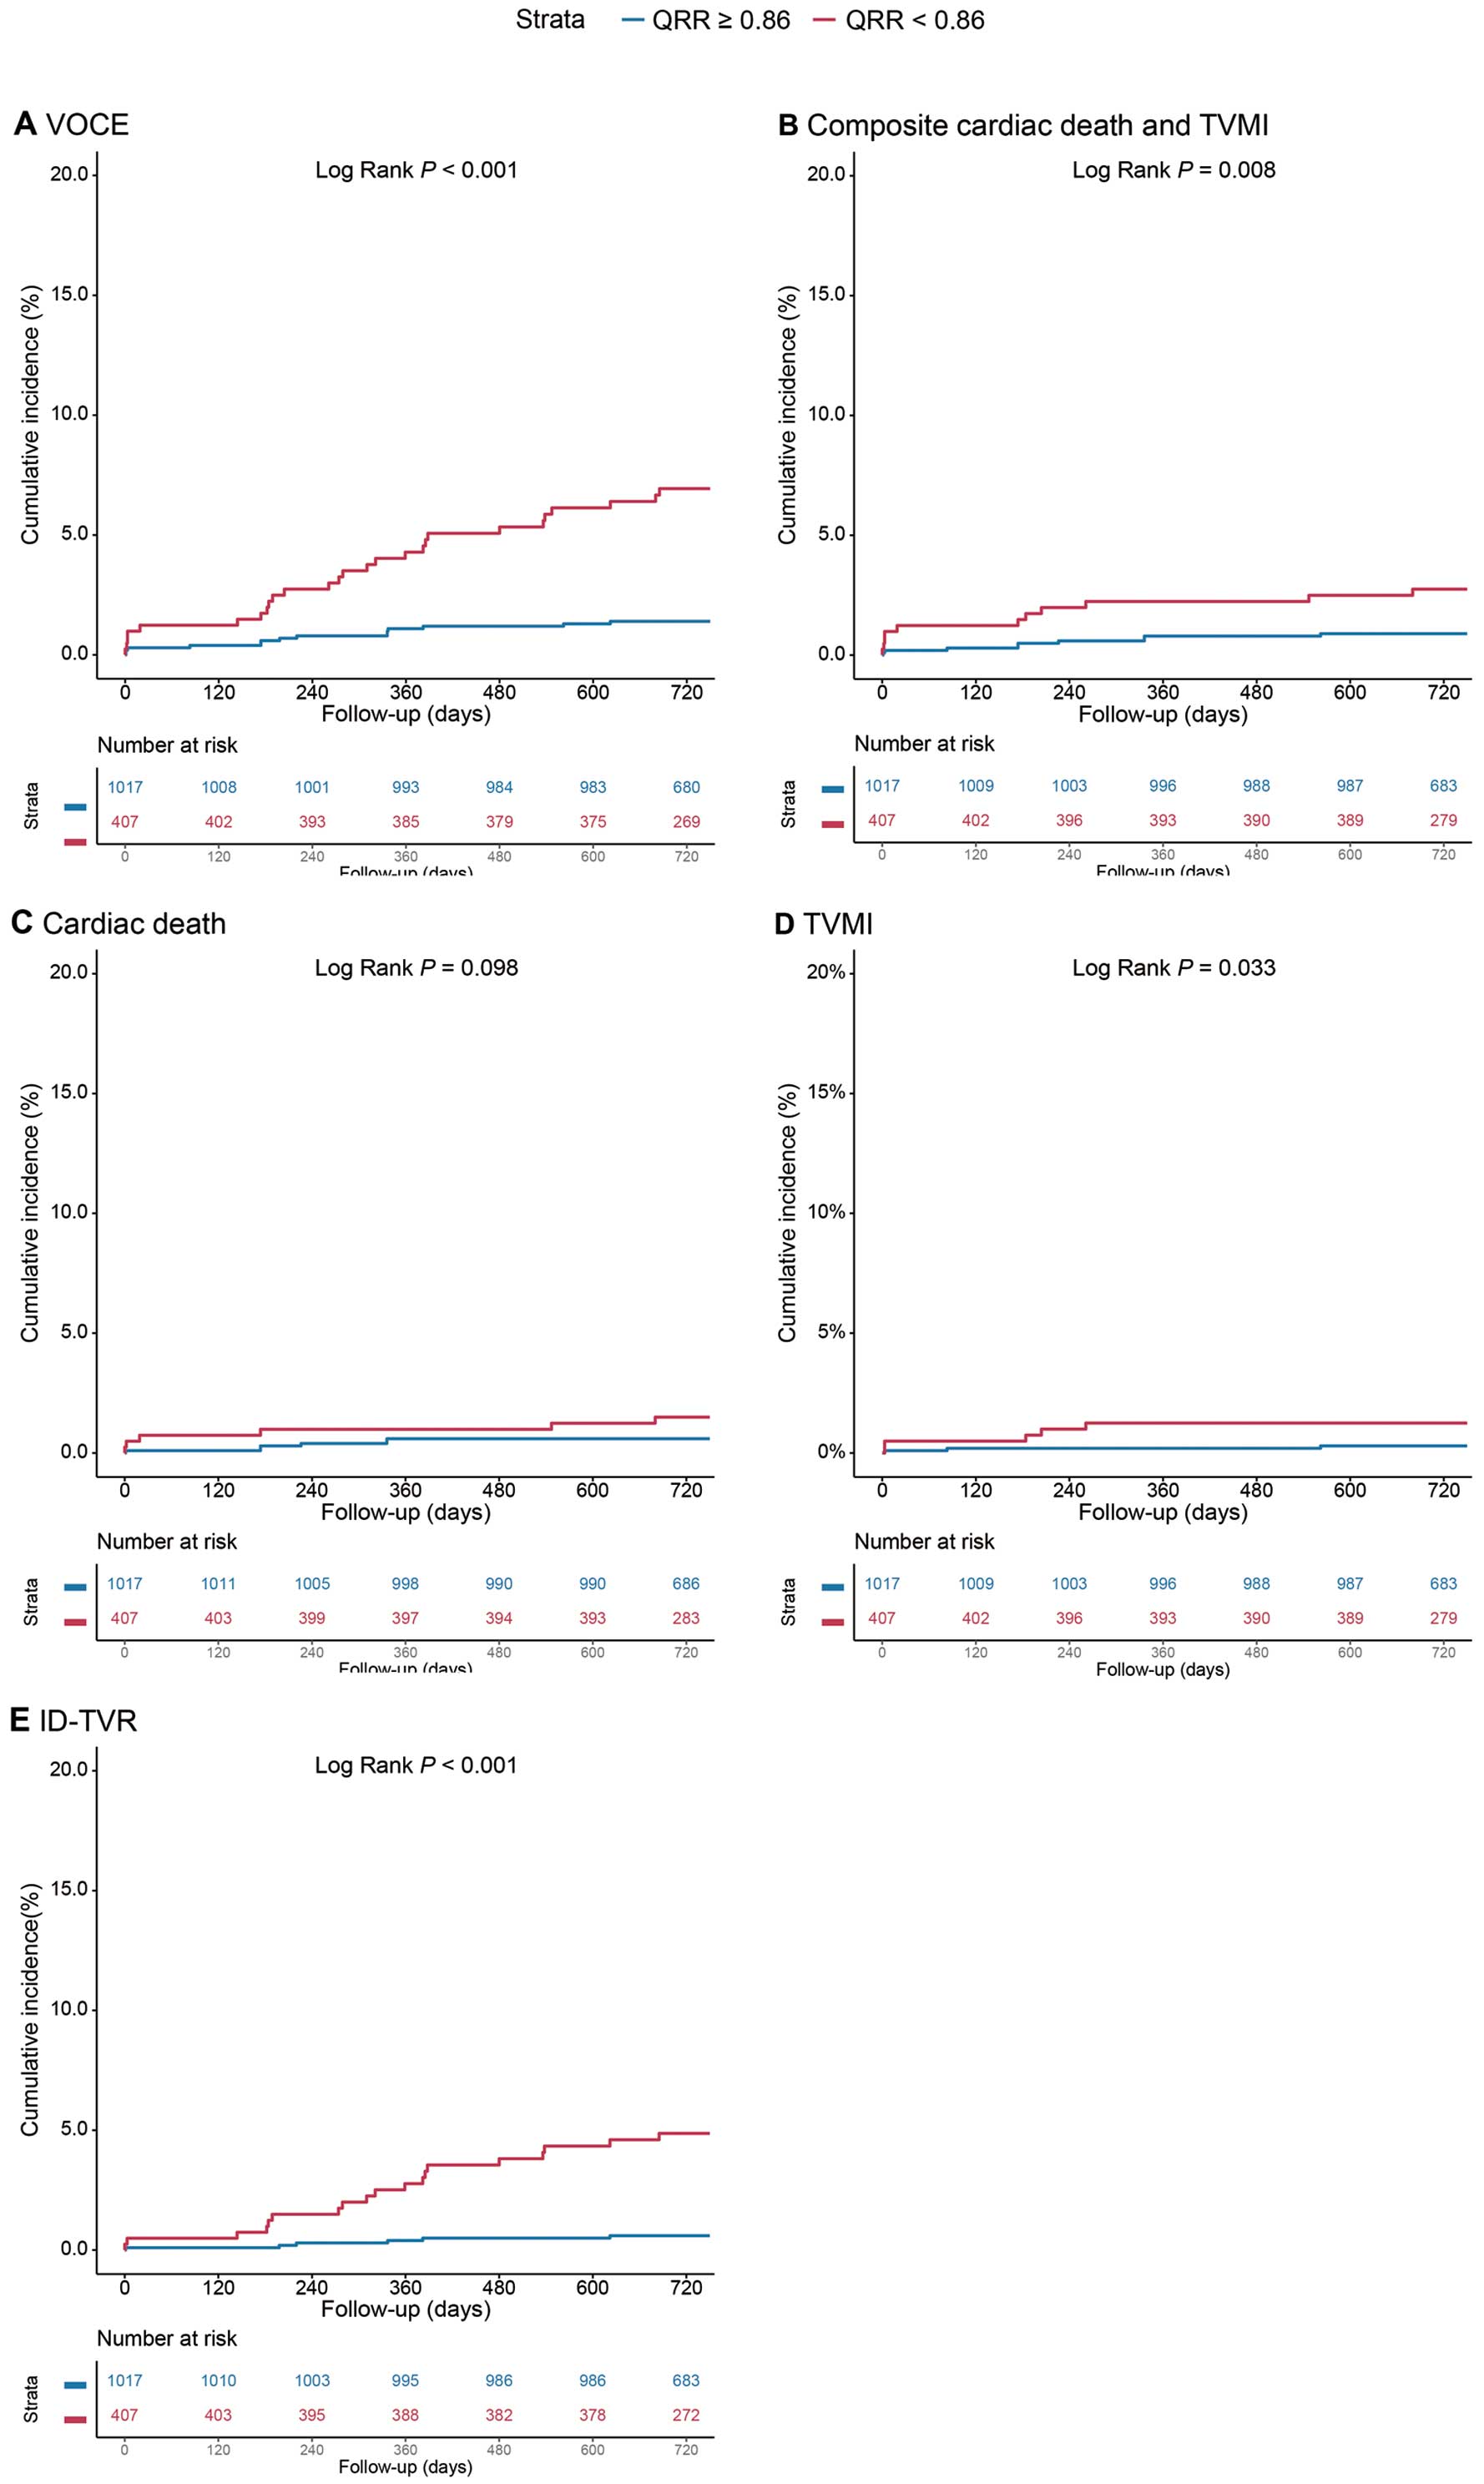
Table 3.
Associations Between QRR and Clinical Outcomes at 2 Years
| |
QRR <0.86
(n=407) |
QRR ≥0.86
(n=1,017) |
Crude HR
(95% CI) |
P value |
Adjusted HR
(95% CI)A |
P value |
| VOCEB |
27 (6.6) |
14 (1.4) |
4.93 (2.59–9.40) |
<0.001 |
5.05 (2.53–10.08) |
<0.001 |
| Composite cardiac death and TVMI |
11 (2.7) |
9 (0.9) |
3.08 (1.28–7.43) |
0.012 |
3.01 (1.17–7.73) |
0.022 |
| Cardiac death |
6 (1.5) |
6 (0.6) |
2.51 (0.81–7.79) |
0.11 |
2.20 (0.64–7.53) |
0.21 |
| TVMI |
5 (1.2) |
3 (0.3) |
4.20 (1.003–7.56) |
0.0495 |
4.84 (1.05–22.31) |
0.043 |
| ID-TVR |
19 (4.7) |
6 (0.6) |
8.09 (3.23–20.26) |
<0.001 |
8.37 (3.14–22.30) |
<0.001 |
Values are n (%) unless specified otherwise. AThe covariates included in the multivariable-adjusted model were age, male sex, body mass index, hypertension, diabetes, smoking history, previous myocardial infarction, previous percutaneous coronary intervention, left ventricular ejection fraction, creatinine clearance, SYNTAX score, serial lesion, diffuse lesion, severe tortuous lesions, and total stent length. BVOCE included cardiac death, TVMI, and ID-TVR. CI, confidence interval; HR, hazard ratio; ID-TVR, ischemia-driven target vessel revascularization; TVMI, target vessel myocardial infarction; VOCE, vessel-oriented cardiac events.
Clinical Outcomes Classified by QRR and Post-PCI QFR Levels
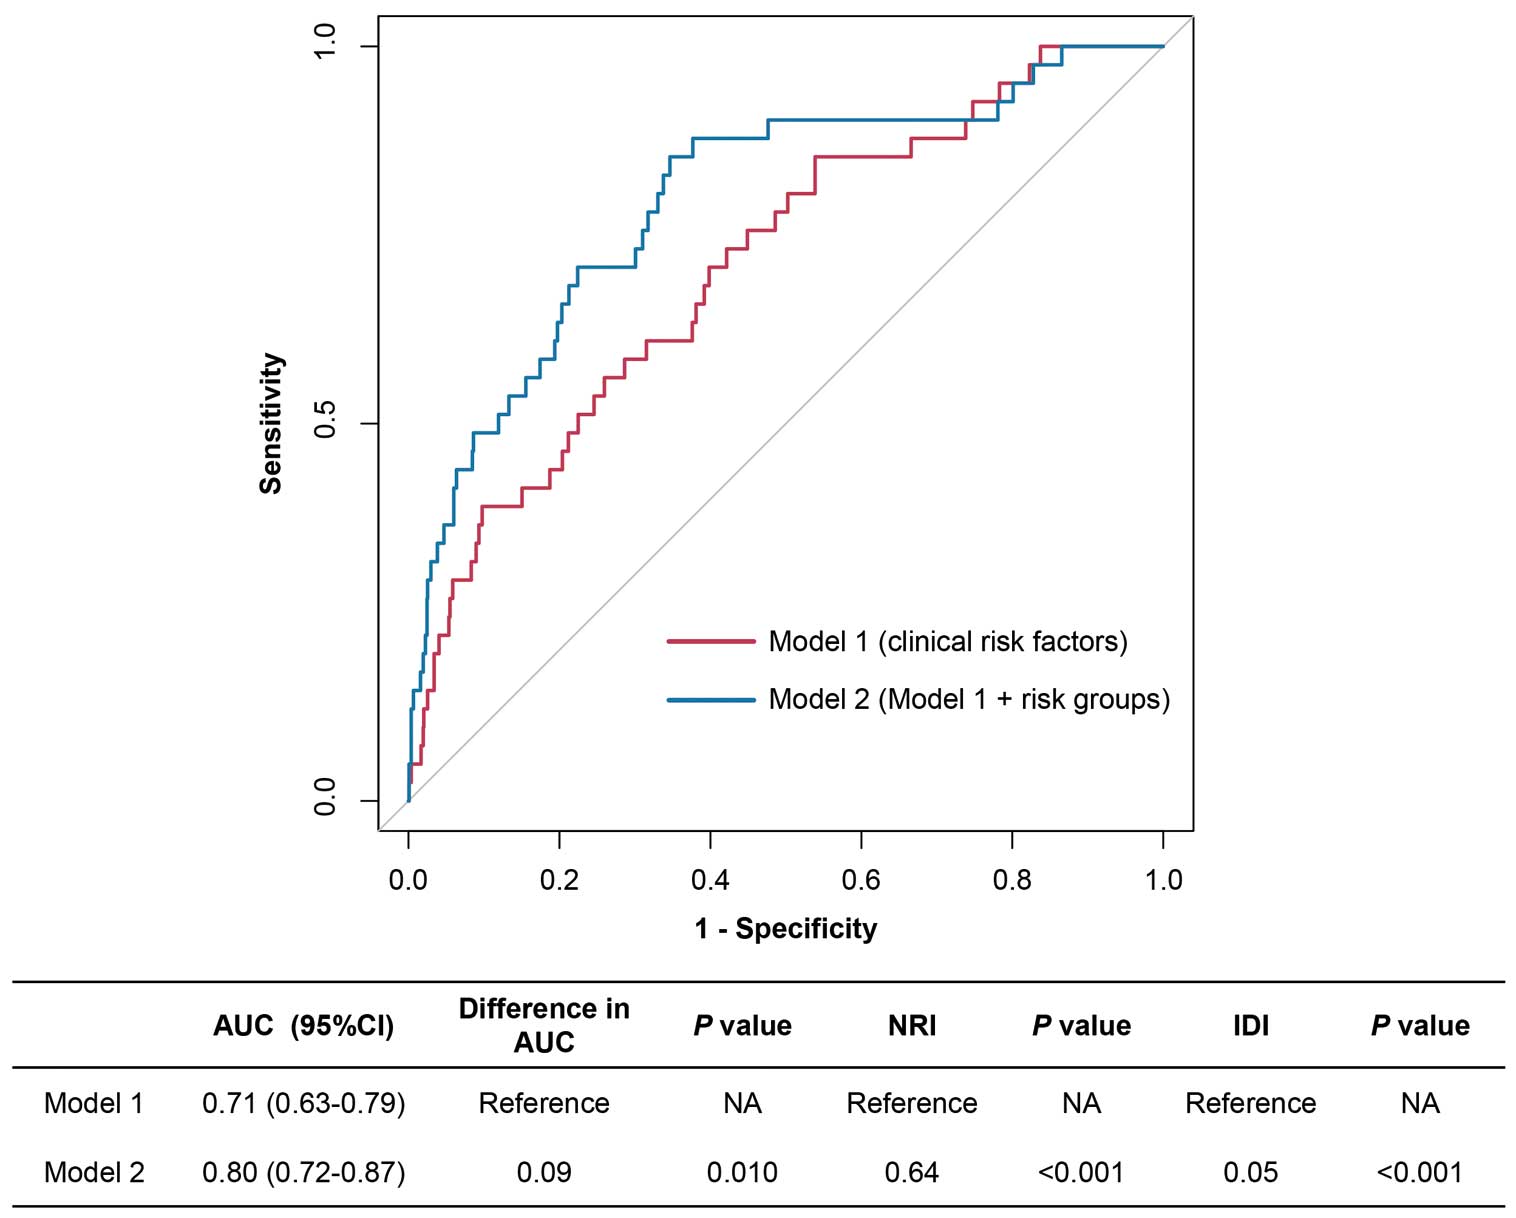
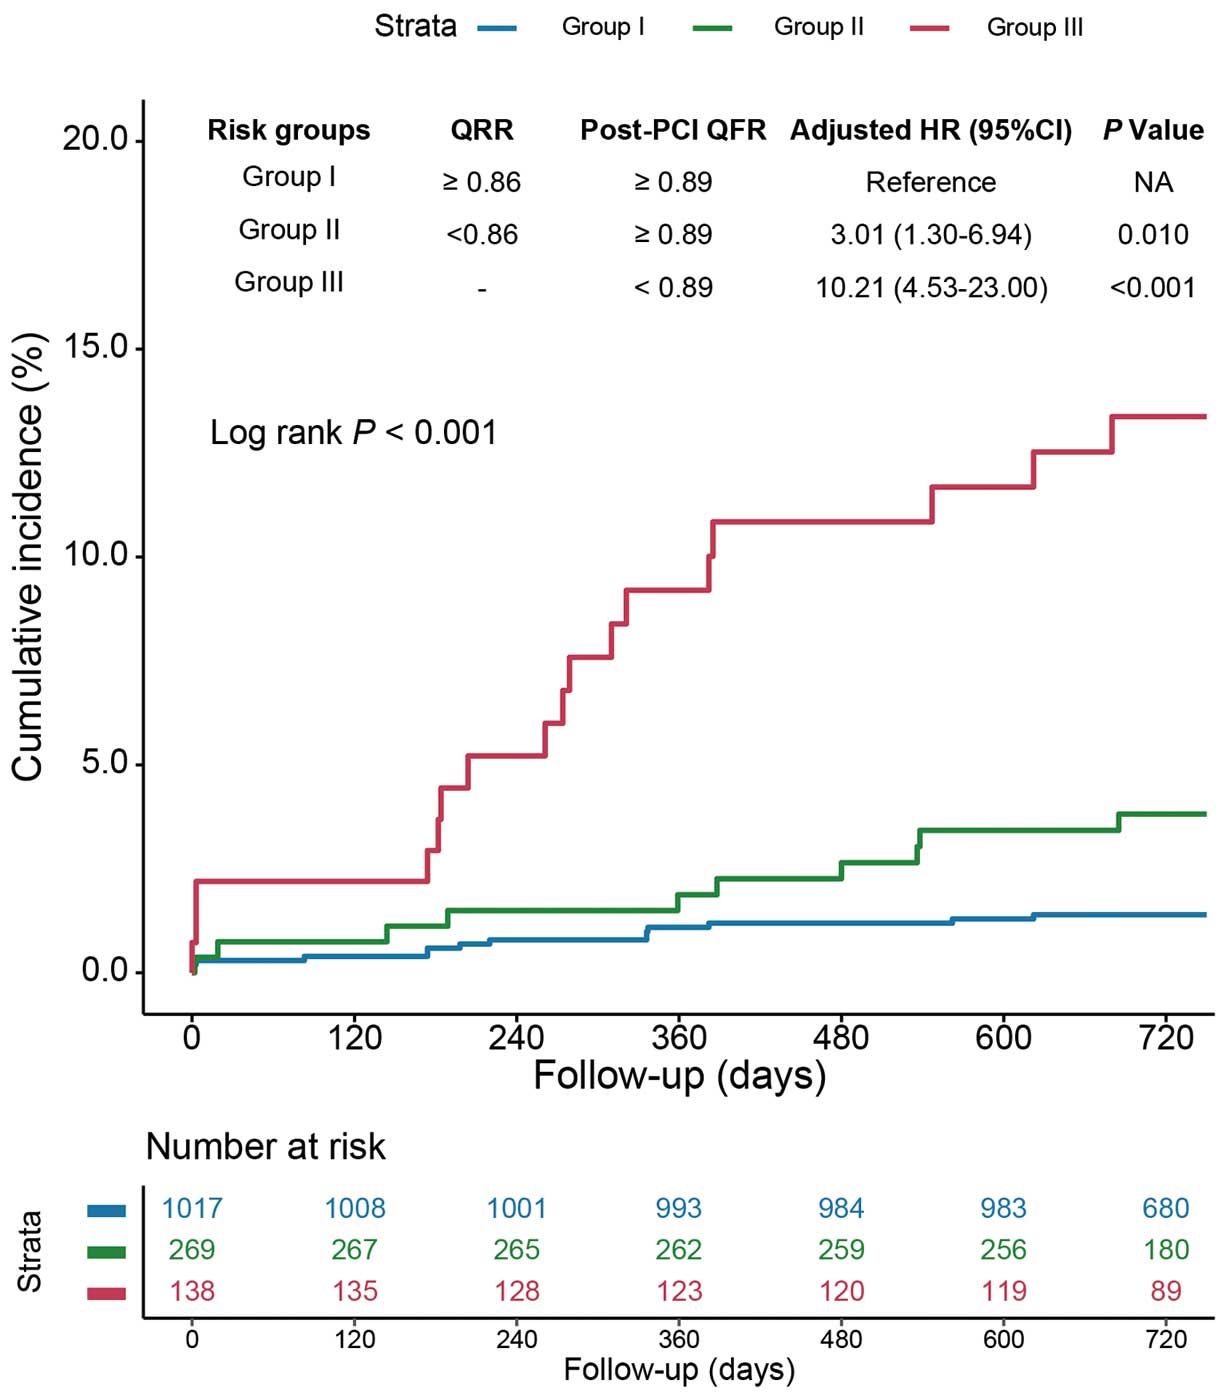
Vessels were further stratified into 3 risk groups according to QRR and post-PCI QFR as follows: Group I, high (≥0.86) QRR and high (≥0.89) post-PCI QFR; Group II, low (<0.86) QRR and high (≥0.89) post-PCI QFR; and Group III, low (<0.89) post-PCI QFR regardless of QRR. Compared with vessels in Group I, vessels in Groups II and III had significantly increased risks of 2-year VOCE after adjustment for confounding factors (aHR 3.01 [95% CI 1.30–6.94] and aHR 10.21 [95% CI 4.53–23.00], respectively; Figure 3; Supplementary Table 4). In addition, compared with vessels with a high QRR and high post-PCI QFR (Group I), those with a low post-PCI QFR regardless of QRR (Group III) had an increased risk of composite cardiac death and TVMI (aHR 8.01; 95% CI 2.64–24.27), vessel-related non-procedural MI (aHR 24.57; 95% CI 4.30–140.46), and ID-TVR (aHR 17.56; 95% CI 5.64–54.69). Moreover, in the patient-level analysis, compared with patients in Group I, those in Groups II and III had an increased 2-year TVF risk after adjusting for confounding factors (aHR 5.31 [95% CI 1.94–14.54] and aHR 15.75 [95% CI 5.85–42.42], respectively; Supplementary Table 5). Furthermore, when the stratifications combining QRR and post-PCI QFR were added to clinical risk factors for predicting 2-year VOCE, the model with this new risk stratification showed higher discrimination and reclassification ability (difference in AUC 0.09 [P=0.010]; IDI 0.05 [P<0.001]; category-free NRI 0.64 [P<0.001]; Figure 4).
Subgroup Analysis
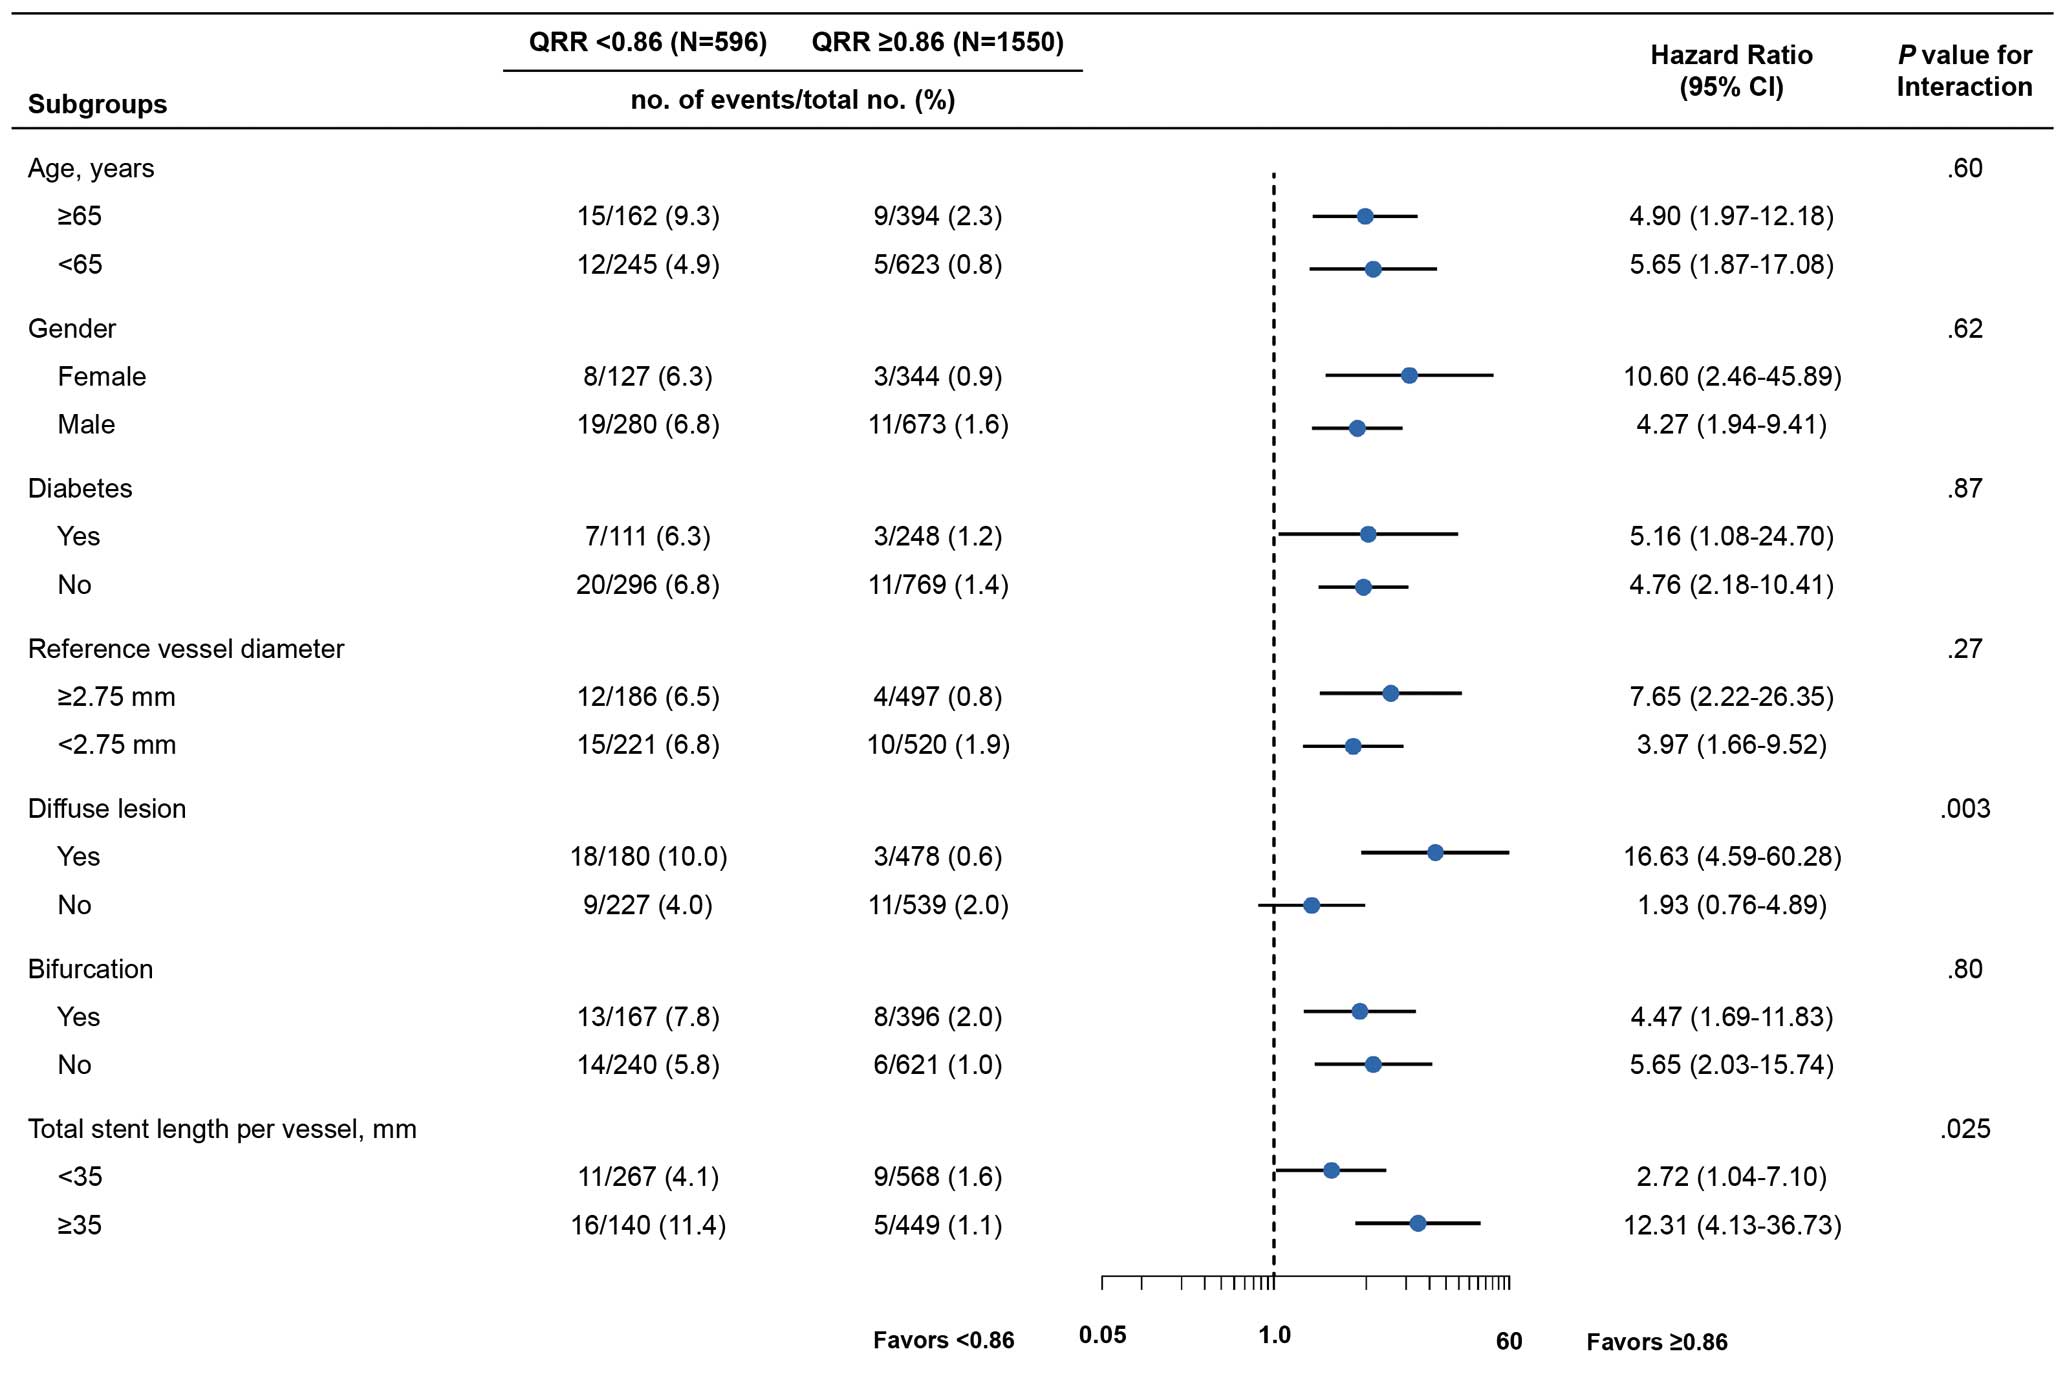
In subgroup analysis, the association of QRR with the risk of VOCEs at 2 years was mostly consistent across different subgroups (age, sex, diabetes, RVD, and bifurcation lesions); however, a significant interaction was observed between QRR and the presence of diffuse lesions (P for interaction=0.003) and total stent length ≥35 mm (P for interaction=0.025; Figure 5).
Discussion
In this post hoc study of the PANDA III trial, we investigated the prognostic value of QRR in patients undergoing PCI for CAD. The major findings can be summarized as follows: (1) low QRR conferred a high risk of 2-year VOCE; (2) QRR <0.86 was an independent predictor for 2-year VOCE in the multivariable model; and (3) QRR could provide complementary prognostic value in vessels with a satisfactory post-PCI QFR.
QFR Assessment After PCI
QFR could be routinely used in guiding lesion selection for PCI, which has been identified by the FAVOR III China trial,11 but rarely in assessing procedural results in daily practice. Recent studies have indicated that suboptimal physiological results based on QFR measured immediately after PCI are significantly associated with poor prognosis, with optimal cut-off values of 0.89 or 0.91 reported.12,13 However, our data showed that even in patients with satisfactory post-PCI QFR, lower relative physiological improvement (QRR) could still predict worse clinical outcomes, which indicates that patients with identical post-PCI QFR can have distinct outcomes and need to be further discriminated. Notably, previous invasive physiological data showed that a high relative increase in functional assessment after PCI assessed by FFR was observed in approximately 48.3% of patients with low post-PCI FFR.21 However, in the present study all vessels with high QRR were in the high post-PCI QFR group. This discrepancy could be attributed to the different formulas used to calculate relative improvement in coronary physiology and the different approaches of functional assessment (FFR vs. QFR). Although current evidence shows excellent diagnostic performance of QFR and good agreement with pressure-wire-derived FFR,8 QFR measurement could be limited by no clear visualization of the stent, a specific requirement for the acquisition of angiographic images, and difficulties in computation for anatomically complex lesions.13,25 Further studies are needed to confirm our findings. Moreover, the clinical significance of absolute improvement between pre- and post-PCI coronary physiological status has been demonstrated for FFR. In a post hoc analysis of the FAME 1 and FAME 2 trials, the incidence of 2-year VOCE was significantly higher in the lowest ∆FFR tertile group compared with the highest tertile group.26 However, in the present study, the absolute improvement in QFR (∆QFR) showed limited prognostic value, whereas an index reflecting relative improvement in coronary physiology (QRR) could be used as a better predictor. The present is the first to evaluate the clinical significance of the relative improvement in QFR. The rationale behind measuring QRR was to evaluate the extent of ischemic relief, which cannot be fully assessed by single value of either pre- or post-PCI QFR.
Potential Cause of Low QRR After PCI
The formula used to calculate QRR involved 2 parameters, namely pre- and post-PCI QFR. A low QRR value presumably reflected a limited extent of alleviation of ischemia and a persistent pressure gradient. There are several potential explanations for a low QRR in the target vessel. First, low QRR could be caused by suboptimal stent results, including stent underexpansion and malapposition, geographical longitudinal miss, plaque or tissue prolapse, edge dissection, and plaque shift at the stent edge.27 Under these suboptimal stent conditions, eddies could develop due to the switch from laminar to turbulent flow, which possibly causes a significant increase in flow resistance and further leads to a pressure drop distal to the treated segment. By means of intravascular ultrasound and pressure measurement, Hanekamp et al28 previously demonstrated that in-stent pressure gradients were closely related to suboptimal stenting results, including stent underexpansion and/or malapposition, and stent asymmetry. In addition, stent underexpension was observed in a substantial proportion of patients with low FFR after PCI in another study using slotted-tube stents,29 as well as in other studies using drug-eluting stents30,31 despite reasonable angiographic outcomes, which consistently reveal that low FFR measured after stent implantation predicts an unsatisfactory result identified by validated intravascular ultrasound criteria. Second, lesion complexity may be linked to a low QRR. In the present study, serial lesions were more frequently observed in vessels with a QRR <0.86. Similarly, Kogame et al13 previously explored the predictive ability of angiographic silhouettes on post-PCI QFR and found that serial lesions were a significant factor for low QFR after PCI. In the scenario of serial lesions, additional stenoses to the treated segment may be present, the hemodynamic importance of which has been overlooked or escaped identification by physiological assessment. Third, variations in physiological indices and eventually outcomes seem to be associated with differences in the coronary arteries undergoing intervention. In the present study, a significantly higher proportion of vessels with QRR <0.86 were the LAD. Similarly, previous studies identified that a suboptimal post-PCI FFR was more frequent in patients with intervention procedures to the LAD than to the right coronary artery or left circumflex artery.32 LAD lesions are also suggested to predict lower QFR after PCI in patients with de novo 3-vessel CAD.13 These findings presumably indicate the greater myocardial territory subtended by the LAD, which causes a greater peak flow and lower post-PCI physiological indices for any residual stenosis in this vessel. Intriguingly, a suboptimal physiological result was also related to a higher rate of clinical events in these studies.13,32
Notably, associations between QRR and 2-year VOCE were consistent across different subgroups (age, sex, diabetes, RVD, and bifurcation lesions), whereas a significant interaction was observed between QRR and the presence of diffuse lesions or total stent length ≥35 mm, suggesting that assessment of the relative improvement in QFR (QRR) may be of greater prognostic value among patients with diffuse lesions and longer total stent length. However, the findings of the present study are hypothesis generating, and prospective large studies are warranted to verify our findings.
Study Limitations
Some limitations of this study need to be addressed. First, the study was a post hoc analysis of the PANDA III trial, with no prespecified devices and angiographic criteria, resulting in 28.2% of angiographic images unable to be analyzable by the QFR software, similar to previous studies,33 which possibly introduced selection bias. Second, this study was not able to assess the impact of subsequent interventions in response to an unsatisfactory QRR value on clinical outcomes. Functional optimization using QRR values should be scrutinized in future studies. Third, correlations between QRR and FFR-related parameters could not determined because procedural FFR measurements were not mandatory in the study protocol. Third, information regarding culprit and non-culprit lesions in acute MI patients was not available. Further well-designed studies are needed to confirm our findings. Finally, intracoronary imaging (e.g., intravascular ultrasound or optical coherence tomography) was infrequently used in the PANDA III trial, which possibly affected the occurrence of clinical events. With an increasing number of PCIs performed under intracoronary imaging guidance in recent years, prediction of the rate of clinical events after PCI with QRR may generate different results.
Conclusions
Relative improvement of coronary physiology assessed by QRR showed applicability in prognostication. Categorical classification of coronary physiology could provide information for the risk stratification of CAD patients.
Sources of Funding
The PANDA III trial was sponsored by Sino Medical, Tianjin, China. As a post hoc analysis, this work was supported by the Beijing Municipal Science and Technology Project (Grant no. Z191100006619107), Beijing Municipal Science and Technology Project (Grant no. Z211100002921009), CAMS Innovation Fund for Medical Sciences (CIFMS; Grant no. 2021-I2M-1-008), and The National High Level Hospital Clinical Research Funding (grant number: 2023-GSP-QN-34, 2023-GSP-RC-05).
Disclosures
All authors declare no conflicts of interest.
IRB Information
The PANDA III trial and the present study were approved by the Institutional Review Board at Fuwai Hospital (Reference no. 2013-462).
Supplementary Files
Please find supplementary file(s);
https://doi.org/10.1253/circj.CJ-22-0743
References
- 1.
Tonino PAL, De Bruyne B, Pijls NHJ, Siebert U, Ikeno F, van’t Veer M, et al. Fractional flow reserve versus angiography for guiding percutaneous coronary intervention. N Engl J Med 2009; 360: 213–224, doi:10.1056/NEJMoa0807611.
- 2.
Xaplanteris P, Fournier S, Pijls NHJ, Fearon WF, Barbato E, Tonino PAL, et al. Five-year outcomes with PCI guided by fractional flow reserve. N Engl J Med 2018; 379: 250–259, doi:10.1056/NEJMoa1803538.
- 3.
Neumann FJ, Sousa-Uva M, Ahlsson A, Alfonso F, Banning AP, Benedetto U, et al. 2018 ESC/EACTS guidelines on myocardial revascularization. Eur Heart J 2019; 40: 87–165, doi:10.1093/eurheartj/ehy394.
- 4.
Nakano S, Kohsaka S, Chikamori T, Fukushima K, Kobayashi Y, Kozuma K, et al. JCS 2022 guideline focused update on diagnosis and treatment in patients with stable coronary artery disease. Circ J 2022; 86: 882–915, doi:10.1253/circj.CJ-21-1041.
- 5.
Kimura K, Kimura T, Ishihara M, Nakagawa Y, Nakao K, Miyauchi K, et al. JCS 2018 guideline on diagnosis and treatment of acute coronary syndrome. Circ J 2019; 83: 1085–1196, doi:10.1253/circj.CJ-19-0133.
- 6.
Nakamura M, Yaku H, Ako J, Arai H, Asai T, Chikamori T, et al. JCS/JSCVS 2018 guideline on revascularization of stable coronary artery disease. Circ J 2022; 86: 477–588, doi:10.1253/circj.CJ-20-1282.
- 7.
Tu S, Westra J, Yang J, von Birgelen C, Ferrara A, Pellicano M, et al. Diagnostic accuracy of fast computational approaches to derive fractional flow reserve from diagnostic coronary angiography: The international multicenter FAVOR pilot study. JACC Cardiovasc Interv 2016; 9: 2024–2035, doi:10.1016/j.jcin.2016.07.013.
- 8.
Westra J, Andersen BK, Campo G, Matsuo H, Koltowski L, Eftekhari A, et al. Diagnostic performance of in-procedure angiography-derived quantitative flow reserve compared to pressure-derived fractional flow reserve: The FAVOR II Europe–Japan study. J Am Heart Assoc 2018; 7: e009603, doi:10.1161/JAHA.118.009603.
- 9.
Xu B, Tu S, Qiao S, Qu X, Chen Y, Yang J, et al. Diagnostic accuracy of angiography-based quantitative flow ratio measurements for online assessment of coronary stenosis. J Am Coll Cardiol 2017; 70: 3077–3087, doi:10.1016/j.jacc.2017.10.035.
- 10.
Westra J, Tu S, Campo G, Qiao S, Matsuo H, Qu X, et al. Diagnostic performance of quantitative flow ratio in prospectively enrolled patients: An individual patient-data meta-analysis. Catheter Cardiovasc Interv 2019; 94: 693–701, doi:10.1002/ccd.28283.
- 11.
Xu B, Tu S, Song L, Jin Z, Yu B, Fu G, et al. Angiographic quantitative flow ratio-guided coronary intervention (FAVOR III China): A multicentre, randomised, sham-controlled trial. Lancet 2021; 398: 2149–2159, doi:10.1016/S0140-6736(21)02248-0.
- 12.
Biscaglia S, Tebaldi M, Brugaletta S, Cerrato E, Erriquez A, Passarini G, et al. Prognostic value of QFR measured immediately after successful stent implantation: The international multicenter prospective HAWKEYE study. JACC Cardiovasc Interv 2019; 12: 2079–2088, doi:10.1016/j.jcin.2019.06.003.
- 13.
Kogame N, Takahashi K, Tomaniak M, Chichareon P, Modolo R, Chang CC, et al. Clinical implication of quantitative flow ratio after percutaneous coronary intervention for 3-vessel disease. JACC Cardiovasc Interv 2019; 12: 2064–2075, doi:10.1016/j.jcin.2019.08.009.
- 14.
Wang HY, Zhang R, Dou K, Huang Y, Xie L, Qiao Z, et al. Left main bifurcation stenting: Impact of residual ischaemia on cardiovascular mortality. Eur Heart J 2023; 44: 4324–4336, doi:10.1093/eurheartj/ehad318.
- 15.
Xu B, Gao R, Yang Y, Cao X, Qin L, Li Y, et al. Biodegradable polymer-based sirolimus-eluting stents with differing elution and absorption kinetics: The PANDA III trial. J Am Coll Cardiol 2016; 67: 2249–2258, doi:10.1016/j.jacc.2016.03.475.
- 16.
Zhang R, Song C, Guan C, Liu Q, Wang C, Xie L, et al. Prognostic value of quantitative flow ratio based functional SYNTAX score in patients with left main or multivessel coronary artery disease. Circ Cardiovasc Interv 2020; 13: e009155, doi:10.1161/CIRCINTERVENTIONS.120.009155.
- 17.
Wang HY, Xu B, Dou K, Guan C, Song L, Huang Y, et al. Implications of periprocedural myocardial biomarker elevations and commonly used MI definitions after left main PCI. JACC Cardiovasc Interv 2021; 14: 1623–1634, doi:10.1016/j.jcin.2021.05.006.
- 18.
Piroth Z, Toth GG, Tonino PAL, Barbato E, Aghlmandi S, Curzen N, et al. Prognostic value of fractional flow reserve measured immediately after drug-eluting stent implantation. Circ Cardiovasc Interv 2017; 10: e005233, doi:10.1161/CIRCINTERVENTIONS.116.005233.
- 19.
Agarwal SK, Kasula S, Hacioglu Y, Ahmed Z, Uretsky BF, Hakeem A. Utilizing post-intervention fractional flow reserve to optimize acute results and the relationship to long-term outcomes. JACC Cardiovasc Interv 2016; 9: 1022–1031, doi:10.1016/j.jcin.2016.01.046.
- 20.
Hwang D, Lee JM, Lee HJ, Kim SH, Nam CW, Hahn JY, et al. Influence of target vessel on prognostic relevance of fractional flow reserve after coronary stenting. EuroIntervention 2019; 15: 457–464, doi:10.4244/EIJ-D-18-00913.
- 21.
Lee JM, Hwang D, Choi KH, Rhee TM, Park J, Kim HY, et al. Prognostic implications of relative increase and final fractional flow reserve in patients with stent implantation. JACC Cardiovasc Interv 2018; 11: 2099–2109, doi:10.1016/j.jcin.2018.07.031.
- 22.
He J, Bian X, Song C, Zhang R, Yuan S, Yin D, et al. High neutrophil to lymphocyte ratio with type 2 diabetes mellitus predicts poor prognosis in patients undergoing percutaneous coronary intervention: A large-scale cohort study. Cardiovasc Diabetol 2022; 21: 156, doi:10.1186/s12933-022-01583-9.
- 23.
He J, Song C, Wang H, Zhang R, Yuan S, Dou K. Diabetes mellitus with mild or moderate kidney dysfunction is associated with poor prognosis in patients with coronary artery disease: A large-scale cohort study. Diabetes Res Clin Pract 2023; 200: 110693, doi:10.1016/j.diabres.2023.110693.
- 24.
He J, Yang M, Song C, Zhang R, Yuan S, Li J, et al. Lipoprotein(a) is associated with recurrent cardiovascular events in patients with coronary artery disease and prediabetes or diabetes. J Endocrinol Invest 2023, doi:10.1007/s40618-023-02203-3.
- 25.
Ding D, Huang J, Westra J, Cohen DJ, Chen Y, Andersen BK, et al. Immediate post-procedural functional assessment of percutaneous coronary intervention: Current evidence and future directions. Eur Heart J 2021; 42: 2695–2707, doi:10.1093/eurheartj/ehab186.
- 26.
Fournier S, Ciccarelli G, Toth GG, Milkas A, Xaplanteris P, Tonino PAL, et al. Association of improvement in fractional flow reserve with outcomes, including symptomatic relief, after percutaneous coronary intervention. JAMA Cardiol 2019; 4: 370–374, doi:10.1001/jamacardio.2019.0175.
- 27.
Wolfrum M, Fahrni G, de Maria GL, Knapp G, Curzen N, Kharbanda RK, et al. Impact of impaired fractional flow reserve after coronary interventions on outcomes: A systematic review and meta-analysis. BMC Cardiovasc Disord 2016; 16: 177, doi:10.1186/s12872-016-0355-7.
- 28.
Hanekamp CE, Koolen JJ, Pijls NH, Michels HR, Bonnier HJ. Comparison of quantitative coronary angiography, intravascular ultrasound, and coronary pressure measurement to assess optimum stent deployment. Circulation 1999; 99: 1015–1021.
- 29.
Fearon WF, Luna J, Samady H, Powers ER, Feldman T, Dib N, et al. Fractional flow reserve compared with intravascular ultrasound guidance for optimizing stent deployment. Circulation 2001; 104: 1917–1922.
- 30.
Stempfle HU, König A, Drescher E, Siebert U, Klauss V. Discrepancy between morphologic and functional criteria of optimal stent deployment using intravascular ultrasound and pressure derived myocardial fractional flow reserve. Int J Cardiovasc Intervent 2005; 7: 101–107.
- 31.
Doh JH, Nam CW, Koo BK, Lee SY, Choi H, Namgung J, et al. Clinical relevance of poststent fractional flow reserve after drug-eluting stent implantation. J Invasive Cardiol 2015; 27: 346–351.
- 32.
Ojha CP, Ibrahim A, Paul TK, Mulukutla V, Nagarajarao HS. The clinical significance of physiological assessment of residual ischemia after percutaneous coronary intervention. Curr Cardiol Rep 2020; 22: 17, doi:10.1007/s11886-020-1269-7.
- 33.
Zhang R, Wu S, Yuan S, Guan C, Zou T, Qiao Z, et al. Effects of diabetes mellitus on post-intervention coronary physiological assessment derived by quantitative flow ratio in patients with coronary artery disease underwent percutaneous coronary intervention. Diabetes Res Clin Pract 2022; 186: 109839, doi:10.1016/j.diabres.2022.109839.