Abstract
Background: The link between malnutrition and poor prognosis in cardiovascular disease has been established but the association between malnutrition and contrast-associated acute kidney injury (CA-AKI), a common complication of coronary procedures, remains poorly understood. In this study we investigated the predictive value of 3 nutritional indexes for CA-AKI in patients undergoing percutaneous coronary intervention (PCI).
Methods and Results: The study included a total of 6,049 consecutive patients undergoing PCI between May 2012 and September 2020, among whom 352 (5.8%) developed CA-AKI. We used the Controlling Nutritional Status (CONUT) score, the Geriatric Nutritional Risk Index (GNRI), and the Prognostic Nutritional Index (PNI) to assess the association between malnutrition risk and CA-AKI after PCI. Multivariate logistic regression analysis revealed that malnutrition, as identified by GNRI and PNI, was significantly associated with a higher risk of CA-AKI (moderate-severe malnutrition in GNRI: odds ratio [OR]=1.92, [95% confidence interval (CI), 1.27–2.85]; malnutrition in PNI: OR=1.87, [95% CI, 1.39-2.50]), whereas the CONUT score did not demonstrate a significant difference (P>0.05). Furthermore, GNRI (∆AUC=0.115, P<0.001) and PNI (∆AUC=0.101, P<0.001) exhibited superior predictive ability than the CONUT score for CA-AKI and significantly improved reclassification and discrimination in the fully adjusted model.
Conclusions: Malnutrition, especially identified by the GNRI and PNI, was associated with a higher risk of CA-AKI after PCI. GNRI and PNI performed better than the CONUT score in predicting CA-AKI.
Contrast-associated acute kidney injury (CA-AKI), a potentially serious complication following percutaneous coronary intervention (PCI), can lead to increased deaths, dialysis requirement, and prolonged hospitalization.1–3 Because currently there is limited availability of interventions that can effectively prevent CA-AKI after PCI, it is important to note that well-identified risk factors, such as diabetes and chronic kidney disease (CKD), are typically irreversible conditions.4 Consequently, it is crucial to identify modifiable high-risk factors and develop effective strategies to prevent CA-AKI.5
Malnutrition increases the risk of AKI not only in hospitalized patients but also in individuals with sepsis, malignancy, or acute coronary syndrome (ACS).6–9 Additionally, a correlation between malnutrition and poor prognosis in individuals with cardiovascular disease has been reported.10–12 Thus, malnutrition is a significant and modifiable risk factor for a poor prognosis.13 Because the association between malnutrition and CA-AKI after PCI is not well understood, we investigated the predictive value of malnutrition for CA-AKI after PCI using 3 objective nutritional indexes: the Controlling Nutritional Status (CONUT) score, the Geriatric Nutritional Risk Index (GNRI), and the Prognostic Nutritional Index (PNI).
Methods
The study protocol conformed to the principles outlined in the Declaration of Helsinki and was approved by the Ethics Committee of the Fujian Provincial Hospital, China (ethics approval number: K2019-07-011).
Study Population
This retrospective, single-center, observational study included a total of 8,043 consecutive patients who underwent PCI at Fujian Provincial Hospital in China, spanning the period from May 2012 to September 2020. The exclusion criteria were: (1) missing data for height, weight, serum albumin level, lymphocyte count, and total cholesterol level (n=1,745); (2) missing data on pre- or post-procedural serum creatinine (SCr) levels (n=131); (3) endstage renal disease (estimated glomerular filtration rate [eGFR] <15 mL/min/1.73 m2) or undergoing long-term dialysis treatment (n=54); (4) exposure to contrast media within 7 days prior to the procedure (n=27); and (5) death within 24 h of admission (n=37). Consequently, a total of 6,049 patients were included in the final analysis.
Protocol
Data, including baseline demographics, comorbidities, clinical risk factors, clinical treatment, and laboratory results, were extracted from the medical records. Body weight and height, serum albumin, lymphocyte count, and total cholesterol level were measured at admission. SCr levels were measured at admission and daily for the 2 days following PCI. PCI procedures were performed by experienced interventional cardiologists following optimal clinical practices. Low-osmolar, nonionic contrast media (either Iopamiron or Ultravist, both at a concentration of 370 mg/mL) were administered during all procedures. Additionally, all patients received 0.9% normal saline at a rate of 1 mL/kg/h for 12 h during the perioperative period (0.5 mL/kg/h for patients with heart failure (HF) or otherwise intolerant).
Evaluation of Nutritional Indexes
The CONUT score is a screening tool used to assess the nutritional status of patients in the hospital setting.14 It considers the levels of serum albumin and total cholesterol, and the total lymphocyte count, assigning a score ranging from 0 to 12. CONUT scores of 0–1, 2–4 and ≥5 reflect normal, mild and moderate-severe malnutrition, respectively.
The GNRI is calculated as: 1.489 × serum albumin (g/L) + 41.7 × (actual body weight/ideal body weight).15 When the actual body weight exceeds the ideal body weight, the ratio of actual body weight to ideal body weight is considered as 1. In this study, the ideal body weight was calculated based on a body mass index (BMI) of 22 kg/m2
for its validity.16,17 A GNRI score >98 is considered normal, a score between 92 and 98 indicates a low risk of malnutrition, and a score <92 reflects moderate-severe malnutrition.
The PNI is calculated as: 10 × serum albumin (g/dL) + 0.005 × total lymphocyte count (mm3).18 A PNI score <45 is considered indicative of malnutrition.19
Definitions and Study Endpoint
The primary endpoint was CA-AKI, defined as an absolute increase ≥0.3 mg/dL or a relative increase ≥50% from baseline SCr within 48 h after contrast medium exposure.20,21 Coronary artery disease (CAD) was defined according to current guidelines and was classified as chronic coronary syndrome (CCS), unstable angina (UA), non-ST-segment elevation myocardial infarction (NSTEMI), and ST-segment elevation myocardial infarction (STEMI).22,23 Acute myocardial infarction includes NSTEMI and STEMI. The diagnosis of HF was based on the 2016 ESC guideline.24 Anemia was defined as hematocrit (HCT) <0.39 (for males) or <0.36 (for females). The eGFR was calculated using the modified modification of diet in renal disease equation: 186.3 × SCr−1.154
× (age in years)−0.203
× 1.212 (if patient was black) × 0.742 (if patient was female).25 CKD was defined as an eGFR <60 mL/min/1.73 m2, indicating impaired kidney function, but without the need for dialysis. Bleeding events were defined as the occurrence of the composite of Bleeding Academic Research Consortium type 2, 3, or 5 (BARC-2/3/5) bleeding during hospitalization.26
Statistical Analysis
All statistical analyses were conducted using R version 4.0.4. Continuous variables with a normal distribution are presented as mean±standard deviation (SD), and categorical variables are represented as percentages. Independent Student’s t-test or Wilcoxon rank sum test was performed to determine the differences for normally and non-normally distributed variables between groups divided by CA-AKI and the PNI. One-way analysis of variance or the Kruskal-Wallis test was performed to compare differences between groups divided by the CONUT score and GNRI. The chi-square test was used to compare categorical variables. Univariate and multivariate logistic regression analyses were conducted to investigate the association between CA-AKI and malnutrition defined by the 3 nutritional indexes. Two multivariate logistic regression models were employed: Model 1, which adjusted for age >75 years and sex, and Model 2, which adjusted for variables in Model 1 plus diabetes, HF, hypertension, anemia, CKD, acute MI (AMI), multivessel disease, emergency PCI, systolic blood pressure, white blood cells (WBC), glucose, low-density lipoprotein cholesterol (LDL-C), and uric acid. The indexes were individually involved in these analyses as either continuous or categorical variables. The relationships between CA-AKI and the 3 nutritional indexes as continuous variables were investigated using restricted cubic splines (RCS) to capture potential non-linear associations.
To evaluate and compare the reclassification and discrimination capacity of the 3 nutritional indexes in predicting CA-AKI, area under the curves (AUC), continuous net reclassification improvement (cNRI), and integrated discrimination improvement (IDI) were calculated. DeLong’s test was used to compare the differences in AUCs. Furthermore, C-statistics, cNRI, and IDI were calculated to assess the incremental value of adding the 3 nutritional indexes to Model 2. All P values were two-sided, and values <0.05 were considered statistically significant.
Results
Baseline Characteristics of the Patients
Of the 6,049 enrolled patients (mean age 64.74±10.33 years, 20.8% female), 1,011 (16.7%) had CCS, 2,997 (49.5%) had UA, 1,138 (18.8%) had NSTEMI, and 903 (14.9%) had STEMI. Based on the CONUT scores, 2,823 (46.7%) patients had normal nutritional status, 2,975 (49.2%) had mild malnutrition, and 251 (4.1%) had moderate-severe malnutrition. According to the GNRI, 4,743 (78.4%) patients were classified as normal nutritional status, 939 (15.5%) as mild malnutrition, and 367 (6.07%) as moderate-severe malnutrition. The PNI calculation indicated that 796 (13.2%) patients had malnutrition (Table 1).
Table 1.
Baseline Characteristics of Patients With and Without CA-AKI
| |
Total
(n=6,049) |
CA-AKI
(n=352) |
Non-CA-AKI
(n=5,697) |
P value |
| Demographics |
| Age, years |
64.74±10.33 |
66.76±11.09 |
64.61±10.27 |
<0.001 |
| >75 years, n (%) |
910 (15.0) |
90 (25.6) |
820 (14.4) |
<0.001 |
| Female, n (%) |
1,258 (20.8) |
94 (26.7) |
1,164 (20.4) |
0.005 |
| SBP, mmHg |
132.07±20.27 |
136.00±22.87 |
131.84±20.08 |
0.001 |
| DBP, mmHg |
74.86±12.15 |
76.41±14.37 |
74.77±11.99 |
0.042 |
| BMI, kg/m2 |
24.41±3.61 |
23.89±3.21 |
24.44±3.63 |
0.005 |
| Medical history, n (%) |
| Hypertension |
4,025 (66.5) |
259 (73.6) |
3,766 (66.1) |
0.004 |
| Diabetes mellitus |
1,975 (32.7) |
148 (42.0) |
1,827 (32.1) |
<0.001 |
| Heart failure |
383 (6.3) |
64 (18.2) |
319 (5.6) |
<0.001 |
| Chronic kidney disease |
606 (10.0) |
92 (26.1) |
514 (9.0) |
<0.001 |
| Anemia |
1,566 (25.9) |
139 (39.5) |
1,427 (25.0) |
<0.001 |
| Bleeding event |
80 (1.32) |
11 (3.12) |
69 (1.21) |
0.006 |
| Type of coronary artery disease |
|
|
|
<0.001 |
| Chronic coronary syndrome |
1,011 (16.7) |
46 (13.1) |
965 (16.9) |
|
| Unstable angina |
2,997 (49.5) |
94 (26.7) |
2,903 (51.0) |
|
| NSTEMI |
1,138 (18.8) |
99 (28.1) |
1,039 (18.2) |
|
| STEMI |
903 (14.9) |
113 (32.1) |
790 (13.9) |
|
| Laboratory measurements |
| Lymphocytes, ×109/L |
1.86±0.67 |
1.71±0.69 |
1.87±0.67 |
<0.001 |
| Serum albumin, g/L |
41.38±4.05 |
39.04±4.60 |
41.52±3.97 |
<0.001 |
| Total cholesterol, mmol/L |
4.22±1.20 |
4.43±1.25 |
4.21±1.20 |
0.001 |
| WBC, ×109/L |
7.72±2.76 |
8.93±3.67 |
7.64±2.68 |
<0.001 |
| LDL-C, mmol/L |
2.73±1.06 |
2.91±1.11 |
2.72±1.05 |
0.001 |
| Serum creatinine, umol/L |
81.45±25.73 |
92.05±41.51 |
80.80±24.28 |
<0.001 |
| Uric acid, umol/L |
372.25±99.54 |
392.50±115.16 |
371.07±98.49 |
0.001 |
| Glucose, mmol/L |
6.95±2.92 |
8.12±3.97 |
6.88±2.83 |
<0.001 |
| Proteinuria, % |
|
|
|
<0.001 |
| Trace |
768 (12.70) |
67 (19.03) |
701 (12.30) |
|
| Positive |
390 (6.45) |
73 (20.74) |
317 (5.56) |
|
| Medical therapy during hospitalization, n (%) |
| Antiplatelet agents |
6,014 (99.4) |
350 (99.4) |
5,664 (99.4) |
0.979 |
| Statin |
5,944 (98.3) |
346 (98.3) |
5,598 (98.3) |
0.963 |
| ACEI/ARB/ARNI |
4,608 (76.2) |
255 (72.4) |
4,353 (76.4) |
0.090 |
| β-blocker |
4,648 (76.8) |
252 (71.6) |
4,396 (77.2) |
0.016 |
| Procedure performed |
| Multivessel disease, n (%) |
4,853 (86.1) |
4,566 (85.8) |
287 (89.7) |
0.065 |
| Emergency PCI, n (%) |
625 (10.3) |
74 (21.0) |
551 (9.7) |
<0.001 |
| Contrast volume, mL |
173.07±59.27 |
182.49±74.61 |
172.60±58.38 |
0.088 |
| LVEF |
57.9±7.27 |
58.3±6.96 |
52.6±9.68 |
<0.001 |
| Nutritional indices |
| CONUT |
1.76±1.42 |
2.12±1.75 |
1.74±1.39 |
<0.001 |
| 0–1, n (%) |
2,823 (46.7) |
148 (42.0) |
2,675 (47.0) |
<0.001 |
| 2–4, n (%) |
2,975 (49.2) |
166 (47.2) |
2,809 (49.3) |
|
| ≥5, n (%) |
251 (4.1) |
38 (10.8) |
213 (3.8) |
|
| GNRI |
102.57±6.54 |
98.82±7.24 |
102.81±6.43 |
<0.001 |
| >98, n (%) |
4,743 (78.4) |
198 (56.2) |
4,545 (79.8) |
<0.001 |
| 92–98, n (%) |
939 (15.5) |
103 (29.3) |
836 (14.7) |
|
| <92, n (%) |
367 (6.07) |
51 (14.5) |
316 (5.55) |
|
| PNI |
50.68±5.73 |
47.57±6.27 |
50.87±5.64 |
<0.001 |
| <45, n (%) |
796 (13.2) |
114 (32.4) |
682 (12.0) |
<0.001 |
ACEI, angiotensin-converting enzyme inhibitor; ARB, angiotensin-receptor blocker; ARNI, angiotensin-receptor neprilysin inhibitor; BMI, body mass index; CA-AKI, contrast-associated acute kidney injury; CONUT, Controlling Nutritional Status; DBP, diastolic blood pressure; GNRI, Geriatric Nutritional Risk Index; LDL-C, low-density lipoprotein cholesterol; LVEF, left ventricular ejection fraction; NSTEMI, non-ST-segment elevation myocardial infarction; PCI, percutaneous coronary intervention; PNI, Prognostic Nutritional Index; SBP, systolic blood pressure; STEMI, ST-segment elevation myocardial infarction; WBC, white blood cells.
A total of 352 (5.8%) patients developed CA-AKI. These patients were characterized by being older, more likely female, and with a higher prevalence of malnutrition and comorbidities, including hypertension, diabetes, HF, AMI, CKD, and anemia. Furthermore, these patients had lower BMI, serum albumin level, and lymphocyte count, as well as higher levels of blood pressure, WBC, total cholesterol, LDL-C, SCr, uric acid, and glucose (Table 1). In comparison with patients with normal nutritional status, those with malnutrition as indicated by any of the 3 nutritional indexes were older and more likely to have concomitant AMI and HF. The malnutrition groups tended to have lower levels of blood pressure, BMI, serum albumin, lymphocyte count, and total cholesterol, while having higher levels of SCr.
Malnutrition and CA-AKI
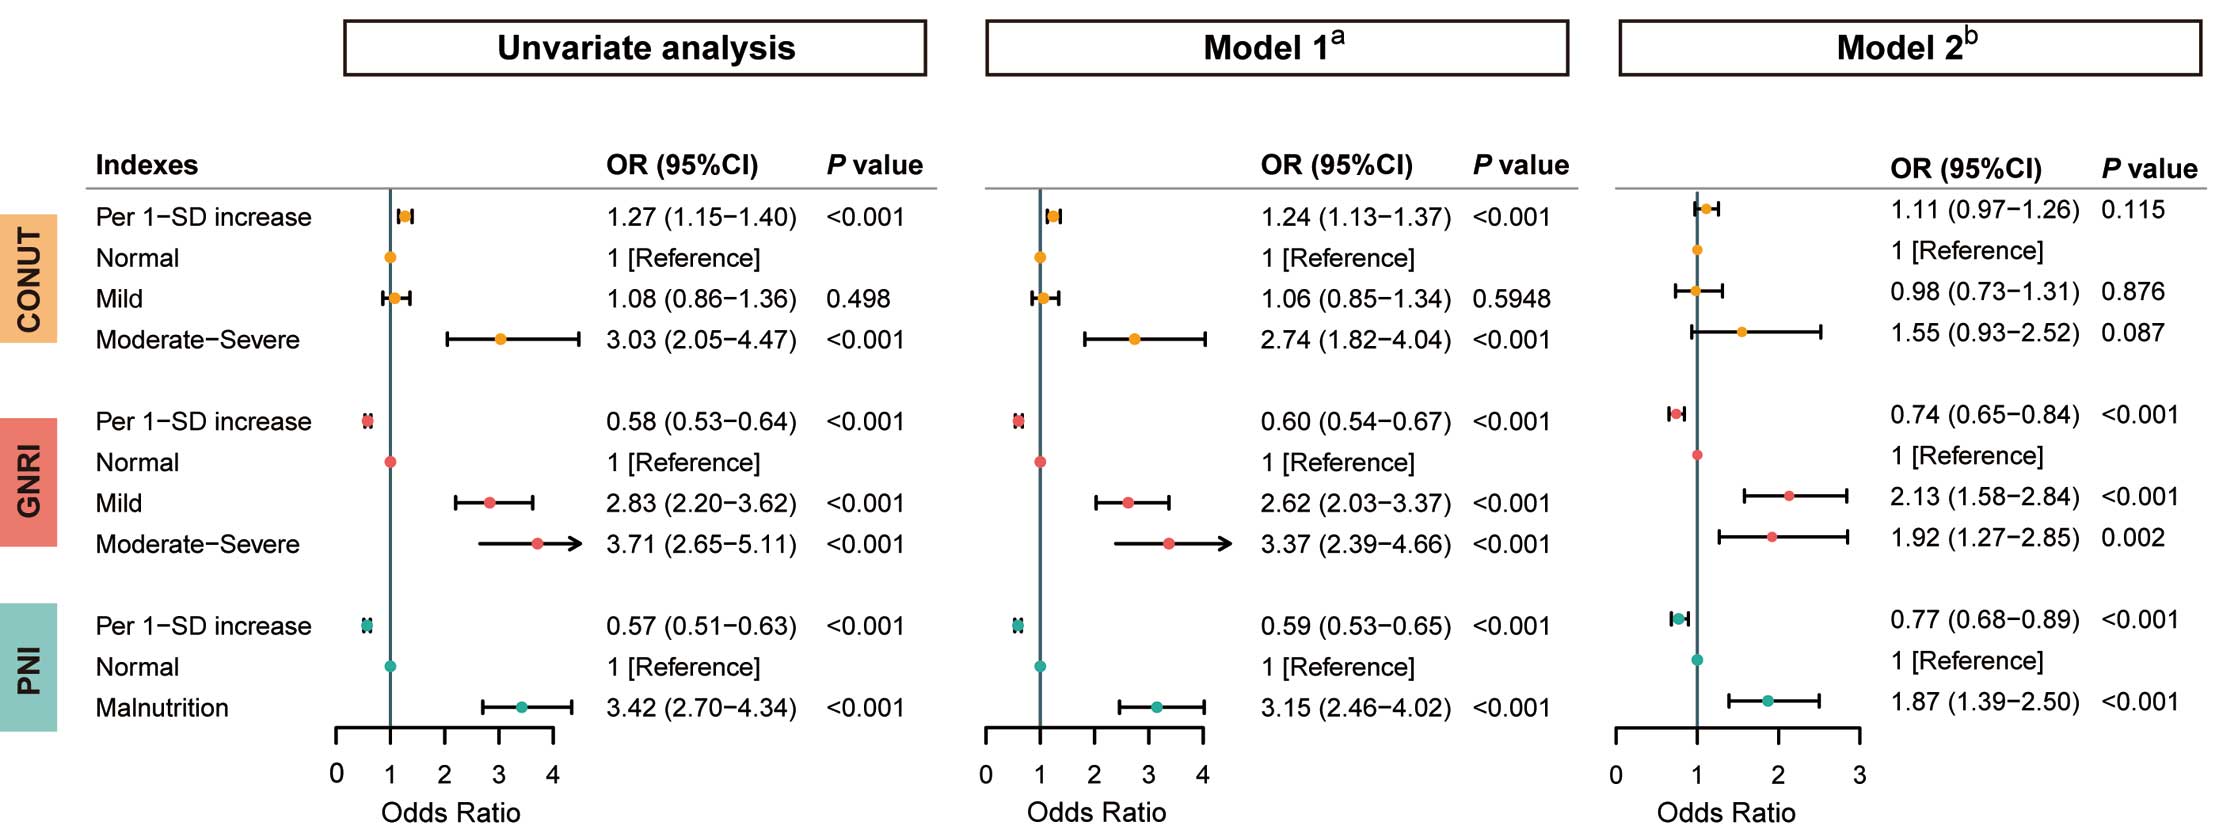
The results of univariate and multivariate logistic regression analysis of the associations between nutritional scores and CA-AKI are presented in Figure 1. In the univariate logistics analysis, the worse nutritional status groups had higher risk of CA-AKI, regardless of the scores being assessed as continuous or categorical variables. The incidences of CA-AKI were 5.2%, 5.6% and 15.1% in patients with no malnutrition, mild malnutrition and moderate-severe malnutrition classified by the CONUT score, respectively. The patients in the moderate-severe malnutrition group had 3-fold increased risk of CA-AKI than those in the no malnutrition group, but there was no difference between the normal and mild groups. For the GNRI, the incidences of CA-AKI were 4.2%, 11.0% and 13.9%, respectively. The odds ratio (OR) was 2.83 (95% confidence interval (CI), 2.20–3.62) for the mild malnutrition group and 3.71 (95% CI, 2.65–5.11) for the moderate-severe group, in comparison with individuals without malnutrition. Similar results were obtained in the analysis of the PNI, with incidences of CA-AKI of 14.3% and 4.5% for patients with malnutrition and no malnutrition, respectively (OR=3.42, [95% CI, 2.70–4.34], P<0.001). In the multivariable logistics regression analysis, the association between malnutrition and CA-AKI was still significant regardless of the nutritional indexes used in Model 1. However, no statistically significant difference was found for the CONUT score in Model 2. Malnutrition measured by the GNRI or PNI remained a significant risk factor, independent of whether the nutritional indexes were used as a continuous or categorical variable. For the GNRI, the malnutrition groups had higher risk of CA-AKI (Mild: OR=2.13, [95% CI, 1.58–2.84], P<0.001; moderate-severe: OR=1.92, [95% CI, 1.27–2.85], P=0.002). A similar relationship was observed for the PNI (OR=1.87, [95% CI, 1.39–2.50], P<0.001). The dose–response relationship between each of the nutritional scores and CA-AKI was estimated using RCS with logistic analysis. Linear relationships between the 3 scores and the risk of CA-AKI were found (all P for non-linearity >0.05) (Figure 2). Subgroup analyses demonstrated no significant interaction effect between the nutritional indexes and CA-AKI in most subgroups (Supplementary Figure).
Predictive Performance of Nutritional Indexes for CA-AKI
Figure 3A presents the receiver operating characteristic (ROC) curves for the 3 nutritional indexes. The increasing AUCs show that both the GNRI (∆AUC=0.115, P<0.001) and PNI (∆AUC=0.101, P<0.001) performed better than the CONUT score in predicting CA-AKI after PCI. However, there was no significant difference between the GNRI and PNI (Table 2). Reclassification analysis demonstrated that both the GNRI and PNI had incremental utility in predicting the risk of CA-AKI compared with the CONUT score. Likewise, the reclassification of the GNRI and PNI was similar in the cNRI and IDI estimates. Additionally, as shown in Figure 3B, the ROC curves for the 3 nutritional indexes were added to Model 2. The GNRI and PNI still exhibited superior performance compared with the CONUT score and significantly improved the predictive accuracy of CA-AKI (Table 3). In addition, we compared the discrimination of serum albumin and each malnutrition index for CA-AKI, and the GNRI still outperformed at predicting CA-AKI compared with serum albumin (∆AUC=0.004, P=0.387) and other nutritional indexes (Supplementary Table 1). There was no significant difference between the AUCs of the GNRI, PNI, and serum albumin.

Table 2.
Comparative Analysis of the Discrimination of Each Malnutrition Scores for CA-AKI
| Comparison |
ΔAUC |
P value |
cNRI (95% CI) |
P value |
IDI (95% CI) |
P value |
| GNRI vs. CONUT |
0.115 |
<0.001 |
0.439 (0.334~0.544) |
<0.001 |
0.018 (0.013~0.022) |
<0.001 |
| PNI vs. CONUT |
0.101 |
<0.001 |
0.448 (0.344~0.552) |
<0.001 |
0.017 (0.014~0.020) |
<0.001 |
| PNI vs. GNRI |
−0.014 |
0.165 |
0.024 (−0.083~0.131) |
0.661 |
−0.001 (−0.004~0.002) |
0.644 |
ΔAUC, difference of area under curve; CI, confidence interval; cNRI, continuous net reclassification improvement; IDI, integrated discrimination improvement.
Table 3.
Model Performance After the Addition of Malnutrition Scores to Model 2 for Predicting CA-AKI
| Model |
AUC (95% CI) |
P value |
cNRI |
P value |
IDI |
P value |
| Model 2* |
0.756 (0.728~0.787) |
Ref. |
Ref. |
Ref. |
Ref. |
Ref. |
| Model 2+CONUT (categorical) |
0.761 (0.731~0.790) |
0.073 |
−0.167 |
0.002 |
0.001 |
0.421 |
| Model 2+GNRI (categorical) |
0.768 (0.738~0.797) |
0.036 |
0.487 |
<0.001 |
0.008 |
<0.001 |
| Model 2+PNI (categorical) |
0.765 (0.736~0.794) |
0.039 |
0.157 |
0.006 |
0.005 |
0.018 |
*Model 2 adjusted for variables including age >75 years, sex, diabetes, heart failure, hypertension, anemia, eGFR <60 mL/min/1.73 m2, acute myocardial infarction, multivessel disease, emergency PCI, SBP, WBC, glucose, LDL-C and uric acid. Abbreviations as in Tables 1,2.
Sensitivity Analysis
We conducted a series of sensitivity analyses to assess the robustness of the results. More confounders were added into Model 2, and the definition of CA-AKI was changed to an increase in SCr ≥0.5 mg/dL or ≥25% within 48 h after the PCI procedure according to the European Society of Urogenital Radiology (ESUR).27 The results were consistent with the main findings (Supplementary Table 2).
Discussion
To the best of our knowledge, we are the first to investigate the relationship between malnutrition and CA-AKI after PCI using 3 different nutritional indexes: the CONUT score, GNRI and PNI. Our study results revealed that malnutrition, especially when defined by the GNRI and PNI, was associated with an increased risk of CA-AKI in patients undergoing PCI.
Malnutrition is common in patients with CAD and related to unfavorable prognosis.9,10,12,28 As objective nutritional indexes to evaluate nutritional status, the CONUT score, GNRI and PNI are important prognostic factors for poor outcomes in patients with CAD,10 especially in those undergoing PCI.11,29,30 However, the relationship between malnutrition and CA-AKI after PCI, a common complication of the procedure, remains unclear. Previous studies have shown that malnutrition is associated with an increased risk of AKI, not only in hospitalized patients,6 but also in patients with sepsis,7 malignancy8 or ACS.9 Some studies have reported that single nutrition indexes, such as albumin or prealbumin, are associated with an increased risk of CA-AKI after PCI,31,32 but it is important to note that single nutrition indexes can be influenced by multiple factors. In a recent study by Wei et al, the CONUT score was used to classify nutritional status, and they found that moderate-severe malnutrition, as determined by the CONUT score, was associated with a higher risk of CA-AKI in elderly patients undergoing PCI.33 Chen et al investigated the occurrence of CA-AKI in patients with CAD undergoing coronary angiography and observed that malnutrition, as classified by the CONUT score, was prevalent and associated with a higher risk of CA-AKI.34 Another study conducted by Han et al examined the relationship between nutritional status assessed by the PNI and the occurrence of CA-AKI after PCI, and their findings demonstrated a significant association between PNI and CA-AKI.35 However, it should be noted that the studies conducted thus far have been limited in size and may not have provided a representative epidemiological picture of the general population undergoing PCI. Notably, our study investigated the predictive value of malnutrition for CA-AKI after PCI using 3 distinct nutritional indexes, and found that malnutrition as determined by the GNRI or PNI remained significantly associated with an increased risk of CA-AKI following PCI, even after adjusting for confounding risk factors.
A plausible explanation for the link between malnutrition and CA-AKI is that nutritional status could potentially serve as an proxy indicator of inflammation.36 Chronic inflammatory diseases are associated with increased production of catabolic cytokines, muscle catabolism, appetite inhibition, and consequent deterioration in nutritional status.37 Inflammation also plays an important role in the pathogenesis of CA-AKI. Multiple inflammatory cytokines, including interleukins -1 and -6, and tumor necrosis factor-α, aggravate vasoconstriction and oxidative stress, leading to renal medullary hypoxia, impairment of tubular cells, and endothelial cells, and ultimately, affecting renal function.38,39 Severe malnutrition is associated with increased inflammation, which in turn increases the risk of CA-AKI. Hence, the identification of malnutrition is beneficial for identifying patients undergoing PCI who may be at risk of developing CA-AKI.
In addition, our study found that, compared with the CONUT score, the GNRI and PNI showed better predictive ability for CA-AKI after PCI. For the evaluation of nutritional status, the GNRI includes serum albumin and body weight. The PNI includes serum albumin, and lymphocyte count. However, CONUT comprises not only albumin and lymphocyte count, but also total cholesterol levels. In the current study, albumin and lymphocytes were significantly lower in patients developing CA-AKI, whereas cholesterol was significantly higher in individuals with CA-AKI, which may be the reason why the CONUT score showed worse predictive ability. Total cholesterol includes LDL-C, high-density lipoprotein cholesterol (HDL-C) and others.40 It has been suggested that a higher LDL-C concentration is significantly associated with a greater risk of more complex revascularization,41 which may lead to a higher dosage of contrast medium that contributes to the development of CA-AKI. A previous study demonstrated that a higher level of LDL-C was associated with a higher risk of CA-AKI in patients undergoing PCI, whereas in another it was a lower level of HDL-C.42,43 Hence, opposite relationships with CA-AKI within the total cholesterol may attenuate predictive power, which in part explains our result. In addition, statins, as cholesterol-lowing drugs, are believed to lower the risk of CA-AKI.44 5,944 (98.3%) patients in our study were prescribed a statin, which may account for overestimation of the proportion of undernourished patients. Consequently, according to our findings, the GNRI and PNI are recommended for identification of patients at high risk of developing CA-AKI after PCI. Nevertheless, each of these nutrition screening tools has disadvantages as well. In patients with edema, especially HF and CKD, the GNRI is likely to overestimate nutritional status due to the weight involved in the formula. In the PNI, inflammation can be reflected in addition to nutritional status,45 so the index may be affected when assessing the nutritional status of patients with infection. For that reason, physicians can choose an appropriate index depending on the clinical scenario. Taken together, nutritional assessment as part of CA-AKI risk stratification in clinical practice is encouraged. The simple formulas of the GNRI and PNI enable physicians to quickly screen for malnutrition. More importantly, this finding offers new insight into preventing CA-AKI. Improvement of nutritional status, such as developing personalized diet regimens, optimizing nutritional intake via high-quality protein, fortified diets, or oral nutritional supplements if necessary,46,47 could be a potential intervention for high-risk patients. However, further exploration is required to verify this viewpoint.
Study Limitations
Firstly, this was a single-center, retrospective study with the subsequent disadvantages secondary to its nature. Second, our study did not compare the predictive value of objective nutritional scores with more complex comprehensive nutritional assessment such as Nutritional Risk Screening 2002 (NRS-2002). Third, although we adjusted for many confounding factors, there were still some potential confounders that could not be controlled. Fourth, albuminuria and proteinuria were not evaluated to diagnose CKD in our study, due to the lack of quantitative data. Despite these limitations, our study has a certain clinical significance because of the wide availability of the variables required for the nutritional indexes and because malnutrition is a potentially modifiable risk and therapeutic target.
Conclusions
Malnutrition, especially identified by the GNRI and PNI, was associated with higher risk of CA-AKI after PCI. The GNRI and PNI showed better performance for predicting CA-AKI than the CONUT score.
Acknowledgments
This study was funded by a grant from National Natural Science Foundation of China General Program (Grant number: 81873495, 82171569), Heart Failure Center Research Foundation of Fujian Provincial Hospital (supported by Fujian Provincial Department of Finance), National Key Clinical Specialty Construction Project of China (Cardiovascular Medicine 2021). The grants played no role in the design of the study, collection of data, follow-up of the patients, interpretation of data and in writing the manuscript.
Disclosures
The authors declare that they have no conflict of interests.
Ethics Approval / Consent to Participate
The protocol fulfilled the requirements of the Declaration of Helsinki and was approved by the Ethics Committee of the Fujian Provincial Hospital, China (ethics approval number: K2019-07-011). Written informed consent was given by all patients included in the study.
Supplementary Files
Please find supplementary file(s);
https://doi.org/10.1253/circj.CJ-23-0479
References
- 1.
McCullough PA. Contrast-induced acute kidney injury. J Am Coll Cardiol 2008; 51: 1419–1428, doi:10.1016/j.jacc.2007.12.035.
- 2.
Marenzi G, Lauri G, Assanelli E, Campodonico J, De Metrio M, Marana I, et al. Contrast-induced nephropathy in patients undergoing primary angioplasty for acute myocardial infarction. J Am Coll Cardiol 2004; 44: 1780–1785, doi:10.1016/j.jacc.2004.07.043.
- 3.
Weisbord SD, Chen H, Stone RA, Kip KE, Fine MJ, Saul MI, et al. Associations of increases in serum creatinine with mortality and length of hospital stay after coronary angiography. J Am Soc Nephrol 2006; 17: 2871–2877, doi:10.1681/ASN.2006030301.
- 4.
Goto Y, Koyama K, Katayama S, Tonai K, Shima J, Koinuma T, et al. Influence of contrast media on renal function and outcomes in patients with sepsis-associated acute kidney injury: A propensity-matched cohort study. Crit Care 2019; 23: 249, doi:10.1186/s13054-019-2517-3.
- 5.
Geenen RWF, Kingma HJ, van der Molen AJ. Contrast-induced nephropathy: Pharmacology, pathophysiology and prevention. Insights Imaging 2013; 4: 811–820, doi:10.1007/s13244-013-0291-3.
- 6.
Li C, Xu L, Guan C, Zhao L, Luo C, Zhou B, et al. Malnutrition screening and acute kidney injury in hospitalised patients: A retrospective study over a 5-year period from China. Br J Nutr 2020; 123: 337–346, doi:10.1017/S000711451900271X.
- 7.
Shimoyama Y, Umegaki O, Kadono N, Minami T. Presepsin and prognostic nutritional index are predictors of septic acute kidney injury, renal replacement therapy initiation in sepsis patients, and prognosis in septic acute kidney injury patients: A pilot study. BMC Nephrol 2021; 22: 219, doi:10.1186/s12882-021-02422-x.
- 8.
Sim JH, Bang JY, Kim SH, Kang SJ, Song JG. Association of preoperative prognostic nutritional index and postoperative acute kidney injury in patients with colorectal cancer surgery. Nutrients 2021; 13: 1604, doi:10.3390/nu13051604.
- 9.
Yu J, Li D, Jia Y, Li F, Jiang Y, Zhang Q, et al. Nutritional Risk Screening 2002 was associated with acute kidney injury and mortality in patients with acute coronary syndrome: Insight from the REACP study. Nutr Metab Cardiovasc Dis 2021; 31: 1121–1128, doi:10.1016/j.numecd.2020.12.028.
- 10.
Raposeiras Roubín S, Abu Assi E, Cespón Fernandez M, Barreiro Pardal C, Lizancos Castro A, Parada JA, et al. Prevalence and prognostic significance of malnutrition in patients with acute coronary syndrome. J Am Coll Cardiol 2020; 76: 828–840, doi:10.1016/j.jacc.2020.06.058.
- 11.
Fan Y, He L, Zhou Y, Man C. Predictive value of Geriatric Nutritional Risk Index in patients with coronary artery disease: A meta-analysis. Front Nutr 2021; 8: 736884, doi:10.3389/fnut.2021.736884.
- 12.
Chen SC, Yang YL, Wu CH, Huang SS, Chan WL, Lin SJ, et al. Association between preoperative nutritional status and clinical outcomes of patients with coronary artery disease undergoing percutaneous coronary intervention. Nutrients 2020; 12: 1295, doi:10.3390/nu12051295.
- 13.
Freeman AM, Morris PB, Barnard N, Esselstyn CB, Ros E, Agatston A, et al. Trending cardiovascular nutrition controversies. J Am Coll Cardiol 2017; 69: 1172–1187, doi:10.1016/j.jacc.2016.10.086.
- 14.
Ignacio de Ulíbarri J, González-Madroño A, de Villar NGP, González P, González B, Mancha A, et al. CONUT: A tool for controlling nutritional status. First validation in a hospital population. Nutr Hosp 2005; 20: 38–45.
- 15.
Bouillanne O, Morineau G, Dupont C, Coulombel I, Vincent JP, Nicolis I, et al. Geriatric Nutritional Risk Index: A new index for evaluating at-risk elderly medical patients. Am J Clin Nutr 2005; 82: 777–783, doi:10.1093/ajcn/82.4.777.
- 16.
Cereda E, Pedrolli C. The Geriatric Nutritional Risk Index. Curr Opin Clin Nutr Metab Care 2009; 12: 1–7, doi:10.1097/MCO.0b013e3283186f59.
- 17.
Shah B, Sucher K, Hollenbeck CB. Comparison of ideal body weight equations and published height-weight tables with body mass index tables for healthy adults in the United States. Nutr Clin Pract 2006; 21: 312–319, doi:10.1177/0115426506021003312.
- 18.
Buzby GP, Mullen JL, Matthews DC, Hobbs CL, Rosato EF. Prognostic nutritional index in gastrointestinal surgery. Am J Surg 1980; 139: 160–167, doi:10.1016/0002-9610(80)90246-9.
- 19.
Onodera T, Goseki N, Kosaki G. Prognostic nutritional index in gastrointestinal surgery of malnourished cancer patients. Nihon Geka Gakkai Zasshi 1984; 85: 1001–1005 (in Japanese).
- 20.
Mehta RL, Kellum JA, Shah SV, Molitoris BA, Ronco C, Warnock DG, et al. Acute Kidney Injury Network: Report of an initiative to improve outcomes in acute kidney injury. Crit Care 2007; 11: R31, doi:10.1186/cc5713.
- 21.
Davenport MS, Perazella MA, Yee J, Dillman JR, Fine D, McDonald RJ, et al. Use of intravenous iodinated contrast media in patients with kidney disease: Consensus Statements from the American College of Radiology and the National Kidney Foundation. Radiology 2020; 294: 660–668, doi:10.1148/radiol2019192094.
- 22.
Thygesen K, Alpert JS, Jaffe AS, Chaitman BR, Bax JJ, Morrow DA, et al. Fourth Universal Definition of Myocardial Infarction (2018). Circulation 2018; 138: e618–e651, doi:10.1161/CIR.0000000000000617.
- 23.
Knuuti J, Wijns W, Saraste A, Capodanno D, Barbato E, Funck-Brentano C, et al. 2019 ESC Guidelines for the diagnosis and management of chronic coronary syndromes. Eur Heart J 2020; 41: 407–477, doi:10.1093/eurheartj/ehz425.
- 24.
Ponikowski P, Voors AA, Anker SD, Bueno H, Cleland JGF, Coats AJS, et al. 2016 ESC Guidelines for the diagnosis and treatment of acute and chronic heart failure: The Task Force for the diagnosis and treatment of acute and chronic heart failure of the European Society of Cardiology (ESC). Developed with the special contribution of the Heart Failure Association (HFA) of the ESC. Eur J Heart Fail 2016; 18: 891–975, doi:10.1002/ejhf.592.
- 25.
National Kidney Foundation. K/DOQI clinical practice guidelines for chronic kidney disease: Evaluation, classification, and stratification. Am J Kidney Dis 2002; 39: S1–S266.
- 26.
Mehran R, Rao SV, Bhatt DL, Gibson CM, Caixeta A, Eikelboom J, et al. Standardized bleeding definitions for cardiovascular clinical trials: A consensus report from the Bleeding Academic Research Consortium. Circulation 2011; 123: 2736–2747.
- 27.
Morcos SK, Thomsen HS, Webb JA. Contrast-media-induced nephrotoxicity: A consensus report. Contrast Media Safety Committee, European Society of Urogenital Radiology (ESUR). Eur Radiol 1999; 9: 1602–1613, doi:10.1007/s003300050894.
- 28.
Tonet E, Campo G, Maietti E, Formiga F, Martinez-Sellés M, Pavasini R, et al. Nutritional status and all-cause mortality in older adults with acute coronary syndrome. Clin Nutr 2020; 39: 1572–1579, doi:10.1016/j.clnu.2019.06.025.
- 29.
Cheng L, Rong J, Zhuo X, Gao K, Meng Z, Wen X, et al. Prognostic value of malnutrition using geriatric nutritional risk index in patients with coronary chronic total occlusion after percutaneous coronary intervention. Clin Nutr 2021; 40: 4171–4179, doi:10.1016/j.clnu.2021.01.042.
- 30.
Chen QJ, Qu HJ, Li DZ, Li XM, Zhu JJ, Xiang Y, et al. Prognostic nutritional index predicts clinical outcome in patients with acute ST-segment elevation myocardial infarction undergoing primary percutaneous coronary intervention. Sci Rep 2017; 7: 3285, doi:10.1038/s41598-017-03364-x.
- 31.
You ZB, Lin KY, Zheng WP, Lin CJ, Lin F, Guo TL, et al. Association of prealbumin levels with contrast-induced acute kidney injury in elderly patients with elective percutaneous coronary intervention. Clin Interv Aging 2018; 13: 641–649, doi:10.2147/CIA.S162764.
- 32.
Murat SN, Kurtul A, Yarlioglues M. Impact of serum albumin levels on contrast-induced acute kidney injury in patients with acute coronary syndromes treated with percutaneous coronary intervention. Angiology 2015; 66: 732–737, doi:10.1177/0003319714551979.
- 33.
Wei X, Chen H, You Z, Yang J, He H, He C, et al. Nutritional status and risk of contrast-associated acute kidney injury in elderly patients undergoing percutaneous coronary intervention. Clin Exp Nephrol 2021; 25: 953–962, doi:10.1007/s10157-021-02061-4.
- 34.
Chen L, Huang Z, Li W, He Y, Liang J, Lu J, et al. Malnutrition and the risk for contrast-induced acute kidney injury in patients with coronary artery disease. Int Urol Nephrol 2022; 54: 429–435, doi:10.1007/s11255-021-02915-6.
- 35.
Han M, Lee HW, Lee HC, Kim HJ, Seong EY, Song SH. Impact of nutritional index on contrast-associated acute kidney injury and mortality after percutaneous coronary intervention. Sci Rep 2021; 11: 7123, doi:10.1038/s41598-021-86680-7.
- 36.
Kalantar-Zadeh K, Anker SD, Horwich TB, Fonarow GC. Nutritional and anti-inflammatory interventions in chronic heart failure. Am J Cardiol 2008; 101: 89E–103E, doi:10.1016/j.amjcard.2008.03.007.
- 37.
Li DK. Notice of Retraction and Replacement. Li et al. Association between maternal exposure to magnetic field nonionizing radiation during pregnancy and risk of attention-deficit/hyperactivity disorder in offspring in a longitudinal birth cohort. JAMA Netw Open. 2020;3(3):e201417. JAMA Netw Open 2021; 4: e2033605, doi:10.1001/jamanetworkopen.2020.33605.
- 38.
Seeliger E, Sendeski M, Rihal CS, Persson PB. Contrast-induced kidney injury: Mechanisms, risk factors, and prevention. Eur Heart J 2012; 33: 2007–2015, doi:10.1093/eurheartj/ehr494.
- 39.
Zhang F, Lu Z, Wang F. Advances in the pathogenesis and prevention of contrast-induced nephropathy. Life Sci 2020; 259: 118379, doi:10.1016/j.lfs.2020.118379.
- 40.
Voight BF, Peloso GM, Orho-Melander M, Frikke-Schmidt R, Barbalic M, Jensen MK, et al. Plasma HDL cholesterol and risk of myocardial infarction: A mendelian randomisation study. Lancet 2012; 380: 572–580, doi:10.1016/S0140-6736(12)60312-2.
- 41.
Oyama K, Furtado RHM, Fagundes A, Zelniker TA, Tang M, Kuder J, et al. Effect of evolocumab on complex coronary disease requiring revascularization. J Am Coll Cardiol 2021; 77: 259–267, doi:10.1016/j.jacc.2020.11.011.
- 42.
Park HS, Kim CJ, Hwang BH, Kim TH, Koh YS, Park HJ, et al. HDL cholesterol level is associated with contrast induced acute kidney injury in chronic kidney disease patients undergoing PCI. Sci Rep 2016; 6: 35774, doi:10.1038/srep35774.
- 43.
Liu Y, Liu Y, Chen J, Zhou Y, Chen Z, Yu D, et al. LDL cholesterol as a novel risk factor for contrast-induced acute kidney injury in patients undergoing percutaneous coronary intervention. Atherosclerosis 2014; 237: 453–459, doi:10.1016/j.atherosclerosis.2014.10.022.
- 44.
van der Molen AJ, Reimer P, Dekkers IA, Bongartz G, Bellin MF, Bertolotto M, et al. Post-contrast acute kidney injury. Part 2: Risk stratification, role of hydration and other prophylactic measures, patients taking metformin and chronic dialysis patients: Recommendations for updated ESUR Contrast Medium Safety Committee guidelines. Eur Radiol 2018; 28: 2856–2869, doi:10.1007/s00330-017-5247-4.
- 45.
Zhang W, Ye B, Liang W, Ren Y. Author Correction: Preoperative prognostic nutritional index is a powerful predictor of prognosis in patients with stage III ovarian cancer. Sci Rep 2018; 8: 9736, doi:10.1038/s41598-018-27841-z.
- 46.
Marshall RN, Smeuninx B, Morgan PT, Breen L. Nutritional strategies to offset disuse-induced skeletal muscle atrophy and anabolic resistance in older adults: From whole-foods to isolated ingredients. Nutrients 2020; 12: 1533, doi:10.3390/nu12051533.
- 47.
Venianaki M, Andreou A, Nikolouzakis TK, Chrysos E, Chalkiadakis G, Lasithiotakis K. Factors associated with malnutrition and its impact on postoperative outcomes in older patients. J Clin Med 2021; 10: 2550, doi:10.3390/jcm10122550.

