Abstract
Background: Percutaneous mitral valvuloplasty (PMV) is a standard treatment for severe rheumatic mitral stenosis (RMS). However, the prognostic significance of the change in mitral valve area (∆MVA) during PMV is not fully understood.
Methods and Results: This study analyzed data from the Multicenter mitrAl STEnosis with Rheumatic etiology (MASTER) registry, which included 3,140 patients with severe RMS. We focused on patients with severe RMS undergoing their first PMV. Changes in echocardiographic parameters, including MVA quantified before and after PMV, and composite outcomes, including mitral valve reintervention, heart failure admission, stroke, and all-cause death, were evaluated. An optimal result was defined as a postprocedural MVA ≥1.5 cm2
without mitral regurgitation greater than Grade II. Of the 308 patients included in the study, those with optimal results and ∆MVA >0.5 cm² had a better prognosis (log-rank P<0.001). Patients who achieved optimal results but with ∆MVA ≤0.5 cm² had a greater risk of composite outcomes than those with optimal outcomes and ∆MVA >0.5 cm² (nested Cox regression analysis, hazard ratio 2.27; 95% confidence interval 1.09–4.73; P=0.028).
Conclusions: Achieving an increase in ∆MVA of >0.5 cm2
was found to be correlated with improved outcomes. This suggests that, in addition to achieving traditional optimal results, targeting an increase in ∆MVA of >0.5 cm2
could be a beneficial objective in PMV treatment for RMS.
Although the prevalence of non-rheumatic, degenerative mitral stenosis (MS) is increasing, MS commonly has a rheumatic etiology.1–3 Globally, the age-standardized prevalence of heart failure associated with rheumatic heart disease (RHD) increased by 88% from 1990 to 2015.4 The RHD burden remains a substantial challenge because two-thirds of the world’s population lives in developing countries, where rheumatoid fever and RHD are prevalent.5 Since the introduction of percutaneous mitral valvuloplasty (PMV) with the Inoue balloon in 1984, it has been established as a safe and effective procedure for treating patients with rheumatic MS (RMS).6 Previous studies showed that the early outcomes of PMV were comparable or even superior to those achieved with closed or open surgical valvotomy.7,8
Recent guidelines recommend PMV for patients with symptomatic severe RMS when valve morphology is favorable.9,10 However, there are limited data on preplanning, sizing, the target valve area to be achieved during the procedure, and postprocedural assessment. Several studies have emphasized the significance of the post-PMV valve area for clinical outcomes.11,12 Traditionally, a post-PMV mitral valve area (MVA) of ≥1.5 cm2
along with mitral regurgitation (MR) of grade I or II have been considered optimal results.13–16 In addition to the area after PMV, the change in MVA (∆MVA) resulting from PMV would be a key factor in determining the success of the procedure and its effect on clinical outcomes for patients undergoing this treatment. For example, a post-PMV MVA target of ≥1.5 cm2
may not be suitable for symptomatic patients with milder forms of stenosis, such as with an MVA around 1.5 cm2. In these situations, ∆MVA could serve as a more appropriate target for intervention.
Thus, the present study was designed to investigate the relationship between the ∆MVA achieved through PMV and clinical outcomes, while also considering traditional criteria for PMV success. We adopted the threshold of ∆MVA of =0.5 cm2, a value established in professional guidelines as the benchmark for denoting a 1-grade change in the severity of MS.17,18
Methods
Study Population
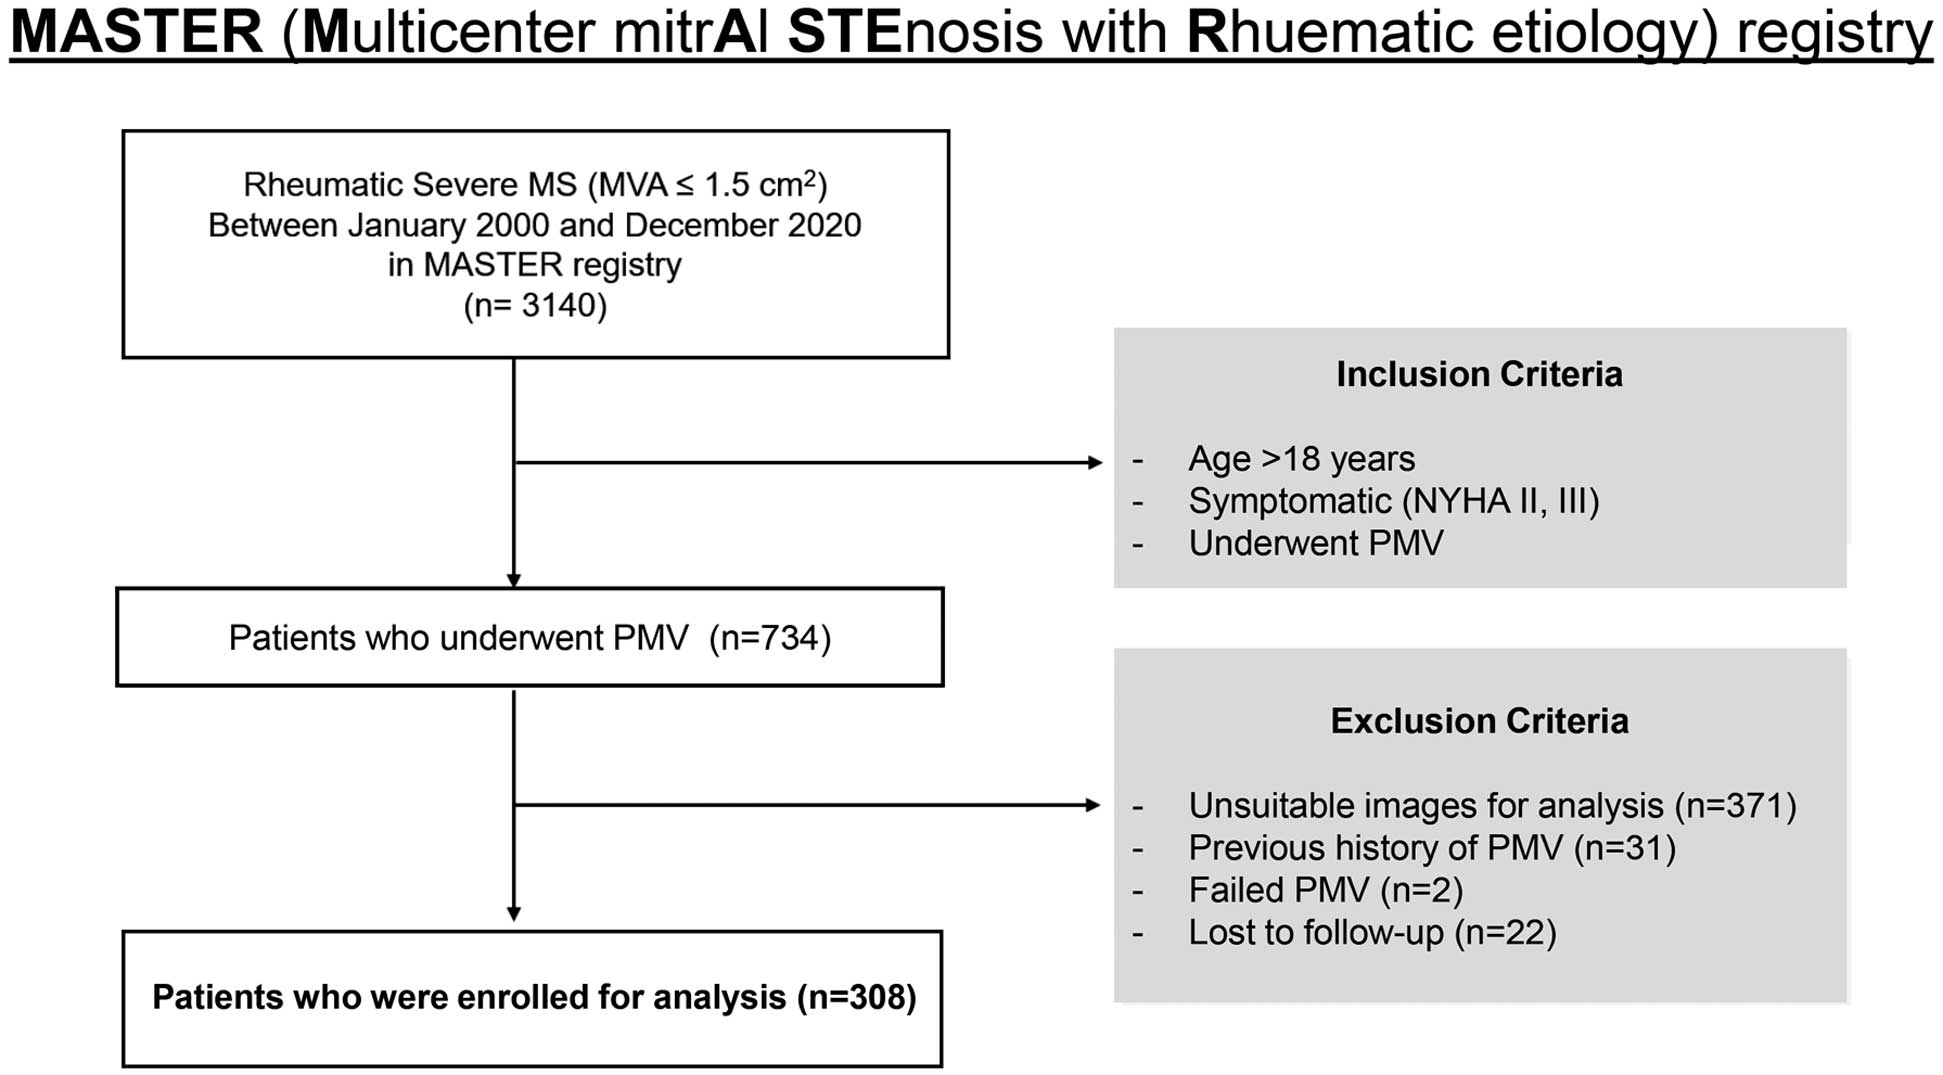
The Multicenter mitrAl STEnosis in Rheumatic etiology (MASTER) registry is a retrospective cohort that was constructed based on an electronic database of 3,140 patients with RMS between January 2000 and December 2020. The registry consisted data on patients from 4 affiliated hospitals offering comprehensive care for individuals with valvular heart disease. We screened patients aged >18 years and diagnosed with RMS, which was assessed by transthoracic echocardiography. Severe RMS was defined as an MVA <1.5 cm2, according to the 2020 American College of Cardiology (ACC)/American Heart Association (AHA) and 2021 European Society of Cardiology (ESC)/European Association for Cardio-Thoracic Surgery (EACTS) guidelines for valvular heart disease.9,10 Clinical status was determined using the New York Heart Association (NYHA) classification. We included symptomatic patients (NYHA functional class II or III) who received PMV. The exclusion criteria were: (1) a history of previous PMV; (2) PMV not performed because of balloon passage failure; and (3) failure of patient follow-up over 6 months after the procedure.
The study included 308 patients with symptomatic severe RMS who had received their first PMV (Figure 1). Demographic and clinical data, including a medical history of hypertension (HTN), diabetes, chronic kidney disease (CKD), or atrial fibrillation (AF), were retrospectively collected from electronic medical records. HTN, diabetes, and CKD were defined based on the presence of a diagnosis and the prescription of medications for these conditions. AF was defined as being confirmed through electrocardiographic analysis.
The study protocol was approved by the Yonsei Medical Center Institutional Review Board (IRB approval no. 2021-0979-001) and was performed in accordance with the Declaration of Helsinki. The need for informed consent was waived owing to the retrospective nature of the study. This study was performed in accordance with the Strengthening the Reporting of Observational Studies in Epidemiology reporting guidelines.19
Echocardiography
Conventional transthoracic echocardiography was performed in accordance with the guidelines of the American Society of Echocardiography.20 RMS was defined as the presence of certain features, such as commissural fusion of either the medial or lateral annulus, fibro-thickened valve, and doming of an anterior mitral leaflet during diastole. The MVA was determined by measuring the smallest valve orifice area between the tips of the valve leaflets using 2-dimensional (2D) or 2D-guided biplane images obtained from the parasternal short- and long-axis views.21,22 The transmitral mean diastolic pressure gradient (MDPG) was measured from the continuous wave Doppler of mitral flow velocity. Valvular regurgitations were graded using semiquantitative methods for color Doppler regurgitation area, vena contracta width, and proximal isovelocity surface area. The severity of the morphological characteristics of the mitral valve (MV) and its apparatus, namely leaflet mobility, valve thickness, subvalvular thickening, and valvular calcification, were added to calculate the Wilkins echo score.23 Transesophageal echocardiography was performed on every patient before PMV to exclude the presence of left atrial (LA) thrombi. A follow-up echocardiogram was conducted for all patients after the PMV procedure and before discharge. All parameters were calculated by averaging 3 consecutive cardiac cycles in sinus rhythm and 5 cardiac cycles in AF.
PMV Procedure
An experienced cardiologist performed PMV using an Inoue balloon catheter while monitoring standard hemodynamic parameters. Balloon size was selected based on the patient’s height, weight, and body surface area. The procedure was completed after stepwise inflation and confirmation by fluoroscopy that the balloon was fully expanded. The optimal result of PMV was defined as a post-MVA >1.5 cm2
without the development of MR greater than Grade II, as determined via echocardiography, according to previous studies. If these optimal outcome criteria were not met, the result was classified as suboptimal.15,24
Outcomes
The composite outcomes were defined as an MV reintervention, including mitral valve replacement or redo PMV; hospitalization for heart failure (HF); stroke; and all-cause mortality. Hospitalization for HF was defined as admission for treatment of dyspnea with diuretics. Stroke was defined as a new onset of focal neurological symptoms and an infarction confirmed on brain magnetic resonance imaging.
Statistical Analyses
Baseline characteristics were analyzed and are presented in terms of proportions using descriptive statistics. Continuous variables are presented as the mean±SD and were compared using Student’s t-test or the Mann-Whitney U test. Categorical variables are described as frequencies with percentages and were compared using the Chi-squared test or Fisher’s exact test as appropriate. One-way analysis of variance was used to compare continuous variables, and Scheffé’s test was performed for post hoc analysis. A density histogram was created to examine the distribution of ∆MVA following the PMV, and the Shapiro-Wilk test was conducted to assess data normality. A linear regression analysis with calculation of Pearson’s correlation coefficient was performed to identify associations between the pre-MVA and changes in echocardiographic parameters before and after PMV. Overall event-free survival rates were estimated using Kaplan-Meier analysis and compared using the log-rank test. Univariate Cox proportional hazards regression was used to explore factors associated with composite outcomes. Thereafter, nested Cox proportional hazard regression was used to evaluate the impact of PMV results and ∆MVA on these outcomes. In addition, the global Chi-squared test was used to ascertain the incremental prognostic value of ∆MVA with regard to composite outcomes. Statistical analyses were conducted using MedCalc version 20.114 (MedCalc Software, Ostend, Belgium) and R version 4.0.1 (R Foundation for Statistical Computing, Vienna, Austria). P<0.05 was considered statistically significant, and all tests were 2-tailed.
Results
Baseline Characteristics Before PMV
The study cohort included 308 patients with symptomatic severe RMS who underwent PMV as their initial treatment. The baseline clinical characteristics of the study population are presented in Table 1. The mean age was 50.7±13.2 years, and 250 (81.2%) patients were women. In all, 84 (27.3%) patients had a history of HTN and 29 (9.4%) patients had diabetes. AF was documented in 190 (61.7%) patients. Table 2 presents the echocardiographic data of the patients. The mean left ventricular ejection fraction (LVEF) was preserved at 61.7±7.9%, and the mean value of the Wilkins echo score was 7.11±1.27. As a hemodynamic echocardiographic factor, the mean MVA was 0.99±0.21 cm2, MDPG was 9.3±3.9 mmHg, and right ventricular systolic pressure (RVSP) was 39.1±13.8 mmHg before the procedure.
Table 1.
Baseline Characteristics of Patients Classified by PMV Results and ΔMVA
| |
Total
(n=308) |
OptimalA and ΔMVA
>0.5 cm2 (n=133) |
OptimalA but ΔMVA
≤0.5 cm2 (n=47) |
SuboptimalA
(n=128) |
P value |
| Demographic data |
| Age (years) |
50.69±13.19 |
46.14±12.13 |
54.53±11.49 |
54.01±13.46 |
<0.001 |
| Female sex |
250 (81.17) |
104 (78.2) |
40 (85.1) |
106 (82.8) |
0.479 |
| BMI (kg/m2) |
22.70±2.96 |
22.81±2.98 |
23.23±3.31 |
22.38±2.79 |
0.230 |
| Comorbidities |
| HTN |
84 (27.3) |
27 (20.3) |
15 (31.9) |
42 (32.8) |
0.056 |
| Diabetes |
29 (9.4) |
9 (6.8) |
5 (10.6) |
15 (11.7) |
0.352 |
| CKD |
6 (2.0) |
2 (1.5) |
1 (2.1) |
3 (2.3) |
0.877 |
| AF |
190 (61.7) |
69 (51.9) |
32 (68.1) |
89 (69.5) |
0.008 |
| Medication |
| AAD |
49 (15.9) |
20 (15.0) |
7 (14.9) |
22 (17.2) |
0.875 |
| Anticoagulant |
238 (77.3) |
94 (70.7) |
35 (74.5) |
109 (85.2) |
0.018 |
Unless indicated otherwise, data are given as the mean±SD or n (%). AThe optimal result of percutaneous mitral valvuloplasty was defined as a postprocedural mitral valve area (MVA) >1.5 cm2 without the development of mitral regurgitation greater than Grade II. If these criteria were not met, the result was considered suboptimal. AAD, antiarrhythmic drug; AF, atrial fibrillation; BMI, body mass index; CKD, chronic kidney disease; ΔMVA, the change in mitral valve area; HTN, hypertension; PMV, percutaneous mitral valvuloplasty.
Table 2.
Comparative Analysis of Echocardiographic Parameters Before and After PMV
| |
Total
(n=308) |
OptimalA and ΔMVA
>0.5 cm2 (n=133) |
OptimalA but ΔMVA
≤0.5 cm2 (n=47) |
SuboptimalA
(n=128) |
P value |
| Echocardiographic data |
| LVEF (%) |
61.73±7.93 |
61.91±7.29 |
62.60±7.19 |
61.22±8.82 |
0.590 |
| LAVI (mL/m2) |
71.34±30.25 |
66.77±23.81 |
73.86±47.50 |
75.03±26.99 |
0.110 |
| Echo score |
7.11±1.27 |
6.97±1.25 |
6.81±1.14 |
7.37±1.30 |
0.008 |
| Pre-MVA (cm2) |
0.99±0.21 |
0.97±0.18 |
1.26±0.13 |
0.91±0.19 |
<0.001 |
| Pre-MDPG (mmHg) |
9.32±3.86 |
9.78±3.70 |
7.30±3.26 |
9.60±4.01 |
<0.001 |
| Pre-RVSP (mmHg) |
39.11±13.77 |
37.75±11.70 |
34.80±11.44 |
42.11±15.83 |
0.004 |
| MR ≥ moderate |
0 (0.0) |
0 (0.0) |
0 (0.0) |
0 (0.0) |
1.000 |
| AR ≥ moderate |
22 (7.3) |
9 (6.9) |
6 (12.8) |
7 (5.7) |
0.260 |
| AS > moderate |
0 (0.0) |
0 (0.0) |
0 (0.0) |
0 (0.0) |
1.000 |
| TR ≥ moderate |
48 (16.0) |
16 (12.3) |
5 (10.6) |
27 (21.8) |
0.067 |
| ΔMVA (cm2) |
0.58±0.25 |
0.75±0.18 |
0.39±0.08 |
0.47±0.23 |
<0.001 |
| ΔMDPG (mmHg) |
4.78±3.71 |
5.78±3.46 |
3.57±2.89 |
4.16±4.00 |
<0.001 |
| ΔRVSP (mmHg) |
7.79±12.89 |
9.27±11.22 |
5.31±9.07 |
7.15±15.55 |
0.067 |
| Postprocedural MVA (cm2) |
1.58±0.25 |
1.73±0.17 |
1.65±0.12 |
1.38±0.25 |
<0.001 |
| Postprocedural MDPG (mmHg) |
4.46±1.74 |
4.00±1.29 |
3.83±1.16 |
5.23±2.07 |
<0.001 |
| Postprocedural RVSP (mmHg) |
31.55±13.32 |
28.94±11.14 |
29.74±7.18 |
35.08±16.23 |
0.003 |
Unless indicated otherwise, data are given as the mean±SD or n (%). AThe optimal result of percutaneous mitral valvuloplasty was defined as a postprocedural MVA >1.5 cm2 without the development of mitral regurgitation greater than Grade II. If these criteria were not met, the result was considered suboptimal. AR, aortic regurgitation; AS, aortic stenosis; LAVI, left atrial volume index; LVEF, left ventricular ejection fraction; MDPG, mean diastolic pressure gradient; MR, mitral regurgitation; RVSP, right ventricular systolic pressure; TR, tricuspid regurgitation. Other abbreviations as in Table 1.
Echocardiographic Changes Following PMV and Their Association With Pre-MVA
The echocardiographic data before and after the PMV procedure are summarized in Table 2. After PMV, the mean MVA of the study cohort increased from 0.99±0.21 to 1.58±0.25 cm2. The mean MDPG decreased from 9.3±3.9 to 4.5±1.7 mmHg, and RVSP decreased from 39.1±13.8 to 31.6±13.3 mmHg. The mean value of ∆MVA was 0.58±0.25 cm2, and the Shapiro-Wilk test indicated a normal distribution (P=0.936). Significant negative linear correlations were found between pre-MVA and ∆MVA (r=0.40, P<0.001) and pre-MVA and ∆MDPG (r=0.39, P<0.001), as shown in Figure 2. There was also a significant negative correlation between pre-MVA and ∆RVSP, but the strength of the relationship was weaker (r=0.20, P=0.001). In addition, the group with a pre-MVA of <1.0 cm2
had a significantly higher number of patients with a ∆MVA >0.5 cm2
compared with the group with a pre-MVA of 1.0–1.5 cm2
(118 [70.2%] vs. 59 [42.1%]; P<0.001; Supplementary Figure 1).

The optimal result was achieved in 180 (58.4%) patients. Supplementary Table 1 presents the characteristics of patients classified by PMV result (optimal vs. suboptimal). Patients in the suboptimal group were older (P<0.001) and had a higher prevalence of AF (P=0.023) than those in the optimal group. However, no significant differences were found between the 2 groups in terms of sex, body mass index, or other comorbidities, such as HTN, diabetes, and CKD. Regarding echocardiographic data, the optimal group had a larger ∆MVA (0.66±0.23 vs. 0.48±0.23 cm2; P<0.001) and a larger post-MVA (1.71±0.16 vs. 1.38±0.25 cm2; P<0.001) than the suboptimal group. The Wilkins echo score in the suboptimal group was significantly higher than in the optimal group (7.37±1.30 vs. 6.93±1.22; P=0.003). Tricuspid regurgitation of moderate or greater severity was more common in the suboptimal group (P=0.031). However, other parameters, including LVEF and the condition of other valves, did not show significant differences between the groups.
Impact of ∆MVA on Clinical Outcomes
During the median follow-up of 92.3 months (interquartile range 43.9–158.1 months), 89 patients (28.9%) had adverse composite outcomes: 56 (18.2%) underwent MV reintervention, 9 (2.9%) were admitted because of HF, 16 (5.2%) experienced a stroke, and 8 (2.6%) died. The incidence rate of composite outcomes was lower in the optimal than suboptimal result group (19.4% vs. 42.2%, respectively; P<0.001). Kaplan-Meier analysis showed that patients with optimal results had a higher probability of event-free survival for composite outcomes than patients with suboptimal results (log-rank P<0.001; Supplementary Figure 2).
The clinical and echocardiographic data for the 2 groups, categorized based on the ∆MVA cut-off value of 0.5 cm², are presented in Supplementary Table 2. Patients with a ∆MVA ≤0.5 cm2
were older (56.4±12.3 vs. 46.5±12.2 years; P<0.001), had a higher prevalence of AF (70.2% vs. 55.4%; P=0.011), and showed larger pre-MVA (1.07±0.22 vs. 0.93±0.19 cm2; P<0.001) and lower pre-MDPG (8.2±3.6 vs. 10.1±3.9 mmHg; P<0.001) than those with a ∆MVA >0.5 cm2.
Next, we maintained the suboptimal group as initially defined and further subdivided the optimal group using a ∆MVA threshold of 0.5 cm2, thus establishing 3 distinct groups. The baseline characteristics in all 3 groups are presented in Table 1. Patients who achieved optimal results and had a ∆MVA >0.5 cm2
were younger and had fewer comorbidities, such as HTN, diabetes, CKD, and AF, than patients in the other groups. However, these differences were not statistically significant, except for those regarding age (P<0.001) and AF (P=0.008), both of which differed significantly between the groups. No significant differences were found in the use of antiarrhythmic drugs among the 3 groups (P=0.875). In contrast, the use of anticoagulants differed significantly (P=0.018). The Scheffé test for multiple comparisons revealed that anticoagulant usage was significantly different between the optimal and ∆MVA >0.5 cm2
group and the suboptimal group (F-ratio: 3.402, P=0.035). Among the 3 groups, the echo score was significantly higher in the suboptimal group (P=0.008). However, there were no appreciable differences in LVEF, LA volume index, or the conditions of the other valves before PMV (Table 2).
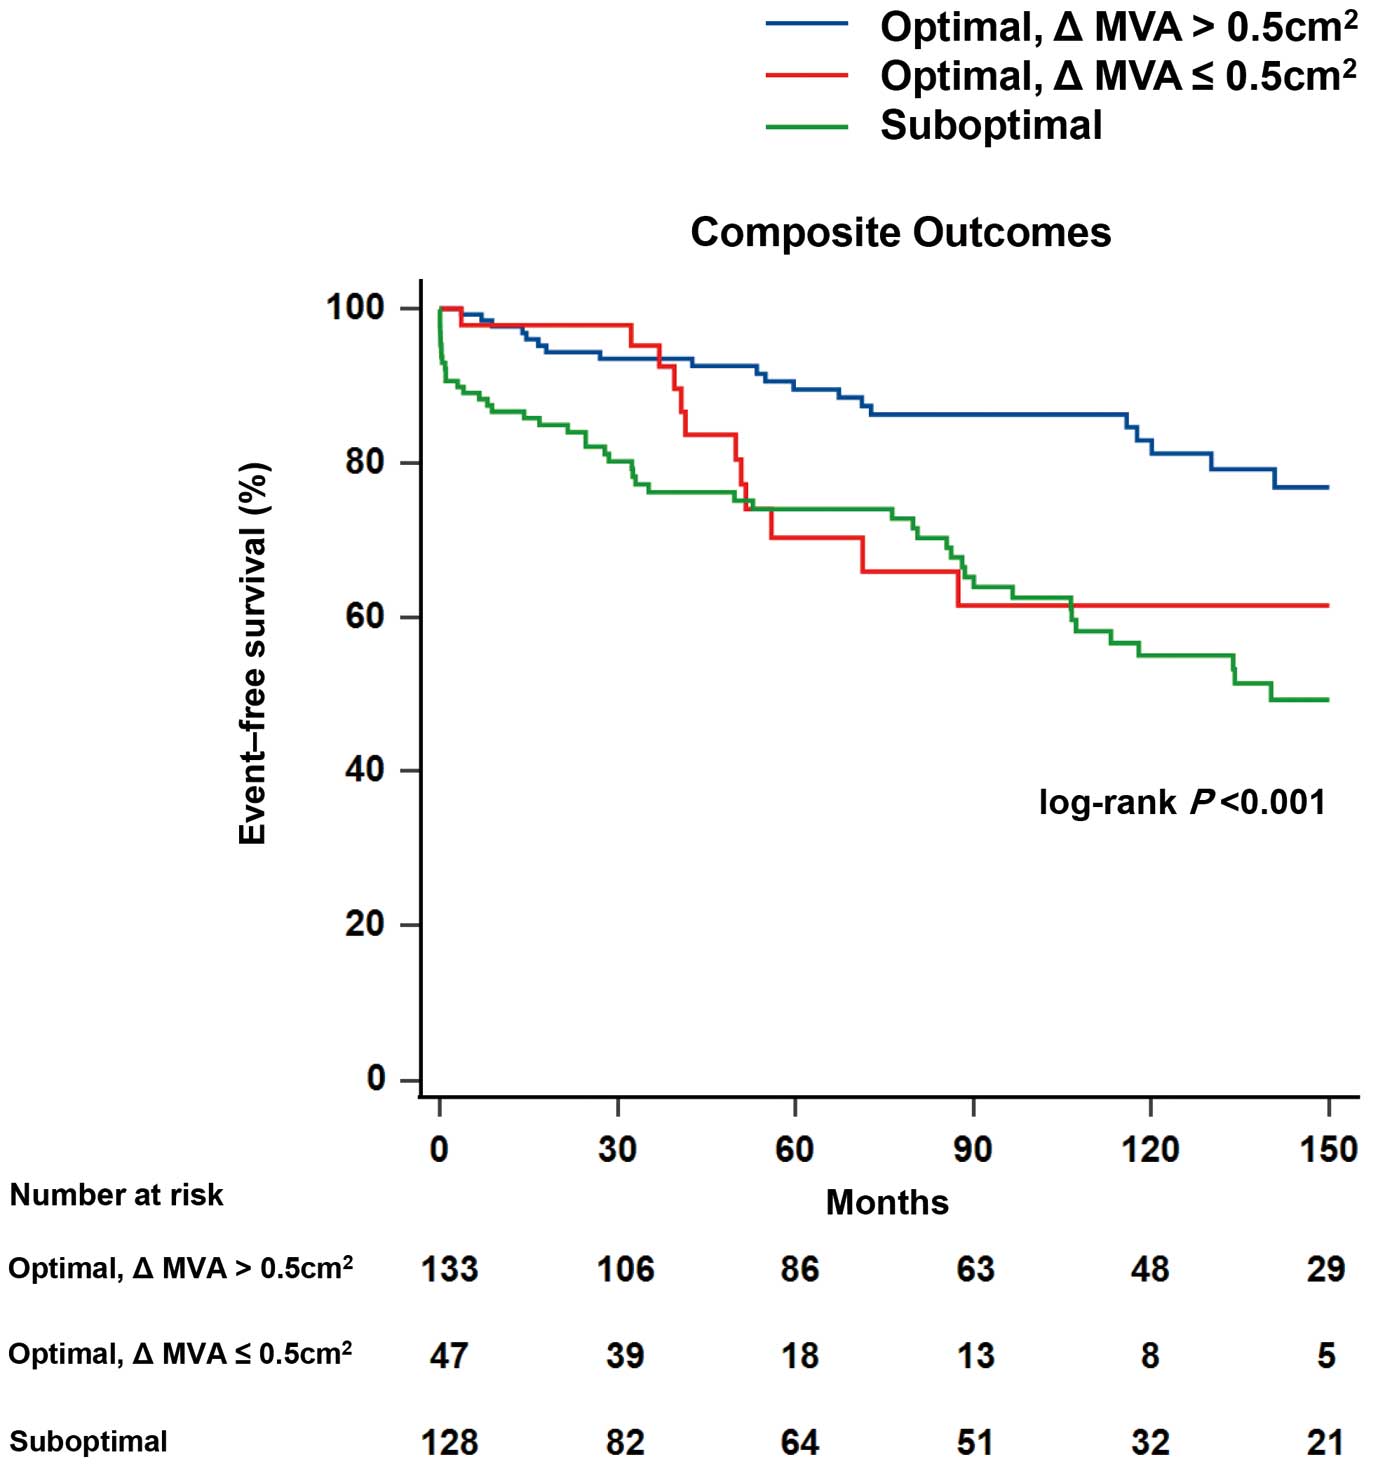
Figure 3 shows the Kaplan-Meier curve analysis results for the 3 groups. The cumulative incidence of the composite outcomes was lowest in the optimal result and ∆MVA >0.5 cm2
group (log-rank P<0.001). Comparative results of the cumulative incidence for each contributing event to the composite outcomes in the 3 groups are presented in Supplementary Figure 3. MV reintervention was found to be more common in the suboptimal group than in the other 2 groups (log-rank P<0.001). In comparison, stroke incidence was significantly higher in the optimal results and ∆MVA ≤0.5 cm2
group (log-rank P=0.033). No significant differences were observed between the groups in terms of hospitalization for HF (log-rank P=0.294) and all-cause mortality (log-rank P=0.966).
Based on univariate Cox regression analysis, several factors were found to be significantly associated with poorer outcomes (Table 3). These included older age (P<0.001), the presence of comorbid conditions such as HTN (P=0.003), diabetes (P=0.001), and AF (P<0.001), and a higher echo score (P<0.001). Conversely, both achieving an optimal result (P=0.001) and having a ∆MVA >0.5 cm2
(P<0.001) were found to be significantly associated with a reduced risk of composite outcomes. The results of the nested Cox proportional hazard regression analysis adjusted for clinical factors (Table 4) showed that the risk of composite outcomes in the suboptimal group was higher than that in the optimal results and ∆MVA >0.5 cm2
group (hazard ratio [HR] 2.43; 95% confidence interval [CI] 1.38–4.28; P=0.002). Interestingly, even with the optimal result, patients with a ∆MVA ≤0.5 cm2
had a 2.18-fold higher risk of composite outcomes than those with a ∆MVA >0.5 cm2
(Model 1; HR 2.18; 95% CI 1.06–4.48; P=0.033). Furthermore, in subsequent multivariate models, it was consistently observed that patients in the group with optimal results but ∆MVA ≤0.5 cm2
had a significant association with worse composite outcomes than those with optimal results and ∆MVA >0.5 cm2
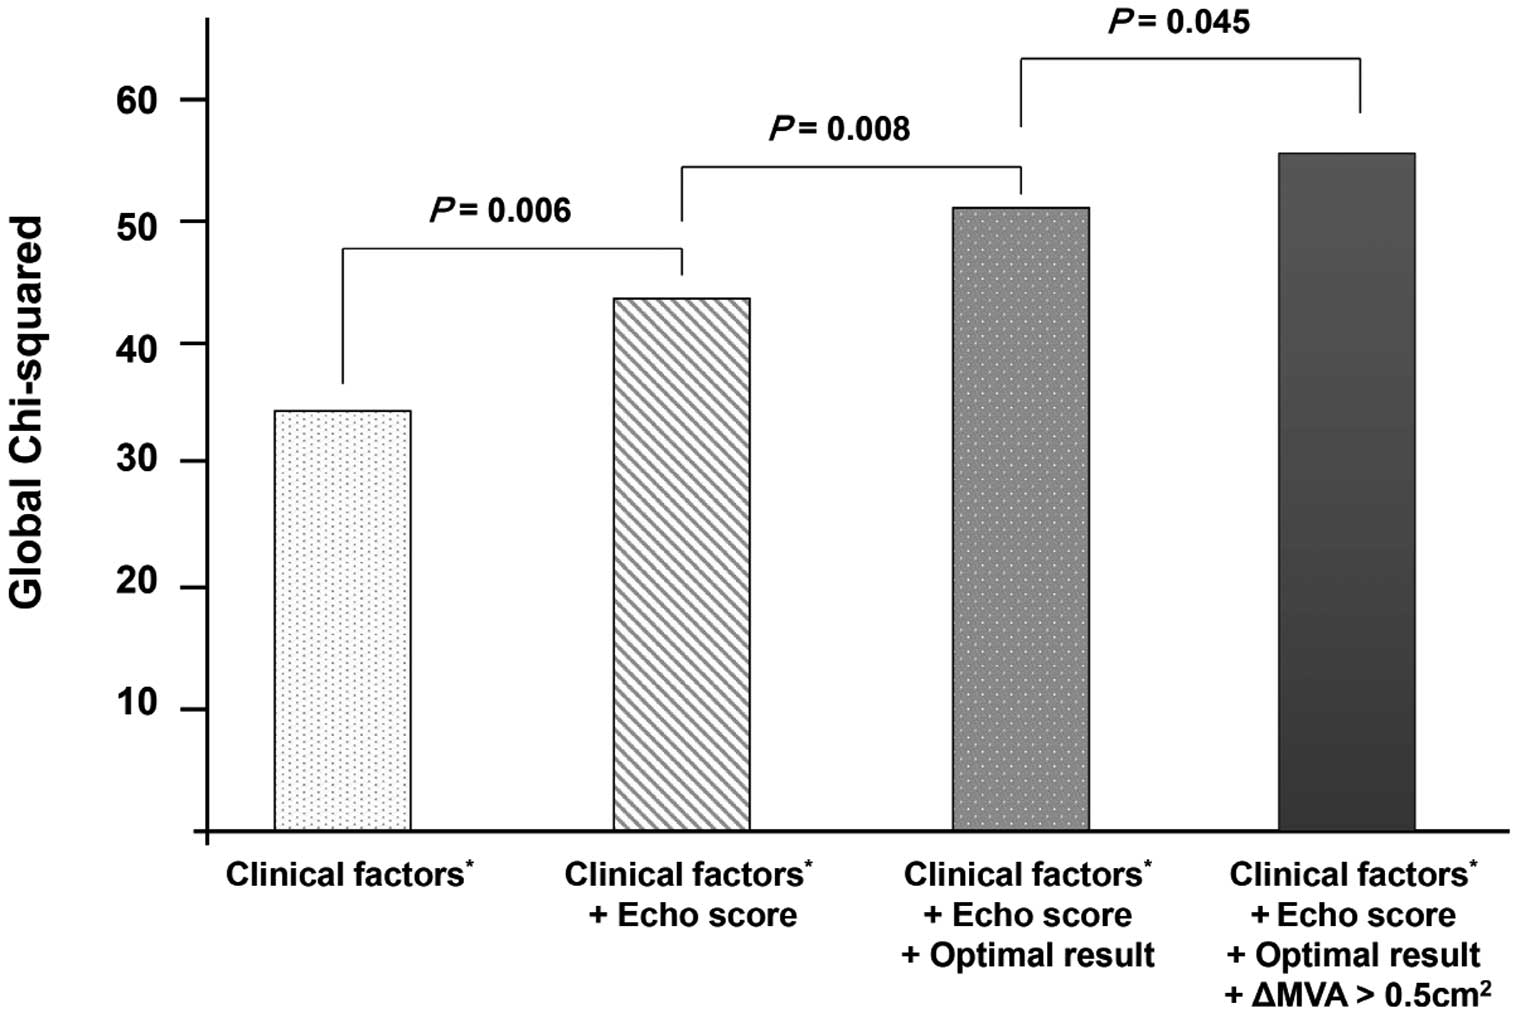
(Model 2: HR 2.15, 95% CI 1.04–4.45, P=0.038; Model 3: HR 2.27, 95% CI 1.09–473, P=0.028). In addition, we performed a global Chi-squared analysis (Figure 4) with adjustments for clinical factors such as age, HTN, diabetes, and AF and the subsequent integration of echo score, PMV results, and ∆MVA in order to determine the incremental prognostic importance of ∆MVA with regard to composite outcomes. The results indicated that ∆MVA provided additional incremental prognostic value beyond the traditional optimal result (global Chi-squared increased from 51.8 to 54.6; P=0.045).
Table 3.
Univariate Cox Regression Analysis Assessing Risk Factors for Long-Term Composite Outcomes
| Variables |
Univariate |
| HR |
95% CI |
P value |
| Demographic data |
| Age |
1.06 |
1.03–1.08 |
<0.001 |
| Female sex |
1.02 |
0.58–1.77 |
0.953 |
| BMI |
0.98 |
0.87–1.10 |
0.676 |
| Comorbidities |
| HTN |
2.02 |
1.27–3.22 |
0.003 |
| Diabetes |
2.55 |
1.44–4.54 |
0.001 |
| CKD |
2.13 |
0.77–5.89 |
0.146 |
| AF |
3.92 |
2.18–7.07 |
<0.001 |
| Echocardiographic data |
| LVEF |
0.98 |
0.96–1.01 |
0.269 |
| LAVI |
1.01 |
1.00–1.02 |
0.076 |
| Echo score |
1.37 |
1.16–1.62 |
<0.001 |
| Optimal resultA |
0.36 |
0.23–0.55 |
0.001 |
| ΔMVA >0.5 cm2 |
0.41 |
0.27–0.64 |
<0.001 |
AThe optimal result of percutaneous mitral valvuloplasty was defined as a postprocedural MVA >1.5 cm2 without the development of mitral regurgitation greater than Grade II. If these criteria were not met, the result was considered suboptimal. CI, confidence interval; HR, hazard ratio. Other abbreviations as in Tables 1,2.
Table 4.
Nested Analysis for Risk Factors of Composite Outcomes
| |
Model 1 |
Model 2 |
Model 3 |
| HR (95% CI) |
P value |
HR (95% CI) |
P value |
HR (95% CI) |
P value |
| Result of PMV |
| OptimalA and ΔMVA >0.5 cm2 |
Reference |
|
Reference |
|
Reference |
|
| OptimalA but ΔMVA ≤0.5 cm2 |
2.18 (1.06–4.48) |
0.033 |
2.15 (1.04–4.45) |
0.038 |
2.27 (1.09–4.73) |
0.028 |
| SuboptimalA |
2.43 (1.38–4.28) |
0.002 |
2.42 (1.39–4.21) |
0.002 |
2.35 (1.35–4.07) |
0.002 |
AThe optimal result of percutaneous mitral valvuloplasty was defined as a postprocedural MVA >1.5 cm2 without the development of mitral regurgitation greater than Grade II. If these criteria were not met, the result was considered suboptimal. Model 1 adjusted for clinical factors (age, HTN and AF); Model 2 adjusted for clinical factors and the echo score; and Model 3 adjusted for clinical factors, echo score, and medication (AADs, anticoagulants). Other abbreviations as in Tables 1,3.
Discussion
The main findings of this study are as follows. We focused on ∆MVA during PMV and discovered that, on average, PMV can increase the MVA by 0.58±0.25 cm2
in real-world clinical settings. There was a significant negative linear association between pre-MVA and ∆MVA, such that patients with a pre-MVA ≤1.0 cm2
experienced a greater change in valve area after PMV. Beyond the traditional criteria for optimal PMV outcomes, defined as post-PMV MVA >1.5 cm2
and MR of grade II or less, patients with a ∆MVA >0.5 cm2
had a significantly lower incidence of composite outcomes. The cumulative incidence analysis for each event showed a greater rate of MV reintervention in the suboptimal group. This is thought to be because patients who did not achieve sufficient ∆MVA or developed severe MR after PMV could not show symptom improvements and therefore required additional valve interventions. Interestingly, the incidence of stroke was highest not in the suboptimal group, but in the optimal and ∆MVA ≤0.5 cm2
group. Despite no statistically significant difference in anticoagulant use between the optimal but ∆MVA ≤0.5 cm2
group and the suboptimal group, the reported outcomes may be attributed to the “washing machine effect” of MR in the LA, potentially reducing the occurrence of thromboembolic events. In our study, the suboptimal group included patients who experienced moderate or greater MR, and the optimal and ∆MVA ≤0.5 cm2
group consisted of patients who did not achieve sufficient ∆MVA and did not have significant MR. A previous study on a small series of patients with non-rheumatic AF suggested a potential protective role of MR against stroke.25 Another study reported that patients with significant MR, as observed during transesophageal echocardiography, exhibited less spontaneous echo contrast related to thrombus formation and had fewer strokes and transient ischemic attacks.26 These factors may contribute to a higher incidence of stroke in the optimal and ∆MVA ≤0.5 cm2
group compared with the other groups. Thus, our findings suggest that achieving an optimal result and ∆MVA >0.5 cm2
are important for reducing composite outcomes, particularly MV reintervention and stroke.
The current guidelines emphasize the importance of anatomical features such as valve morphology and valve area, which reflect disease progression, when assessing the severity of RMS. In addition, parameters including RVSP are used as indicators to assess hemodynamic consequences.9,10 Our previous study showed that RVSP, a hemodynamic prognostic factor, >40 mmHg is associated with a poor prognosis through trajectory analysis of patients with MS and an MVA between 1.0 and 1.5 cm2.27 However, in the present study, RVSP did not show a significant association with any outcome. The mean RVSP before the PMV procedure was 39.1±13.8 mmHg, indicating mild pulmonary HTN. However, after PMV, all groups showed a decrease in RVSP, suggesting that the pressure-reducing effect of the procedure may have mitigated any significant association between RVSP and prognosis.
To the best of our knowledge, this is the first study to evaluate the importance of ∆MVA among patients with severe RMS who underwent PMV. The guidelines recommend PMV for patients with symptomatic severe RMS and favorable valve morphology.9,10 The only available balloon system for RMS is the Inoue balloon, made of strong yet pliant natural rubber. This was used to inflate the narrowed MV, particularly fibro-thickened leaflets and fused commissure.6 Those with optimal PMV results had a better prognosis, which is consistent with previous studies that emphasized the importance of achieving optimal results.11,14,15 Only 13 patients (1.8% of the total) required valve replacement because of acute severe MR following the procedure. This finding indicates that PMV is a relatively safe procedure for patients with RMS.
Although the current PMV procedure using the Inoue balloon has demonstrated safety and modest efficacy, there are several limitations. First, there is a lack of sophisticated preplanning analysis for the PMV procedure. The MV opening area, annulus size, calcification, and subvalvular structure have been evaluated to assess procedure eligibility, but not balloon sizing or target MVA during the procedure. This limitation is partly because of the lack of advanced 3-dimensional (3D) imaging analysis, such as 3D computed tomography, which is commonly used in recent structural heart disease procedures. Accurate evaluation of the MR mechanism through 3D imaging is essential for determining the appropriate type of MV surgery.28 In the same way, it may be necessary to use 3D imaging technology for a thorough evaluation of RMS to ensure successful intervention. Another important reason is that a limited number of balloon sizes are available, making it challenging to customize treatment based on the characteristics of the MV in each patient. The size of the balloon is selected based on the patient’s height, weight, and body surface area; however, MV opening area and annulus size do not always correlate with these parameters. Furthermore, owing to the inherent limitations of balloon valvuloplasty, the post-balloon valve area cannot be accurately predicted. This lack of clarity in preplanning and procedural determination has led to the absence of a specific target in ∆MVA for PMV. As a result, procedures have been performed with the uniform goal of achieving an MVA >1.5 cm2
in most cases. This approach led to patients with a pre-MVA <1.0 cm2
experiencing a greater change in valve area after PMV; however, a similar change was not observed in those with an MVA between 1.0 and 1.5 cm2.
A crucial consideration is whether, beyond merely achieving an MVA >1.5 cm2, a significant increase in ∆MVA would contribute to improved prognosis for patients with RMS after PMV. This study clearly demonstrated that patients with optimal results (post-MVA >1.5 cm2
without developing MR greater than Grade II) but with a ∆MVA ≤0.5 cm2
experienced significantly higher composite outcomes compared to those who achieved optimal results and a ∆MVA >0.5 cm2. The risk for these patients was comparable to those with suboptimal outcomes. In the previous prospective Mitral Intervention vs Conventional Management in Asymptomatic Mitral Stenosis (MITIGATE) trial, early PMV did not significantly reduce cardiovascular outcomes compared with conventional treatment among asymptomatic patients with severe RMS.29 The mean pre-MVA of patients who received early PMV (1.22±0.13 cm2) was similar to the pre-MVA of patients who had a poor prognosis despite having optimal results (optimal result but ∆MVA ≤0.5 cm2; 1.26±0.13 cm2) in our study (Table 2). In addition, the ∆MVA at follow-up was only 0.35±0.34 cm2
compared with the baseline value of the early PMV group in the MITIGATE trial. This finding further underscores the importance of achieving a greater ∆MVA during the PMV procedure. To achieve a significant ∆MVA (e.g., >0.5 cm2), merely using a larger balloon is insufficient, because it could increase procedural complications, such as significant MR. It is essential to meticulously assess MV anatomy and predict postprocedural outcomes using procedural simulations aided by 3D computed tomography and echocardiography. Moreover, improving the decades-old balloon system and adopting more predictable and state-of-the-art procedures, such as transcatheter mitral valve replacement, are imperative for patients with RMS.
Study Limitations
Our study has certain limitations, including its retrospective and observational nature, which may introduce referral or selection bias. In addition, because the results are based on data from patients with severe RMS who had symptoms and were referred to university hospitals, they cannot be generalized to all patients with severe RMS. Another limitation is that pre- and post-MVA were assessed using planimetry rather than pressure half-time. However, this was because nearly half the study patients had AF, and pressure half-time would incorrectly estimate the MVA in this population. Furthermore, less attention was paid to certain hemodynamic echocardiographic parameters, such as MDPG or RVSP. However, these measurements may not provide a comprehensive evaluation of the effectiveness of PMV, because they can be affected by factors such as heart rate or anemia. The study also focused on a relatively small group of patients, particularly within the subgroup demonstrating optimal result but with a ∆MVA ≤0.5 cm2, which consisted of only 47 patients. Given the small sample size, the results of this study should be interpreted with caution, because they may not fully represent the overall RMS patient population.
Conclusions
Achieving an increase in ΔMVA >0.5 cm2
during PMV can improve prognosis in patients with RMS; this could be recommended as an objective during PMV, in addition to the traditional optimal targets. Future research should focus on improving preprocedural planning and developing an advanced balloon system to achieve better outcomes in patients with RMS undergoing PMV while minimizing procedural complications.
Acknowledgment
The authors thank Jinseob Kim (Zarathu, Seoul, Republic of Korea) for providing statistical advice regarding data analysis.
Disclosures
The authors report no conflicts of interest with respect to this manuscript.
IRB Information
This study was approved by the Yonsei Medical Center Institutional Review Board (IRB approval no. 2021-0979-001).
Supplementary Files
Please find supplementary file(s);
https://doi.org/10.1253/circj.CJ-23-0552
References
- 1.
Sud K, Agarwal S, Parashar A, Raza MQ, Patel K, Min D, et al. Degenerative mitral stenosis: Unmet need for percutaneous interventions. Circulation 2016; 133: 1594–1604.
- 2.
Vos T, Lim SS, Abbafati C, Abbas KM, Abbasi M. Global burden of 369 diseases and injuries in 204 countries and territories, 1990–2019: A systematic analysis for the Global Burden of Disease Study 2019. Lancet 2020; 396: 1204–1222.
- 3.
Choi YJ, Son JW, Kim EK, Kim IC, Kim HY, Seo JS, et al. Epidemiologic profile of patients with valvular heart disease in Korea: A nationwide hospital-based registry study. J Cardiovasc Imaging 2022; 31: 51–61.
- 4.
Watkins DA, Johnson CO, Colquhoun SM, Karthikeyan G, Beaton A, Bukhman G, et al. Global, regional, and national burden of rheumatic heart disease, 1990–2015. N Engl J Med 2017; 377: 713–722.
- 5.
Chandrashekhar Y, Westaby S, Narula J. Mitral stenosis. Lancet 2009; 374: 1271–1283.
- 6.
Inoue K, Owaki T, Nakamura T, Kitamura F, Miyamoto N. Clinical application of transvenous mitral commissurotomy by a new balloon catheter. J Thorac Cardiovasc Surg 1984; 87: 394–402.
- 7.
Reyes VP, Raju BS, Wynne J, Stephenson LW, Raju R, Fromm BS, et al. Percutaneous balloon valvuloplasty compared with open surgical commissurotomy for mitral stenosis. N Engl J Med 1994; 331: 961–967.
- 8.
Turi ZG, Reyes VP, Raju BS, Raju AR, Kumar DN, Rajagopal P, et al. Percutaneous balloon versus surgical closed commissurotomy for mitral stenosis: A prospective, randomized trial. Circulation 1991; 83: 1179–1185.
- 9.
Members WC, Otto CM, Nishimura RA, Bonow RO, Carabello BA, Erwin JP, et al. 2020 ACC/AHA guideline for the management of patients with valvular heart disease: A report of the American College of Cardiology/American Heart Association Joint Committee on Clinical Practice Guidelines. J Am Coll Cardiol 2021; 77: 450–500.
- 10.
Vahanian A, Beyersdorf F, Praz F, Milojevic M, Baldus S, Bauersachs J, et al. 2021 ESC/EACTS guidelines for the management of valvular heart disease: Developed by the Task Force for the management of valvular heart disease of the European Society of Cardiology (ESC) and the European Association for Cardio-Thoracic Surgery (EACTS). Eur J Cardiothorac Surg 2021; 60: 727–800.
- 11.
Kim D, Chung H, Nam JH, Park DH, Shim CY, Kim JS, et al. Predictors of long-term outcomes of percutaneous mitral valvuloplasty in patients with rheumatic mitral stenosis. Yonsei Med J 2018; 59: 273–278.
- 12.
Orrange SE, Kawanishi DT, Lopez BM, Curry SM, Rahimtoola SH. Actuarial outcome after catheter balloon commissurotomy in patients with mitral stenosis. Circulation 1997; 95: 382–389.
- 13.
Iung B, Garbarz E, Michaud P, Helou S, Farah B, Berdah P, et al. Late results of percutaneous mitral commissurotomy in a series of 1024 patients. Analysis of late clinical deterioration: Frequency, anatomic findings, and predictive factors. Circulation 1999; 99: 3272–3278.
- 14.
Iung B, Garbarz E, Michaud P, Fondard O, Helou S, Kamblock J, et al. Immediate and mid-term results of repeat percutaneous mitral commissurotomy for restenosis following earlier percutaneous mitral commissurotomy. Eur Heart J 2000; 21: 1683–1689.
- 15.
Wang A, Krasuski RA, Warner JJ, Pieper K, Kisslo KB, Bashore TM, et al. Serial echocardiographic evaluation of restenosis after successful percutaneous mitral commissurotomy. J Am Coll Cardiol 2002; 39: 328–334.
- 16.
Hernandez R, Banuelos C, Alfonso F, Goicolea J, Ortiz AF, Escaned J, et al. Long-term clinical and echocardiographic follow-up after percutaneous mitral valvuloplasty with the Inoue balloon. Circulation 1999; 99: 1580–1586.
- 17.
Baumgartner H, Hung J, Bermejo J, Chambers JB, Evangelista A, Griffin BP, et al. Echocardiographic assessment of valve stenosis: EAE/ASE recommendations for clinical practice. Eur J Echocardiogr 2009; 10: 1–25.
- 18.
Nishimura RA, Otto CM, Bonow RO, Carabello BA, Erwin JP, Guyton RA, et al. 2014 AHA/ACC guideline for the management of patients with valvular heart disease: Executive summary. A Report of the American College of Cardiology/American Heart Association Task Force on Practice Guidelines. Circulation 2014; 129: 2440–2492.
- 19.
Von Elm E, Altman DG, Egger M, Pocock SJ, Gøtzsche PC, Vandenbroucke JP. The Strengthening the Reporting of Observational Studies in Epidemiology (STROBE) statement: Guidelines for reporting observational studies. Lancet 2007; 370: 1453–1457.
- 20.
Lang RM, Badano LP, Mor-Avi V, Afilalo J, Armstron A, Ernande L, et al. Recommendations for cardiac chamber quantification by echocardiography in adults: An update from the American Society of Echocardiography and the European Association of Cardiovascular Imaging. J Am Soc Echocardiogr 2015; 28: 1–39.e14.
- 21.
Baumgartner H, Hung J, Bermejo J, Chambers JB, Evangelista A, Griffin BP, et al. Echocardiographic assessment of valve stenosis: EAE/ASE recommendations for clinical practice. J Am Soc Echocardiogr 2009; 22(1): 1–23.
- 22.
Silbiger JJ. Advances in rheumatic mitral stenosis: Echocardiographic, pathophysiologic, and hemodynamic considerations. J Am Soc Echocardiogr 2021; 34: 709–722.e1.
- 23.
Wilkins GT, Weyman AE, Abascal VM, Block PC, Palacios IF. Percutaneous balloon dilatation of the mitral valve: An analysis of echocardiographic variables related to outcome and the mechanism of dilatation. Heart 1988; 60: 299–308.
- 24.
Iung B, Cormier B, Ducimetiere P, Porte JM, Nallet O, Michel PL, et al. Immediate results of percutaneous mitral commissurotomy: A predictive model on a series of 1514 patients. Circulation 1996; 94: 2124–2130.
- 25.
Nakagami H, Yamamoto K, Ikeda U, Mitsuhashi T, Goto T, Shimada K. Mitral regurgitation reduces the risk of stroke in patients with nonrheumatic atrial fibrillation. Am Heart J 1998; 136: 528–532.
- 26.
Movsowitz C, Movsowitz HD, Jacobs LE, Meyerowitz CB, Podolsky LA, Kotler MN. Significant mitral regurgitation is protective against left atrial spontaneous echo contrast and thrombus as assessed by transesophageal echocardiography. J Am Soc Echocardiogr 1993; 6: 107–114.
- 27.
Ko KY, Cho I, Kim S, Seong Y, Kim DY, Seo J, et al. Identification of distinct subgroups in moderately severe rheumatic mitral stenosis using data-driven phenotyping of longitudinal hemodynamic progression. J Am Heart Assoc 2022; 11: e026375.
- 28.
de Groot-de Laat LE, McGhie J, Ren B, Frowijn R, Oei FB, Geleijnse ML. A modified echocardiographic classification of mitral valve regurgitation mechanism: The role of three-dimensional echocardiography. J Cardiovasc Imaging 2019; 27: 187–199.
- 29.
Kang DH, Park SJ, Lee SA, Lee S, Kim DH, Park DW, et al. Early percutaneous mitral commissurotomy or conventional management for asymptomatic mitral stenosis: A randomised clinical trial. Heart 2021; 107: 1980–1986.