Abstract
Background: Deviations of hemoglobin from normal levels may be a factor in cardiovascular disease (CVD) risk; however, conclusive evidence is lacking. In addition, preclinical conditions may influence hemoglobin concentrations, but studies focusing on reverse causation are limited. Thus, we examined the relationship between hemoglobin concentrations and CVD mortality risk, considering reverse causation.
Methods and Results: In a prospective cohort representative of the general Japanese population (1990–2015), we studied 7,217 individuals (mean age 52.3 years; 4,219 women) without clinical CVD at baseline. Participants were categorized into sex-specific hemoglobin quintiles (Q1–Q5) and data were analyzed using the Cox proportional hazards model adjusted for possible confounders. During a 25-year follow-up, 272 men and 334 women died from CVD. Adjusted hazard ratios for CVD mortality across sex-specific quintiles, using Q3 as the reference, were significantly higher for Q1 (1.40; 95% confidence interval [CI] 1.08–1.82) and Q5 (1.49; 95% CI 1.14–1.96), and remained significant after excluding deaths within the first 5 years of follow-up to consider reverse causation (1.35 [95% CI 1.02–1.79] and 1.45 [95% CI 1.09–1.94], respectively). A similar U-shaped association was seen between transferrin saturation levels and CVD mortality, but after excluding deaths within the first 5 years the association was significant only for Q1.
Conclusions: Low and high hemoglobin concentrations were associated with an increased risk of CVD mortality.
Cardiovascular disease (CVD) is a primary cause of mortality worldwide.1 In Japan, despite the implementation of various measures, heart disease ranks as the second leading cause of death, followed by stroke in fourth position.2 Therefore, new cardiovascular risk factors need to be identified to improve CVD prevention.
Numerous studies have reported an association between low hemoglobin concentrations or anemia and an increased CVD risk in the general population.3–6 Mechanistically, prolonged anemia can potentially lead to ventricular dilation, left ventricular hypertrophy, and the development of compensatory arterial stiffening.6,7 In contrast, only limited studies have focused on the association between high hemoglobin concentrations and increased CVD risk.8–10 The mechanism by which high hemoglobin concentrations increase CVD risk involves increased blood viscosity,11,12 platelet activation,13 and oxidative stress caused by the excessive accumulation of iron, which is a constituent component of hemoglobin, ultimately resulting in the development of atherosclerosis.14 In addition, when considering the potential influence of preclinical or clinical conditions on hemoglobin concentration,15–18 there is a need to account for reverse causation. However, reports conducting analyses inclusive of reverse causation are limited. Furthermore, the association between the amount of iron in the body, a component of hemoglobin, and CVD has been studied based on Sullivan’s hypothesis from 1981, which proposed that the higher incidence of heart disease in men and postmenopausal women compared with premenopausal women is because of differences in body iron stores.19 However, evidence regarding the association of body iron levels with CVD risk remains inconclusive.14,20–22
The National Integrated Project for Prospective Observation of Noncommunicable Disease and its Trends in the Aged in 1990 (NIPPON DATA90) enrolled men and women aged ≥30 years from across Japan. The hemoglobin concentrations of participants were measured, and participants were followed up to assess cause-specific mortality for 25 years; therefore, NIPPON DATA90 provides a unique opportunity to investigate the association between hemoglobin concentrations and the risk of CVD mortality, while also taking reverse causation into account. Thus, in the present study, we used NIPPON DATA90 to examine the relationship between hemoglobin concentrations and CVD mortality risk, considering reverse causation.
Methods
Study Participants
The baseline survey of NIPPON DATA90 was conducted in 1990. Details of the studies have been reported elsewhere.23–25 In all, 8,383 residents aged 30 years (3,504 men, 4,879 women) were randomly selected from 300 districts in the survey area. Of the 8,383 participants, 1,166 individuals were excluded for the following reasons (some participants met more than 1 exclusion criterion): a history of CVD (myocardial infarction, stroke, and angina; n=371); data lacking for specific parameters, such as hemoglobin, hypertension, and smoking history (n=668); and loss to follow-up due to incomplete residential address at the baseline survey (n=182). Finally, the analysis included 7,217 participants (2,998 men, 4,219 women). The requirement for informed consent was waived because of the voluntary participation of community dwellers in the national surveys and the anonymous nature of the data for the analysis. The present study was approved by the Institutional Review Board of Shiga University of Medical Science (Approval no. R2005-021).
Baseline Examinations
In the baseline survey in 1990, physical examinations, blood tests, and medical history interviews were conducted.23 The survey was performed using a standardized manual in the National Survey on Circulatory Disorders of Japan. Trained health nurses measured baseline blood pressure using a standard mercury sphygmomanometer on the right arm of seated participants. Non-fasting blood samples were collected from all participants. Body mass index (BMI) was calculated as weight (kg) divided by height squared (m2). Blood hemoglobin concentrations were measured using the oxyhemoglobin method. Serum creatinine (SCr) data were converted from the alkaline picrate method (Jaffe method) to the enzymatic method using the following formula:
SCr (enzymatic method) = SCr (Jaffe method) + 0.2 mg/dL
Estimated glomerular filtration rate (eGFR) was calculated using the method proposed by the Japanese CKD Working Group26 as follows:
eGFR (mL/min/1.73 m2) = 194 × SCr−1.094 (enzymatic method) × age−0.287 × 0.739 (for women)
We defined hypertension as systolic blood pressure ≥140 mmHg, diastolic blood pressure ≥90 mmHg, or the use of antihypertensive medication. Diabetes was defined as a non-fasting blood glucose concentration of ≥200 mg/dL, HbA1c (National Glycohemoglobin Standardization Program) ≥6.5%, or a history of diabetes. Regarding iron indices, we used transferrin saturation (TSAT), which is commonly used in clinical fields. TSAT was calculated using the following formula:
TSAT (%) = (serum iron/TIBC) × 100
where TIBC is total iron-binding capacity. Serum iron concentrations and TIBC were measured using the bathophenanthroline method. Smoking status was categorized as never, past, current (<20 cigarettes/day), or current (≥20 cigarettes/day). Alcohol consumption was categorized as never, past, or current. Exercise status was categorized as no exercise for health reasons, no exercise for reasons other than health, or regular exercise. Dietary iron intake was obtained from the weighing record method for 3 consecutive days.27
Follow-up
We identified deaths every 5 years until 2015 using the National Vital Statistics Database with permission from the Japanese Ministry of Internal Affairs and Communications. The collected information included participants’ place of residence and cause of death. Causes of death were categorized uniformly according to the International Classification of Diseases, 9th edition (ICD-9) until the end of 1994; from the beginning of 1995, they were classified according to the International Classification of Diseases, 10th edition (ICD-10). Deaths from all CVD (ICD-9: codes 393–459, ICD-10: codes I00–I99) and death from all cancer (ICD-9: codes 140–208, ICD-10: codes C00–D48) were confirmed. Deaths from CVD included heart disease and stroke. The codes used for cause-specific CVD were as follows: coronary artery disease (CAD), 410–414 (ICD-9) and I20–I25 (ICD-10); stroke, 430–438 (ICD-9) and I60–I69 (ICD-10); cerebral infarction, 433 and 434 (ICD-9) and I61 and I69.3 (ICD-10); and cerebral hemorrhage, 431 and 432 (ICD-9) and I63 and I69.1 (ICD-10).
Statistical Analysis
Hemoglobin concentrations differ significantly by sex. Therefore, we categorized the data using sex-specific quintiles (Q1–Q5), after confirming that there was no statistically significant sex interaction on the association between quintiles of hemoglobin concentrations and CVD mortality risk. We created histograms of hemoglobin concentrations separately for men and women. Q1 was set as the lowest level and Q5 was set as the highest level. The significance of differences in baseline characteristics among individuals classified into hemoglobin quintiles was calculated using analysis of variance (ANOVA) for continuous variables and Chi-squared tests for categorical variables.
The outcome of this study was death from CVD during the follow-up period. The relationship between hemoglobin and this outcome was evaluated using Cox proportional hazards models. Because previous studies have described a U-shaped association between hemoglobin and CVD mortality, Q3 was chosen as the reference.8 First, hazard ratios (HRs) were adjusted for age and sex (Model 1), and then further adjusted for other confounding variables (age, sex, hypertension, diabetes mellitus, BMI, serum total cholesterol, eGFR, smoking, alcohol consumption, and exercise habits; Model 2). To reduce reverse causality, the same analysis was performed after excluding all-cause deaths during the first 5 years of follow-up (n=284). Furthermore, to examine the details regarding reverse causation, we conducted an analysis excluding all-cause deaths within the first 1, 2, and 3 years of follow-up. The results are presented as HRs and 95% confidence intervals (CIs) for each group.
We used the Kaplan-Meier method to create unadjusted survival curves, stratifying all participants by sex-specific hemoglobin quintiles. Furthermore, we computed restricted cubic splines with 3 knots to visually assess the shape of the association between the continuous variable (hemoglobin) and risk of CVD mortality for all participants, and for men and women separately. The statistical significance of non-linearity (i.e., curvature) was tested by comparing the spline model with the linear model,28 and P<0.05 was regarded as indicating a significant non-linear relationship between the exposure and the outcome. In addition, subgroup analyses were conducted based on sex, renal function, smoking, and obesity. In this study, we targeted the general population, and thus we used eGFR <60 mL/min/1.73 m2
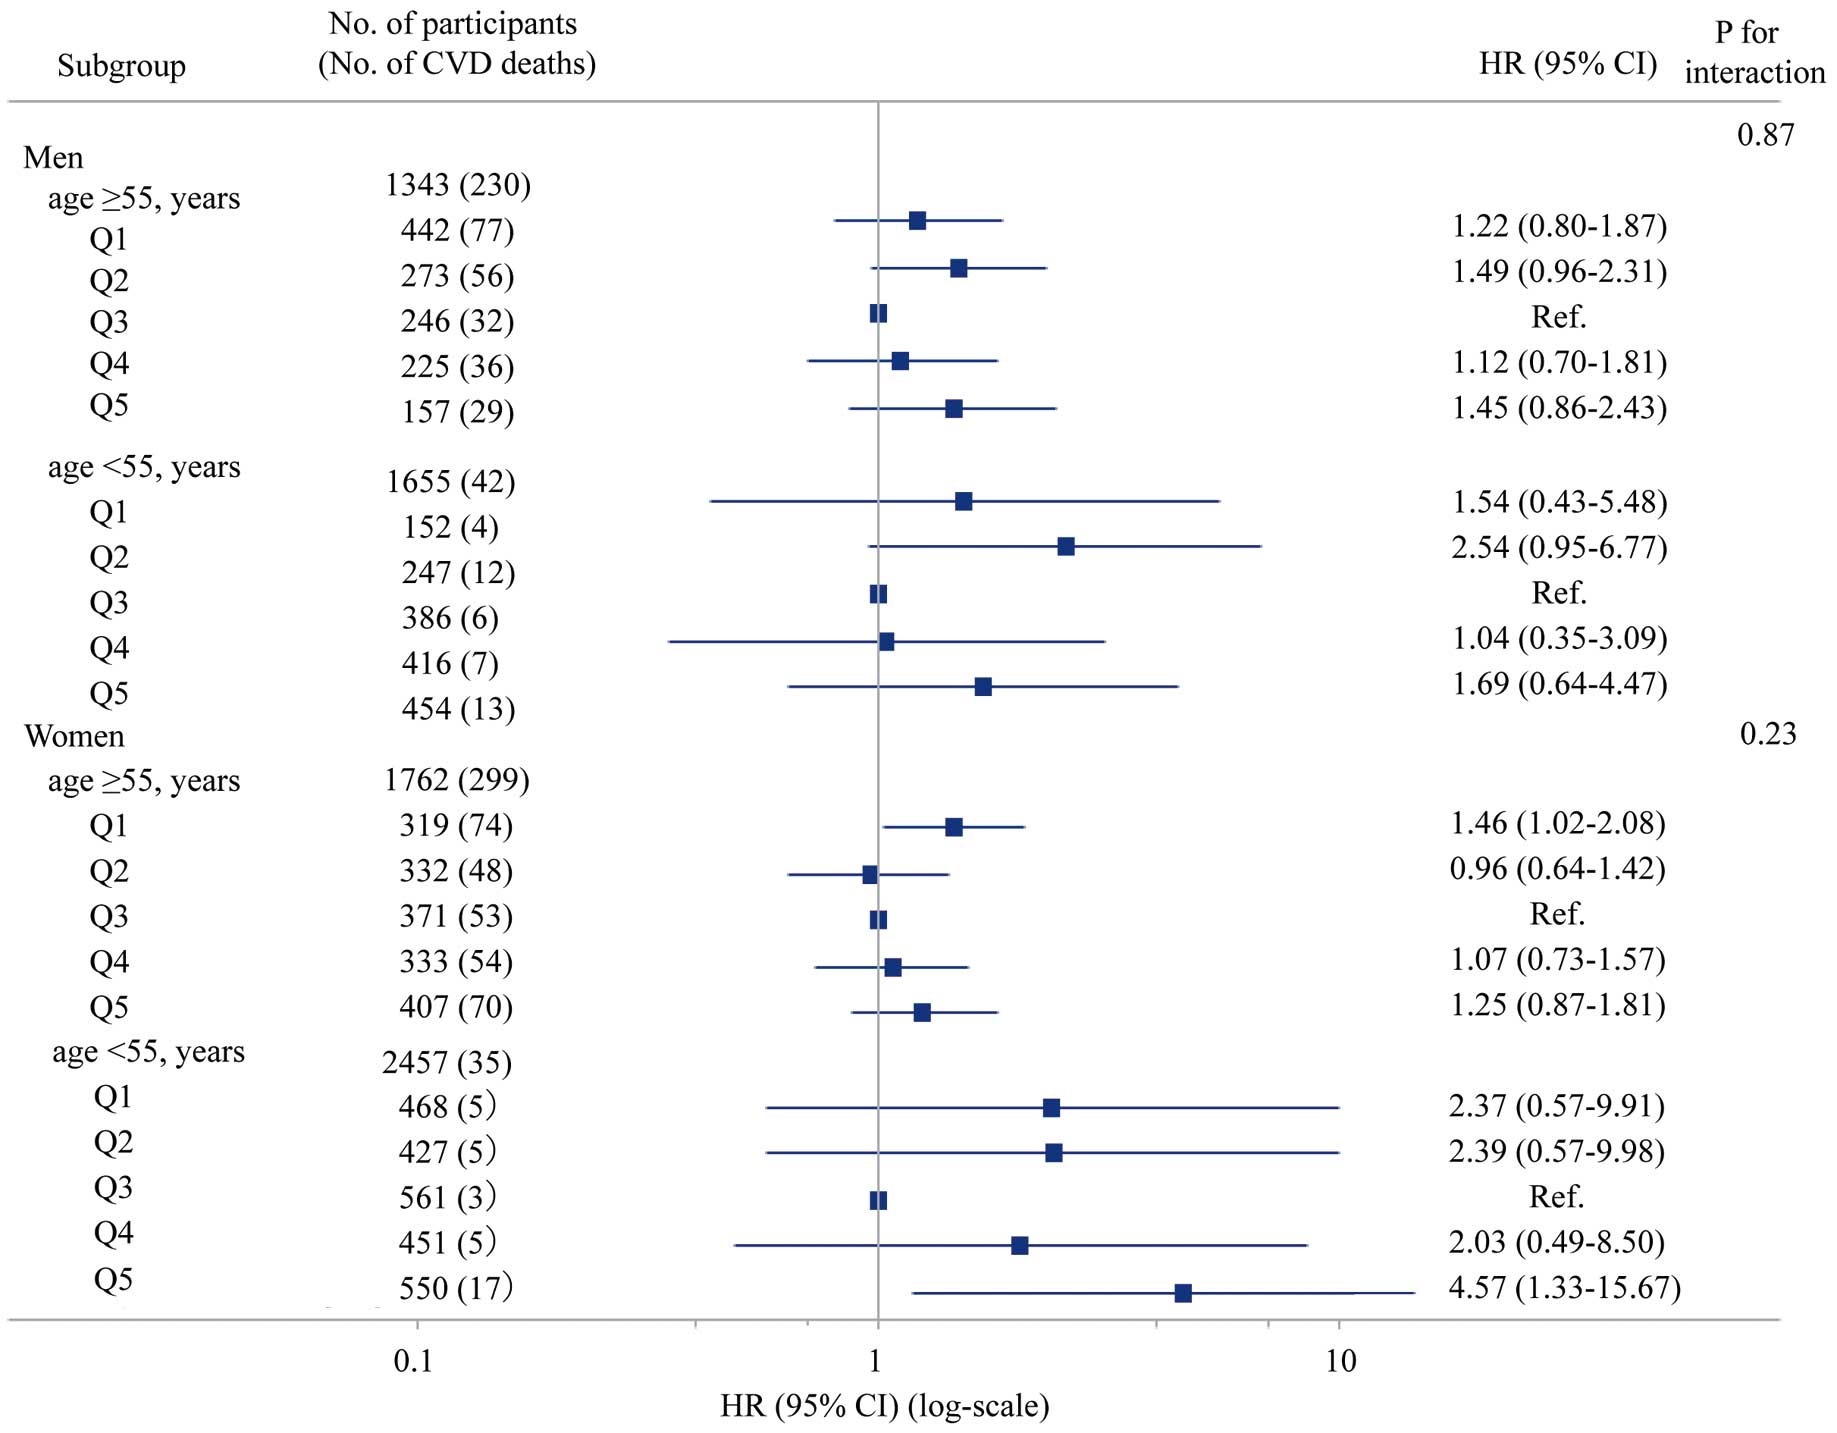
as a cut-off value for renal dysfunction. Regarding smoking habits, participants were categorized into smokers and non-smokers, and the criterion for obesity were set at BMI 25 kg/m2. Because hemoglobin concentrations change before and after menopause, the impact of menopause needed to be analyzed. However, the NIPPON DATA90 study did not include specific information on menopause. Therefore, we assessed the association of hemoglobin quintiles concentrations with CVD mortality risk using age 55 years for subgroup analysis by sex because it is reported that 90% of Japanese women undergo menopause at 55 years of age.29 We repeated the analysis for cause-specific CVD mortality (including CAD, stroke, cerebral infarction, and cerebral hemorrhage), all-cause mortality, and cancer mortality.
We also examined the associations between TSAT and CVD mortality and associations between hemoglobin and overall mortality and cancer-related mortality. TSAT was stratified into sex-specific quintiles, with Q1 indicating low values and Q5 indicating high values. We repeated the analysis for other iron parameters (i.e., serum iron and TIBC). In all analyses, 2-sided P<0.05 was considered statistically significant.
Restricted cubic splines analyses were conducted using R version 4.1.0 (R Foundation for Statistical Computing, Vienna, Austria); all other analyses were conducted using SAS version 9.4 (SAS Institute, Cary, NC, USA).
Results
In the present study, mean (±SD) hemoglobin concentrations were 14.9±1.3 g/dL in men and 12.8±1.2 g/dL in women. The distributions of hemoglobin in men and women were likely to follow a normal distribution (Supplementary Figure 1). The baseline characteristics of the study population according to sex-specific hemoglobin quintiles are summarized in Table 1. The mean age of the participants was 52.7 years for men and 52.0 years for women. Higher hemoglobin concentrations were associated with higher levels of diastolic blood pressure, serum total cholesterol, BMI, TSAT, and serum iron, and greater proportions of individuals who were current smokers (≥20 cigarettes/day) and current drinkers. In addition, higher hemoglobin concentrations tended to be associated with lower age. There was a trend for a U-shaped associations between hemoglobin concentrations and the proportion of individuals using antihypertensive medications, systolic blood pressure, and blood glucose concentrations.
Table 1.
Baseline Characteristics According to the Sex-Specific Hemoglobin Concentration Quintiles (NIPPON DATA90, 1990)
| |
Hemoglobin quintiles |
P value |
Q1 (lowest;
n=1,381) |
Q2
(n=1,279) |
Q3
(n=1,564) |
Q4
(n=1,425) |
Q5 (highest;
n=1,568) |
| Hemoglobin range (g/dL) |
| Men |
<13.9 |
≥13.9, <14.6 |
≥14.6, <15.2 |
≥15.2, <15.9 |
≥15.9 |
|
| Women |
<12.0 |
≥12.0, <12.6 |
≥12.6, <13.2 |
≥13.2, <13.7 |
≥13.7 |
|
| Age (years) |
56.7±15.3 |
53.3±13.5 |
51.0±13.1 |
50.8±12.9 |
50.2±12.6 |
<0.001 |
| % Women |
57.0 |
59.3 |
59.6 |
55.0 |
61.0 |
0.008 |
| SBP (mmHg) |
135.9±22.3 |
133.2±20.1 |
133.7±20.0 |
134.8±19.8 |
137.3±20.3 |
<0.001 |
| DBP (mmHg) |
78.9±12.0 |
79.6±11.5 |
80.6±11.4 |
82.1±11.3 |
84.3±12.2 |
<0.001 |
Use of hypertension
medications (%) |
15.3 |
11.5 |
11.6 |
12.8 |
16.9 |
<0.001 |
| HbA1c (%) |
5.0±0.6 |
4.9±0.5 |
4.9±0.7 |
4.9±0.7 |
5.0±1.0 |
<0.001 |
Non-fasting blood
sugar (mg/dL) |
104.4±35.1 |
100.9±24.8 |
101.1±29.3 |
101.6±29.9 |
105.0±37.6 |
<0.001 |
| History of diabetes (%) |
5.4 |
3.8 |
3.9 |
4.0 |
6.1 |
0.008 |
Serum total
cholesterol (mg/dL) |
193.0±36.9 |
199.0±35.5 |
202.8±37.5 |
206.0±36.5 |
213.4±39.2 |
<0.001 |
eGFR
(mL/min/1.73 m2) |
69.9±18.6 |
70.9±14.4 |
71.2±14.6 |
70.9±13.7 |
70.1±13.7 |
0.098 |
Body mass index
(kg/m2) |
21.8±3.0 |
22.4±2.8 |
22.7±2.9 |
23.3±3.0 |
24.0±3.4 |
<0.001 |
| Smoking habit (%) |
|
|
|
|
|
<0.001 |
| Never smoked |
62.6 |
63.9 |
62.2 |
59.2 |
55.1 |
|
| Quit smoking |
14.2 |
11.7 |
10.9 |
10.4 |
8.4 |
|
Current smoker
(<20 cigarettes/day) |
11.7 |
10.1 |
9.9 |
8.0 |
11.0 |
|
Current smoker
(≥20 cigarettes/day) |
11.6 |
14.3 |
17.0 |
22.4 |
25.5 |
|
| Drinking habit (%) |
|
|
|
|
|
<0.001 |
| Never drinker |
70.8 |
70.3 |
69.5 |
66.7 |
66.1 |
|
| Quit drinking |
4.7 |
3.1 |
2.1 |
2.3 |
3.1 |
|
| Current drinker |
24.5 |
26.7 |
28.5 |
31.1 |
30.7 |
|
| Exercise habit (%) |
|
|
|
|
|
<0.001 |
No exercise
(for health reasons) |
8.5 |
5.6 |
4.0 |
5.0 |
5.4 |
|
No exercise
(for other reasons) |
71.7 |
75.2 |
75.5 |
74.7 |
74.1 |
|
| Exercise |
19.8 |
19.2 |
20.5 |
20.4 |
20.5 |
|
| TSAT (%) |
18.8±13.4 |
23.3±11.9 |
24.1±10.9 |
25.1±11.1 |
25.9±11.6 |
<0.001 |
| Serum iron (μg/dL) |
5,505.6±3,463.9 |
6,913.9±3,382.8 |
7,310.4±3,224.5 |
7,641.7±3,302.5 |
8,052.1±3,490.3 |
<0.001 |
| TIBC (μg/dL) |
32,416.4±7,402.0 |
30,552.2±4,920.7 |
30,899.7±4,478.6 |
30,826.7±4,058.3 |
31,493.9±4,164.8 |
<0.001 |
Dietary iron intake
(mg/1,000 kcal) |
5.8±1.2 |
5.8±1.2 |
5.8±1.3 |
5.8±1.2 |
5.9±1.3 |
0.309 |
Unless indicated otherwise, values are given as the mean±SD or as percentages. DBP, diastolic blood pressure; eGFR, estimated glomerular filtration rate; SBP, systolic blood pressure; TIBC, total iron binding capacity; TSAT, transferrin saturation.
Over the 25-year follow-up period, 1,128 men and 1,061 women died. Of these, 272 men and 334 women died from CVD. We confirmed consistent declines in survival curves across all hemoglobin quintile groups, especially in the Q1 group, throughout the follow-up period (Supplementary Figure 2). Table 2 presents the adjusted HRs and 95% CIs for CVD mortality according to hemoglobin quintile. Compared with the reference group (Q3), both the Q1 and Q5 groups showed significantly higher HRs after adjustment for age and sex (1.39 [95% CI 1.07–1.79] and 1.58 [1.21–2.06], respectively), as well as multivariable adjustment (1.40 [1.08–1.82] and 1.49 [1.14–1.96], respectively). Even after excluding deaths within the first 5 years to account for reverse causation, similar results were observed (Table 2). Similar results were also observed in the analysis excluding all-cause deaths within the first 1, 2, and 3 years of follow-up (Supplementary Table 1).
Table 2.
HRs and 95% CIs for Cardiovascular Disease Mortality According to Sex-Specific Hemoglobin Quintiles
| |
Hemoglobin quintiles |
| Q1 (lowest) |
Q2 |
Q3 |
Q4 |
Q5 (highest) |
| Hemoglobin range (g/dL) |
| Men |
<13.9 |
≥13.9, <14.6 |
≥14.6, <15.2 |
≥15.2, <15.9 |
≥15.9 |
| Women |
<12.0 |
≥12.0, <12.6 |
≥12.6, <13.2 |
≥13.2, <13.7 |
≥13.7 |
| Across 25 years of follow up (n=7,217) |
| No. participants |
1,381 |
1,279 |
1,564 |
1,425 |
1,568 |
| No. deaths |
160 |
121 |
94 |
102 |
129 |
| Person-years at risk |
26,010.2 |
27,162.9 |
33,672.7 |
31,506.1 |
34,219.2 |
Unadjusted death rate per 1,000
person-years |
6.2 |
4.5 |
2.8 |
3.2 |
3.8 |
| Age- and sex-adjusted HR (95% CI) |
1.39 (1.07–1.79)* |
1.24 (0.94–1.62) |
1.00 (Ref.) |
1.13 (0.85–1.49) |
1.58 (1.21–2.06)* |
| Multivariable-adjusted HRa (95% CI) |
1.40 (1.08–1.82)* |
1.32 (1.01–1.73)* |
1.00 (Ref.) |
1.13 (0.85–1.50) |
1.49 (1.14–1.96)* |
| Excluding all deaths within the first 5 years of follow-up (n=6,933) |
| No. participants |
1,261 |
1,231 |
1,521 |
1,389 |
1,531 |
| No. deaths |
129 |
107 |
85 |
96 |
116 |
| Person-years at risk |
25,664.9 |
27,021.1 |
33,528.3 |
31,398.3 |
34,095.6 |
Unadjusted death rate per 1,000
person-years |
5.0 |
4.0 |
2.5 |
3.1 |
3.4 |
| Age- and sex-adjusted HR (95% CI) |
1.32 (1.00–1.74)* |
1.21 (0.91–1.61) |
1.00 (Ref.) |
1.16 (0.87–1.55) |
1.55 (1.17–2.06)* |
| Multivariable-adjusted HRa (95% CI) |
1.35 (1.02–1.79)* |
1.30 (0.97–1.73) |
1.00 (Ref.) |
1.15 (0.86–1.54) |
1.45 (1.09–1.94)* |
aThe multivariable model was adjusted for age, sex, body mass index, smoking status, alcohol drinking, exercise habit, hypertension, diabetes, serum total cholesterol, and estimated glomerular filtration rate. *P<0.05. CI, confidence interval; HR, hazard ratio.
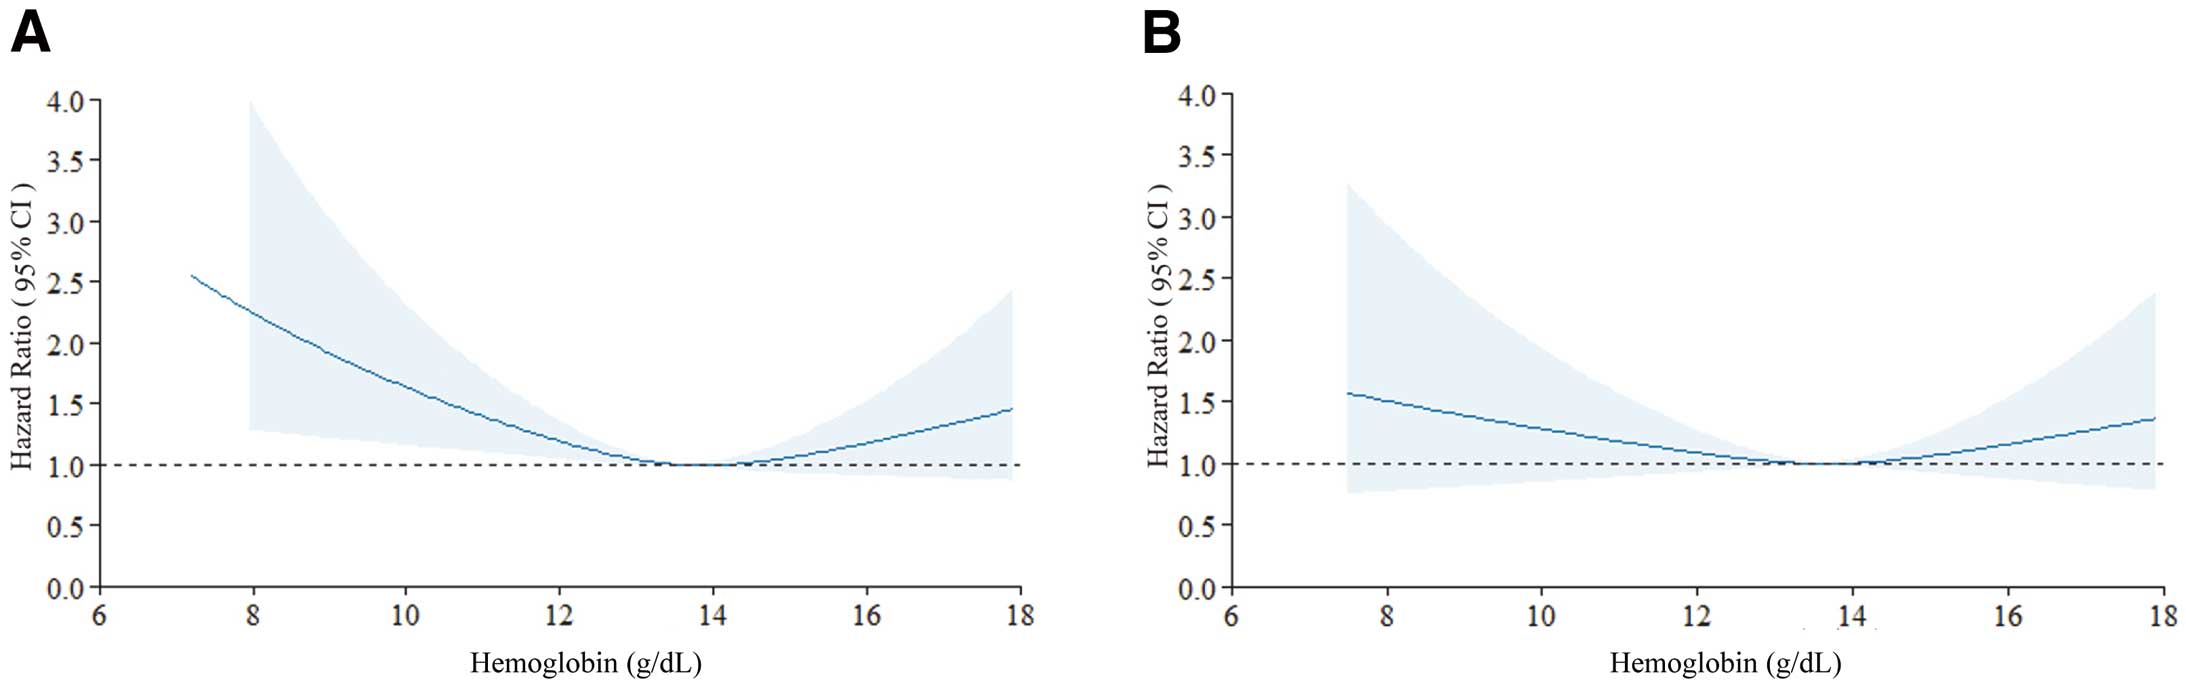
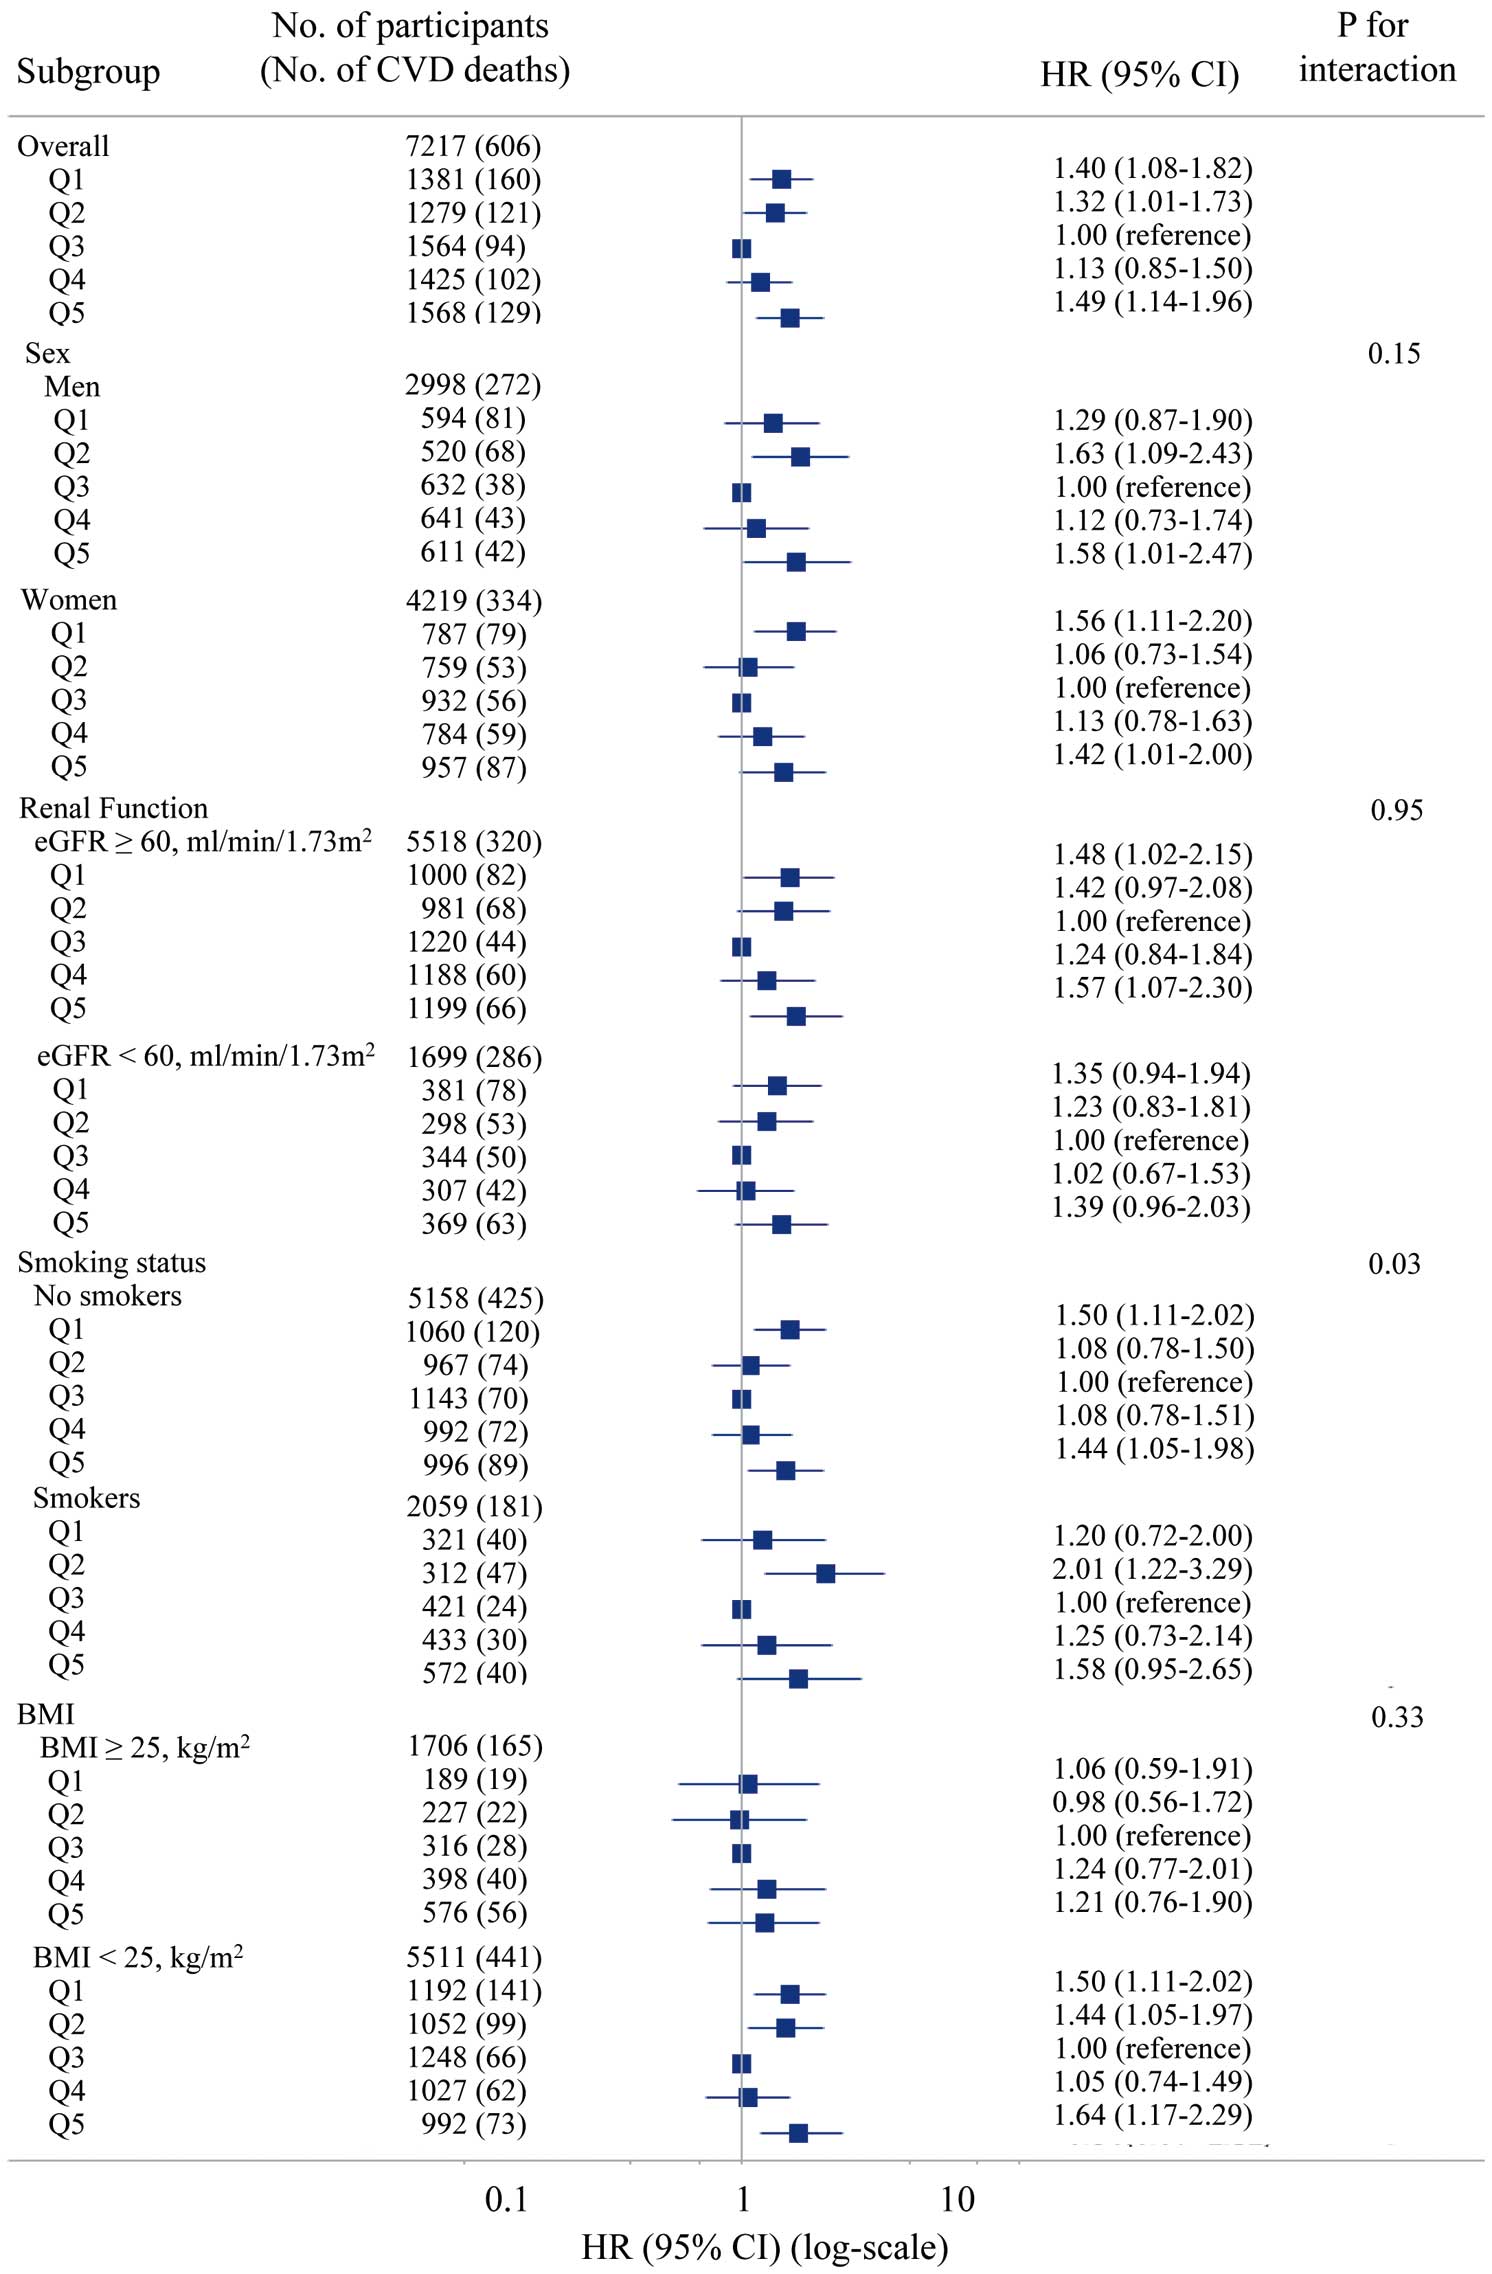
Using a restricted cubic spline regression with a 3-knot approach, we confirmed a U-shaped trend between the hemoglobin concentration and CVD mortality for all participants (P=0.008; Figure 1A), but the spline was not significant except for participants who died within 5 years (P=0.145; Figure 1B). In addition, in the restricted cubic spline regression by sex, the U-shaped associations were more pronounced in women than in men (Supplementary Figures 3,4). Stratified by sex, renal function, and obesity, the interaction P values were not significant, and similar trends were observed (Figure 2). An interaction was observed based on smoking status, because U-shaped associations were demonstrated in the non-smoking group, whereas the smoking group showed a significant increase in risk in the Q2 group (Figure 2). For menopause (classified as ≥55 years and under <55 years), the interaction P values were not significant for the subgroup analysis when divided by sex and age, and similar trends were observed (Figure 3).
In the analysis of cause-specific CVD mortality, we observed U-shaped associations, especially for mortality from stroke and cerebral infarction (Supplementary Tables 2–5). The association between all-cause mortality and hemoglobin concentrations showed an increase in risk in Q1, even after multivariable adjustment, but this significance disappeared when excluding deaths within the first 5 years of follow-up (Supplementary Table 6). There was no significant association observed between hemoglobin concentrations in Q1 and Q5 and cancer mortality (Supplementary Table 7).
The mean (±SD) TSAT values were 28.6±12.7% in men and 19.9±10.1% in women. Supplementary Table 8 presents characteristics of participants across the sex-specific TSAT quintiles. The association between TSAT and CVD mortality similarly exhibited a U-shaped association even after adjustment for age and in multivariable-adjusted analysis. However, when deaths within 5 years were excluded, although a U-shaped association was observed, a significant increase in risk was only found in the lowest TSAT (Q1) group (Table 3).
Table 3.
HRs and 95% CIs for Cardiovascular Disease Mortality According to Sex-Specific TSAT Quintiles
| |
TSAT quintiles |
| Q1 |
Q2 |
Q3 |
Q4 |
Q5 |
| TSAT range (%) |
| Men |
<18.3 |
≥18.3, <24.0 |
≥24.0, <29.4 |
≥29.4, <37.6 |
≥37.6 |
| Women |
<11.8 |
≥11.8, <16.9 |
≥16.9, <21.3 |
≥21.3, <27.0 |
≥27.0 |
| Across 25 years of follow up (n=7,217) |
| No. participants |
1,445 |
1,450 |
1,439 |
1,438 |
1,445 |
| No. deaths |
113 |
128 |
107 |
125 |
133 |
| Person-years at risk |
30,522.8 |
30,893.5 |
30,623.3 |
30,233.5 |
30,298.1 |
Unadjusted death rate per 1,000
person-years |
3.7 |
4.1 |
3.5 |
4.1 |
4.4 |
| Age- and sex-adjusted HR (95% CI) |
1.43 (1.10–1.87)* |
1.29 (0.99–1.67) |
1.00 (Ref.) |
1.18 (0.91–1.53) |
1.34 (1.04–1.73)* |
| Multivariable-adjusted HRa (95% CI) |
1.41 (1.08–1.85)* |
1.27 (0.98–1.64) |
1.00 (Ref.) |
1.17 (0.90–1.51) |
1.31 (1.01–1.69)* |
| Excluding all deaths within the first 5 years of follow-up (n=6,933) |
| No. participants |
1,383 |
1,392 |
1,396 |
1,378 |
1,384 |
| No. deaths |
98 |
112 |
98 |
107 |
118 |
| Person-years at risk |
30,338.3 |
30,715.9 |
30,506.5 |
30,045.4 |
30,100.5 |
Unadjusted death rate per 1,000
person-years |
3.2 |
3.6 |
3.2 |
3.6 |
3.9 |
| Age- and sex-adjusted HR (95% CI) |
1.40 (1.05–1.85)* |
1.23 (0.94–1.62) |
1.00 (Ref.) |
1.11 (0.84–1.46) |
1.30 (0.99–1.70) |
| Multivariable-adjusted HRa (95% CI) |
1.40 (1.05–1.86)* |
1.22 (0.93–1.60) |
1.00 (Ref.) |
1.10 (0.84–1.45) |
1.26 (0.96–1.66) |
aThe multivariable model was adjusted for age, sex, body mass index, smoking status, alcohol drinking, exercise habit, hypertension, diabetes, serum total cholesterol, and estimated glomerular filtration rate. *P<0.05. CI, confidence interval; HR, hazard ratio; TSAT, transferrin saturation.
Furthermore, the association between serum iron concentration and CVD mortality appeared to be U-shaped, although it was not statistically significant (Supplementary Table 9). There were no significant trends or associations between TIBC and CVD mortality (Supplementary Table 10).
Discussion
In this long-term cohort study of a national survey in Japan, we found that hemoglobin concentrations exhibited a U-shaped relationship with CVD mortality, even after adjusting for CVD risk factors. Furthermore, even after excluding all deaths within the first 5 years of follow-up, a similar association was observed. The findings are consistent with previous reports that both low and high hemoglobin concentrations in the general population may increase the risk of CVD mortality.5,8 However, studies considering the issue of reverse causality are limited. The NIPPON DATA90 cohort, with its large-scale and long-term follow-up, enabled us to conduct sensitivity analyses that considered reverse causality.
Several mechanisms have been reported regarding the association between hemoglobin concentration and CVD mortality rate. An elevated hemoglobin concentration results in increased blood viscosity, reduced systemic blood flow velocity, and heightened peripheral resistance, leading to diminished blood flow and perfusion to tissues.6,11,12 This is associated with an increased incidence of ischemic conditions11 and coronary artery disease.12 It has also been suggested that the effects of oxidative stress can be attributed to the excessive accumulation of iron, a constituent of hemoglobin.14 Low hemoglobin concentrations can lead to chronic anemia, resulting in decreased blood viscosity, and vasodilation because of hypoxia. This leads to increased venous return (preload) and filling of the left ventricle, ultimately increasing left ventricle end-diastolic volume and maintaining a high cardiac output.6,7 Furthermore, anemia results in an increased heart rate because of hypoxia-stimulated chemoreceptors and increased sympathetic activity. Over the long term, these changes in hemodynamics contribute to cardiac enlargement and left ventricular hypertrophy.7 In addition, a chronic increase in cardiac output promotes arterial remodeling of central elastic arteries, such as the aorta and carotid arteries, and is associated with arteriosclerosis.7,30
Subgroup analysis in the present study showed similar trends in all groups, with the exception of smoking status. Subgroup analysis according to smoking status showed an interaction effect. In particular, in the current (≥20 cigarettes/day) smoking group there was a significantly increased CVD mortality risk in Q2. This may be an effect of smoking in increasing hemoglobin in participants who would otherwise have been in the anemic group.31 Although no statistically significant interaction was observed in the subgroup analysis according to BMI, the U-shaped association appeared to be weaker in those with a BMI ≥25 kg/m2
than in those with a BMI <25 kg/m2, suggesting that obesity may potentially have some effect on the association between hemoglobin concentrations and CVD mortality risk. Furthermore, although the specific causes of low or high hemoglobin concentrations were not investigated in the present study, it is worth noting that there were no significant differences in dietary iron intake across hemoglobin concentrations at baseline. This suggests that the etiology of iron-deficiency anemia may be more closely related to factors such as impaired iron absorption or bleeding rather than low intake of dietary iron.
Iron excess in the body is hypothesized to increase cardiovascular risk. Iron enhances oxidative stress and may play an important role as a risk factor in various chronic diseases, including CVD.32,33 In the case of iron deficiency, iron acts as a regulatory factor for thrombosis. Under conditions of iron deficiency, the anti-thrombotic effects are diminished, leading to reactive thrombocytosis.34 Therefore, a U-shaped association between iron indices and CVD mortality risk is possible, but studies reporting such a U-shaped association are limited.35 Similarly, in the present study, a U-shaped association was observed between TSAT, as a measure of iron status, and CVD-related mortality, even after adjustment for CVD risk factors. After excluding deaths within the first 5 years of follow-up, the association weakened in the high quintiles group. The time periods associated with risk of CVD mortality may differ between the low and high TSAT groups, and further research is needed. Furthermore, when comparing the results of the iron indicators (i.e., TSAT, serum iron, and TIBC) for CVD mortality risk in our study, the association for TSAT was stronger than that for serum iron. It is well documented that chronic iron deficiency operates through mechanisms involving the reduction of serum iron concentrations and the subsequent increase in TIBC, consequently leading to decreased TSAT.36 Considering these mechanisms, it is possible that chronic iron deficiency or iron excess, rather than transient low or high serum iron concentrations, may have an impact on CVD mortality risk.
One of explanations for the differential trends between cause-specific CVD mortality may be due to differences in the distribution of CAD or stroke burden in Japan. That is, stroke, especially cerebral infarction, is dominant among CVDs in the Japanese population.37 Long-term studies with a larger sample size are needed to comprehensively assess cause-specific CVD risk in relation to hemoglobin concentrations. Previous reports have shown associations between hemoglobin concentrations and all-cause mortality,3–5 as well as cancer mortality.4,5 In the present study, the statistically significant association of hemoglobin concentrations with all-cause mortality disappeared when deaths within the first 5 years were excluded, suggesting the possibility of reverse causation effects. For cancer mortality, most previous reports had a follow-up period of <10 years. In contrast, participants in the present study were followed up for 25 years. As a result of the increased aging of the study participants during the follow-up period, differences in the causes of death may have influenced the results.
Study Limitations
First, because this study only measured the characteristics at baseline, information on changes in therapy or lifestyle during the follow-up period was not obtained. Second, we carefully controlled for major known confounders; however, our findings may be partly explained by differences in unmeasured confounders (e.g., heart rate7 and inflammatory markers36,38). Third, measurements of hemoglobin and TSAT were only conducted at baseline, and changes during the follow-up period have not been taken into consideration. In fact, a previous study reported that a decline in hemoglobin to anemic ranges during 2 years was associated with higher CVD mortality risk compared with persistent normal hemoglobin concentrations.8 Fourth, ferritin, an important iron parameter in the body, was not measured in this study. Therefore, we used TSAT, which is commonly used in clinical practice. Fifth, because mortality data were used as the endpoint, the causes of death may have been misclassified. Finally, only Japanese men and women from the general population were included in the analyses; therefore, our results cannot be generalized to other populations.
Conclusions
In this long-term cohort study of a representative Japanese population, both low and high hemoglobin concentrations were independently associated with an increased risk of CVD mortality. Our results suggest that, in the general population, hemoglobin concentrations that deviate from the normal range may be an independent CVD mortality risk factor.
Acknowledgments
The authors thank all the members of the Japanese Association of Public Health Center Directors and all the staff of the public health centers who cooperated with our study, as well as the investigators and members of the NIPPON DATA90 Research Group (see Appendix). The authors thank Carol Wilson, PhD, from Edanz (https://jp.edanz.com/ac) for editing a draft of this manuscript.
Sources of Funding
This study was supported by: a Grant-in-Aid from the Ministry of Health, Labor and Welfare under the auspices of the Japanese Association for Cerebro-Cardiovascular Disease Control; a Research Grant for Cardiovascular Diseases (7A-2) from the Ministry of Health, Labor and Welfare; Health and Labor Sciences Research Grants, Japan (Comprehensive Research on Aging and Health [H11-Chouju-046, H14-Chouju-003, H17Chouju-012, H19-Chouju-Ippan-014] and Comprehensive Research on Life-Style Related Diseases including Cardiovascular Diseases and Diabetes Mellitus [H22-Junkankitou-Seishuu-Sitei-017, H25Junkankitou-Seishuu-Sitei-022, H30-Junkankitou-Sitei-002: 21FA2002]).
Disclosures
The authors declare no conflicts of interest associated with this manuscript.
IRB Information
This study was approved by the Institutional Review Board of Shiga University of Medical Science (Approval no. R2005-021).
Appendix
Members of the NIPPON DATA Research Group are listed below.
Chairpersons: Hirotsugu Ueshima (Shiga University of Medical Science, Otsu, Shiga, Japan), Akira Okayama (Research Institute of Strategy for Prevention, Tokyo, Japan), and Katsuyuki Miura (Shiga University of Medical Science, Otsu, Shiga, Japan) for NIPPON DATA80
Hirotsugu Ueshima, Tomonori Okamura (Keio University School of Medicine, Tokyo, Japan), and Katsuyuki Miura for NIPPON DATA90
Research Members: Shigeyuki Saitoh (Sapporo Medical University, Sapporo, Hokkaido, Japan); Kiyomi Sakata (Iwate Medical University, Morioka, Iwate, Japan); Atsushi Hozawa (Tohoku University, Sendai, Miyagi, Japan); Yosikazu Nakamura (Jichi Medical University, Shimotsuke, Tochigi, Japan); Nobuo Nishi (National Institutes of Biomedical Innovation, Health and Nutrition, Tokyo, Japan); Takayoshi Ohkubo (Teikyo University School of Medicine, Tokyo, Japan); Yoshitaka Murakami (Toho University, Tokyo, Japan); Toshiyuki Ojima (Hamamatsu University School of Medicine, Hamamatsu, Shizuoka, Japan); Koji Tamakoshi (Nagoya University Graduate School of Medicine, Nagoya, Aichi, Japan); Hideaki Nakagawa (Kanazawa Medical University, Uchinada, Ishikawa, Japan); Yoshikuni Kita (Tsuruga Nursing University, Tsuruga, Fukui, Japan); Aya Kadota, Yasuyuki Nakamura, Naomi Miyamatsu (Shiga University of Medical Science, Otsu, Shiga, Japan); Takehito Hayakawa (Ritsumeikan University, Kyoto, Japan); Nagako Okuda (Kyoto Prefectural University, Kyoto, Japan); Katsushi Yoshita (Osaka City University Graduate School of Human Life Science, Osaka, Japan); Yoshihiro Miyamoto, Makoto Watanabe (National Cerebral and Cardiovascular Center, Suita, Osaka, Japan); Akira Fujiyoshi (Wakayama Medical University, Wakayama, Japan); Kazunori Kodama, Fumiyoshi Kasagi (Radiation Effects Research Foundation, Hiroshima, Japan); Yutaka Kiyohara (Hisayama Research Institute for Lifestyle Diseases, Hisayama, Fukuoka, Japan)
Supplementary Files
Please find supplementary file(s);
https://doi.org/10.1253/circj.CJ-23-0725
References
- 1. World Health Organization. The top ten causes of death. 2020. https://www.who.int/news-room/fact-sheets/detail/the-top-10-causes-of-death#:~:Text=The%20top%20global%20causes%20of,birth%20asphyxia%20and%20birth%20trauma%2C (accessed September 7, 2023).
- 2. Ministry of Health Labour and Welfare. Trends in leading causes of death. https://www.mhlw.go.jp/english/database/db-hw/populate/index.html (accessed September 7, 2023).
- 3.
Liu Z, Sun R, Li J, Cheng W, Li L. Relations of anemia with the all-cause mortality and cardiovascular mortality in general population: A meta-analysis. Am J Med Sci 2019; 358: 191–199, doi:10.1016/j.amjms.2019.05.016.
- 4.
Martinsson A, Andersson C, Andell P, Koul S, Engstrom G, Smith JG. Anemia in the general population: Prevalence, clinical correlates and prognostic impact. Eur J Epidemiol 2014; 29: 489–498, doi:10.1007/s10654-014-9929-9.
- 5.
Kabat GC, Kim MY, Verma AK, Manson JE, Lessin LS, Kamensky V, et al. Association of hemoglobin concentration with total and cause-specific mortality in a cohort of postmenopausal women. Am J Epidemiol 2016; 183: 911–919, doi:10.1093/aje/kwv332.
- 6.
Sarnak MJ, Tighiouart H, Manjunath G, MacLeod B, Griffith J, Salem D, et al. Anemia as a risk factor for cardiovascular disease in the Atherosclerosis Risk in Communities (ARIC) study. J Am Coll Cardiol 2002; 40: 27–33, doi:10.1016/s0735-1097(02)01938-1.
- 7.
Metivier F, Marchais SJ, Guerin AP, Pannier B, London GM. Pathophysiology of anaemia: Focus on the heart and blood vessels. Nephrol Dial Transplant 2000; 15(Suppl 3): 14–18, doi:10.1093/oxfordjournals.ndt.a027970.
- 8.
Lee G, Choi S, Kim K, Yun JM, Son JS, Jeong SM, et al. Association of hemoglobin concentration and its change with cardiovascular and all-cause mortality. J Am Heart Assoc 2018; 7: e007723, doi:10.1161/jaha.117.007723.
- 9.
Lee G, Choi S, Kim K, Yun JM, Son JS, Jeong SM, et al. Association between changes in hemoglobin concentration and cardiovascular risks and all-cause mortality among young women. J Am Heart Assoc 2018; 7: e008147, doi:10.1161/jaha.117.008147.
- 10.
Hultcrantz M, Modlitba A, Vasan SK, Sjölander A, Rostgaard K, Landgren O, et al. Hemoglobin concentration and risk of arterial and venous thrombosis in 1.5 million Swedish and Danish blood donors. Thromb Res 2020; 186: 86–92, doi:10.1016/j.thromres.2019.12.011.
- 11.
Burch GE, DePasquale NP. Hematocrit, viscosity and coronary blood flow. Dis Chest 1965; 48: 225–232, doi:10.1378/chest.48.3.225.
- 12.
Danesh J, Collins R, Peto R, Lowe GD. Haematocrit, viscosity, erythrocyte sedimentation rate: Meta-analyses of prospective studies of coronary heart disease. Eur Heart J 2000; 21: 515–520, doi:10.1053/euhj.1999.1699.
- 13.
Lowe GD, Forbes CD. Platelet aggregation, haematocrit, and fibrinogen. Lancet 1985; 1: 395–396, doi:10.1016/s0140-6736(85)91414-x.
- 14.
Salonen JT, Nyyssönen K, Korpela H, Tuomilehto J, Seppänen R, Salonen R. High stored iron levels are associated with excess risk of myocardial infarction in eastern Finnish men. Circulation 1992; 86: 803–811, doi:10.1161/01.cir.86.3.803.
- 15.
Steinmeyer Z, Delpierre C, Soriano G, Steinmeyer A, Ysebaert L, Balardy L, et al. Hemoglobin concentration; a pathway to frailty. BMC Geriatr 2020; 20: 202, doi:10.1186/s12877-020-01597-6.
- 16.
Edgren G, Bagnardi V, Bellocco R, Hjalgrim H, Rostgaard K, Melbye M, et al. Pattern of declining hemoglobin concentration before cancer diagnosis. Int J Cancer 2010; 127: 1429–1436, doi:10.1002/ijc.25122.
- 17.
Sofue T, Nakagawa N, Kanda E, Nagasu H, Matsushita K, Nangaku M, et al. Prevalence of anemia in patients with chronic kidney disease in Japan: A nationwide, cross-sectional cohort study using data from the Japan Chronic Kidney Disease Database (J-CKD-DB). PLoS One 2020; 15: e0236132, doi:10.1371/journal.pone.0236132.
- 18.
Poggiali E, Migone De Amicis M, Motta I. Anemia of chronic disease: A unique defect of iron recycling for many different chronic diseases. Eur J Intern Med 2014; 25: 12–17, doi:10.1016/j.ejim.2013.07.011.
- 19.
Sullivan JL. Iron and the sex difference in heart disease risk. Lancet 1981; 1: 1293–1294, doi:10.1016/s0140-6736(81)92463-6.
- 20.
Muñoz-Bravo C, Gutiérrez-Bedmar M, Gómez-Aracena J, García-Rodríguez A, Navajas JF. Iron: Protector or risk factor for cardiovascular disease? Still controversial. Nutrients 2013; 5: 2384–2404, doi:10.3390/nu5072384.
- 21.
Sempos CT, Looker AC, Gillum RF, Makuc DM. Body iron stores and the risk of coronary heart disease. N Engl J Med 1994; 330: 1119–1124, doi:10.1056/nejm199404213301604.
- 22.
Kim KS, Son HG, Hong NS, Lee DH. Associations of serum ferritin and transferrin % saturation with all-cause, cancer, and cardiovascular disease mortality: Third National Health and Nutrition Examination Survey follow-up study. J Prev Med Public Health 2012; 45: 196–203, doi:10.3961/jpmph.2012.45.3.196.
- 23.
Kadota A, Hozawa A, Okamura T, Kadowak T, Nakmaura K, Murakami Y, et al. Relationship between metabolic risk factor clustering and cardiovascular mortality stratified by high blood glucose and obesity: NIPPON DATA90, 1990–2000. Diabetes Care 2007; 30: 1533–1538, doi:10.2337/dc06-2074.
- 24.
Hisamatsu T, Ohkubo T, Miura K, Yamamoto T, Fujiyoshi A, Miyagawa N, et al. Association between J-point elevation and death from coronary artery disease: 15-year follow up of the NIPPON DATA90. Circ J 2013; 77: 1260–1266, doi:10.1253/circj.CJ-12-1273.
- 25.
Nakamura K, Okamura T, Hayakawa T, Kadowaki T, Kita Y, Ohnishi H, et al. Chronic kidney disease is a risk factor for cardiovascular death in a community-based population in Japan: NIPPON DATA90. Circ J 2006; 70: 954–959, doi:10.1253/circj.70.954.
- 26.
Matsuo S, Imai E, Horio M, Yasuda Y, Tomita K, Nitta K, et al. Revised equations for estimated GFR from serum creatinine in Japan. Am J Kidney Dis 2009; 53: 982–992, doi:10.1053/j.ajkd.2008.12.034.
- 27.
Okuda N, Miura K, Yoshita K, Matsumura Y, Okayama A, Nakamura Y, et al. Integration of data from NIPPON DATA80/90 and National Nutrition Survey in Japan: For cohort studies of representative Japanese on nutrition. J Epidemiol 2010; 20(Suppl 3): S506–S514, doi:10.2188/jea.je20090218.
- 28.
Desquilbet L, Mariotti F. Dose-response analyses using restricted cubic spline functions in public health research. Stat Med 2010; 29: 1037–1057, doi:10.1002/sim.3841.
- 29.
Tamada T, Iwasaki H. Age at natural menopause in Japanese women. Nihon Sanka Fujinka Gakkai Zasshi 1995; 47: 947–952 [in Japanese].
- 30.
Gibbons GH, Dzau VJ. The emerging concept of vascular remodeling. N Engl J Med 1994; 330: 1431–1438, doi:10.1056/nejm199405193302008.
- 31.
Nordenberg D, Yip R, Binkin NJ. The effect of cigarette smoking on hemoglobin levels and anemia screening. JAMA 1990; 264: 1556–1559.
- 32.
McCord JM. Is iron sufficiency a risk factor in ischemic heart disease? Circulation 1991; 83: 1112–1114, doi:10.1161/01.cir.83.3.1112.
- 33.
Sempos CT, Looker AC, Gillum RE, McGee DL, Vuong CV, Johnson CL. Serum ferritin and death from all causes and cardiovascular disease: The NHANES II Mortality Study. National Health and Nutrition Examination Study. Ann Epidemiol 2000; 10: 441–448, doi:10.1016/s1047-2797(00)00068-5.
- 34.
Franchini M, Targher G, Montagnana M, Lippi G. Iron and thrombosis. Ann Hematol 2008; 87: 167–173, doi:10.1007/s00277-007-0416-1.
- 35.
Stack AG, Mutwali AI, Nguyen HT, Cronin CJ, Casserly LF, Ferguson J. Transferrin saturation ratio and risk of total and cardiovascular mortality in the general population. QJM 2014; 107: 623–633, doi:10.1093/qjmed/hcu045.
- 36.
Elsayed ME, Sharif MU, Stack AG. Transferrin saturation: A body iron biomarker. Adv Clin Chem 2016; 75: 71–97, doi:10.1016/bs.acc.2016.03.002.
- 37.
Ueshima H, Sekikawa A, Miura K, Turin TC, Takashima N, Kita Y, et al. Cardiovascular disease and risk factors in Asia: A selected review. Circulation 2008; 118: 2702–2709, doi:10.1161/circulationaha.108.790048.
- 38.
Weiss G, Goodnough LT. Anemia of chronic disease. N Engl J Med 2005; 352: 1011–1023, doi:10.1056/NEJMra041809.