Abstract
Background: Low muscle mass in patients with acute heart failure (AHF) is associated with poor prognosis; however, this is based on a single baseline measurement, with little information on changes in muscle mass during hospitalization and their clinical implications. This study investigated the relationship between changes in rectus femoris cross-sectional area (RFCSA) on ultrasound and the prognosis of patients with AHF.
Methods and Results: This is a retrospective evaluation of 284 AHF patients (mean [±SD] age 79.1±11.9 years; 116 female). RFCSA assessments at admission (pre-RFCSA), ∆RFCSA (i.e., the percentage change in RFCSA from admission to 2 weeks), and composite prognosis (all-cause death and heart failure-related readmission) within 1 year were determined. Patients were divided into 4 groups according to their median pre-RFCSA and ∆RFCSA after sex stratification: Group A, higher pre-RFCSA/better ∆RFCSA; Group B, higher pre-RFCSA/worse ∆RFCSA; Group C, lower pre-RFCSA/better ∆RFCSA; Group D, lower pre-RFCSA/worse ∆RFCSA. In the Cox regression analysis, with Group A as the reference, the cumulative event rate of Group C (hazard ratio [HR] 3.39; 95% confidence interval [CI] 0.71–16.09; P=0.124) did not differ significantly; however, the cumulative event rates of Group B (HR 7.93; 95% CI 1.99–31.60; P=0.003) and Group D (HR 9.24; 95% CI 2.57–33.26; P<0.001) were significantly higher.
Conclusions: ∆RFCSA during hospitalization is useful for risk assessment of prognosis in patients with AHF.
Heart failure (HF) is a critical public health concern whose prevalence is increasing globally.1 Despite adherence to clinical guidelines, patients hospitalized for acute HF (AHF) have poor prognosis, including frequent readmission2 and death.3 Thus, precise prognostic assessment is important for clinical management and treatment decision making.
In general, muscle strength is considered a stronger prognostic determinant than muscle mass.4,5 Studies have measured maximal quadriceps isometric strength (QIS)4,5 and grip strength5 as indicators of muscle strength in outpatients. Although maximum QIS and grip strength measurements should be performed with the patient’s maximum effort, they are frequently difficult to assess in hospitalized patients with AHF and unstable respiratory and circulatory dynamics at the time of admission. In contrast, the measurement of muscle mass by ultrasound is not dependent on the patient’s efforts and can be performed in a bedridden state, even when the patient cannot communicate. Given the versatility of ultrasound, it may be better to assess muscle mass than muscle strength to determine skeletal muscle function during the acute phase of AHF.
Recently, in a study of patients in an intensive care unit (ICU), Lee et al6 observed that every 1% loss in muscle volume was associated with 5.0% higher odds of 60-day mortality and that it is important to measure changes in muscle volume, not just a single-period measurement, in order to accurately predict prognosis. Furthermore, in our previous study of patients with AHF using ultrasound to examine quadriceps muscle mass, we found a 13.8% loss of muscle mass over a 2-week hospitalization period.7 Similar to patients in the ICU, patients with AHF are more likely to experience a loss of muscle mass; thus, changes in muscle mass during hospitalization may be a more accurate predictor of prognosis than a single measurement at baseline. However, most studies examining the relationship between muscle mass and prognosis in patients with AHF have been based on single-period measurements,8–10 and the extent of any change and its relationship with prognosis are unknown. Therefore, the aim of this study was to investigate the relationship between changes in the rectus femoris cross-sectional area (RFCSA) on ultrasound and the prognosis of patients with AHF.
Methods
Study Population
This retrospective observational study was conducted at a single center at Sagamihara Kyodo Hospital from May 2021 to July 2022 and enrolled 353 patients with AHF. Experienced cardiologists diagnosed AHF using the Framingham criteria.11 Patients with missing data on RFCSA and prognosis or those who experienced in-hospital death were excluded from the study. The study protocol adhered to the ethical guidelines of the 1975 Declaration of Helsinki and was approved by the Institutional Ethics Committee of Sagamihara Kyodo Hospital (Approval no. 237). All patients provided written informed consent; they were informed of the study protocol through the hospital homepage, as advised by the committee, and an opt-out procedure was implemented to allow patients to withdraw from the study.
Patient Characteristics
Data collected at admission, including age, sex, and body mass index (BMI), and clinical details collected at presentation (e.g., blood pressure, heart rate, left ventricular ejection fraction [LVEF], New York Heart Association [NYHA] classification, co-morbidities, medication use, Charlson Comorbidity Index,12 AHEAD score,13 and Mini Nutritional Assessment Short-Form [MNA-SF]),14 and biochemical data were investigated from electronic medical records. The Charlson Comorbidity Index was categorized according to the sum of pretreatment comorbidity values in this study, and comorbidities were scored as follows: (1) a score of 1 for myocardial infarction, congestive HF, peripheral vascular disease, chronic pulmonary disease, ulcer disease, mild liver disease, diabetes without complications, cerebrovascular disease, and collagen disease; (2) a score of 2 for diabetes with end organ damage, hemiplegia, moderate to severe renal disease, second solid tumor (non-metastatic), leukemia, and malignant lymphoma; (3) a score of 3 for moderate to severe liver disease; and (4) a score of 6 for second metastatic solid tumor and AIDS.12 The AHEAD score was calculated by assigning 1 point for each of the following: atrial fibrillation (A); hemoglobin <130 g/L for men and 120 g/L for women (H); elderly (age >70 years; E); abnormal renal parameters (creatinine >130 μmol/L; A); and diabetes (D).13 The MNA-SF14 consists of 6 parameters: weight loss, appetite, mobility, psychological stress, neuropsychological problems, and BMI. All parameters were scored from zero to 2 or 3 with a total combined score of 0–14. Note that, Higher scores indicate better nutritional status.
Outcomes
The primary endpoint of the study was a composite of all-cause mortality and readmission for HF within 1 year. The secondary endpoints were all-cause mortality and readmission for HF. The time to reach the endpoint was calculated as the number of days between the date of discharge and the date of the event. Patients whose prognoses were difficult to assess from the electronic medical records were investigated by telephone. If a telephone survey was not possible, participant was excluded from the study.
Measurement of RFCSA
A physical therapist with >5 years of experience in ultrasonography measured the RFCSA on admission (pre-RFCSA) and 2 weeks later (post-RFCSA) using a B-mode ultrasound machine (SONIMAGE MX1; Konica Minolta, Inc., Tokyo, Japan) with a convex-array probe (C5-2; Konica Minolta, Inc., Tokyo, Japan). The ultrasound investigator was blinded to other results. The measurement protocol was adapted from the Nutrition and Exercise in Critical Illness (NEXIS) trial,15 which involved placing the transducer on the anterior aspect of the thigh, perpendicular to its long axis, at a point two-thirds the distance from the anterior superior iliac spine to the superior aspect of the patellar border, with the patient in the supine position, the hip joint in the middle position, and the knee in the extended position. A large amount of gel was used for acoustic coupling, and the probe was placed using minimum pressure to avoid distortion of the rectus femoris. Images were acquired when the deep and superficial aponeurosis, muscle fascicle, and bright femur were visualized (Figure 1). Images were measured using the ultrasound distance measurement method (minimum unit, 0.1 mm) and analyzed using ImageJ version 1.48 (National Institutes of Health, Bethesda, MD, USA). The inner fascia of the rectus femoris was traced using the “polygon selection” function to determine RFCSA, which was defined as the average of 3 consecutive measurements. The percentage change in RFCSA (∆RFCSA) was calculated using the following equation:

ΔRFCSA (%) = [(post-RFCSA − pre-RFCSA) / pre-RFCSA] × 100
Statistical Analyses
Continuous variables with a normal distribution are reported as the mean±SD, whereas non-normally distributed variables are presented as the median and interquartile range. Categorical variables are presented as numbers and percentages. The cohort was divided into 4 groups based on their median pre-RFCSA and ∆RFCSA after sex stratification: Group A, higher pre-RFCSA and better ∆RFCSA; Group B, higher pre-RFCSA and worse ∆RFCSA; Group C, lower pre-RFCSA and better ∆RFCSA; and Group D, lower pre-RFCSA and worse ∆RFCSA. The baseline characteristics of each group were compared using one-way analysis of variance or the Kruskal-Wallis test for continuous variables and the Chi-squared test for categorical variables.
Survival analyses were performed using the Kaplan-Meier method and compared using the log-rank test. Cox proportional hazards models were used to assess the impact of pre-RFCSA and ∆RFCSA on prognosis. Sensitivity analyses were conducted using the Cox proportional hazards models: (1) without adjustment; (2) adjusted for age and sex; (3) adjusted for sex, AHEAD score, and MNA-SF; (4) adjusted for age, sex, Charlson Comorbidity Index, LVEF, N-terminal pro B-type natriuretic peptide (NT-proBNP), and MNA-SF. The variables included in the model were selected a priori based on the participants’ basic attributes, severity of HF, and risk factors for muscle mass loss.
All statistical analyses were performed using R version 3.6.3 (R Foundation for Statistical Computing, Vienna, Austria). A two-tailed P value <0.05 was considered statistically significant.
Results
Study Population
In this population survey, 69 of 353 patients with AHF who were screened for eligibility did not meet the inclusion criteria (Figure 2), leaving data from 284 participants for inclusion in the analysis. Table 1 presents the baseline characteristics of all patients and the results of comparisons among the 4 groups. The mean age of the study population was 79.1±11.9 years, with 40.8% being female. The mean LVEF was 50.4±16.6%, and 52.1% of patients had preserved ejection fraction. Hypertension was the most common underlying cause of AHF in the study patients (73.6%), followed by atrial fibrillation (53.2%). The median pre-RFCSA for male and female participants was 1.76 cm2
and 1.42 cm2, respectively, with corresponding median ∆RFCSA values of −11.8% and −15.7%, respectively. The groups showing the least favorable change in RFCSA (Groups B and D) comprised older patients with poorer nutritional status and cognitive function (all P<0.05).
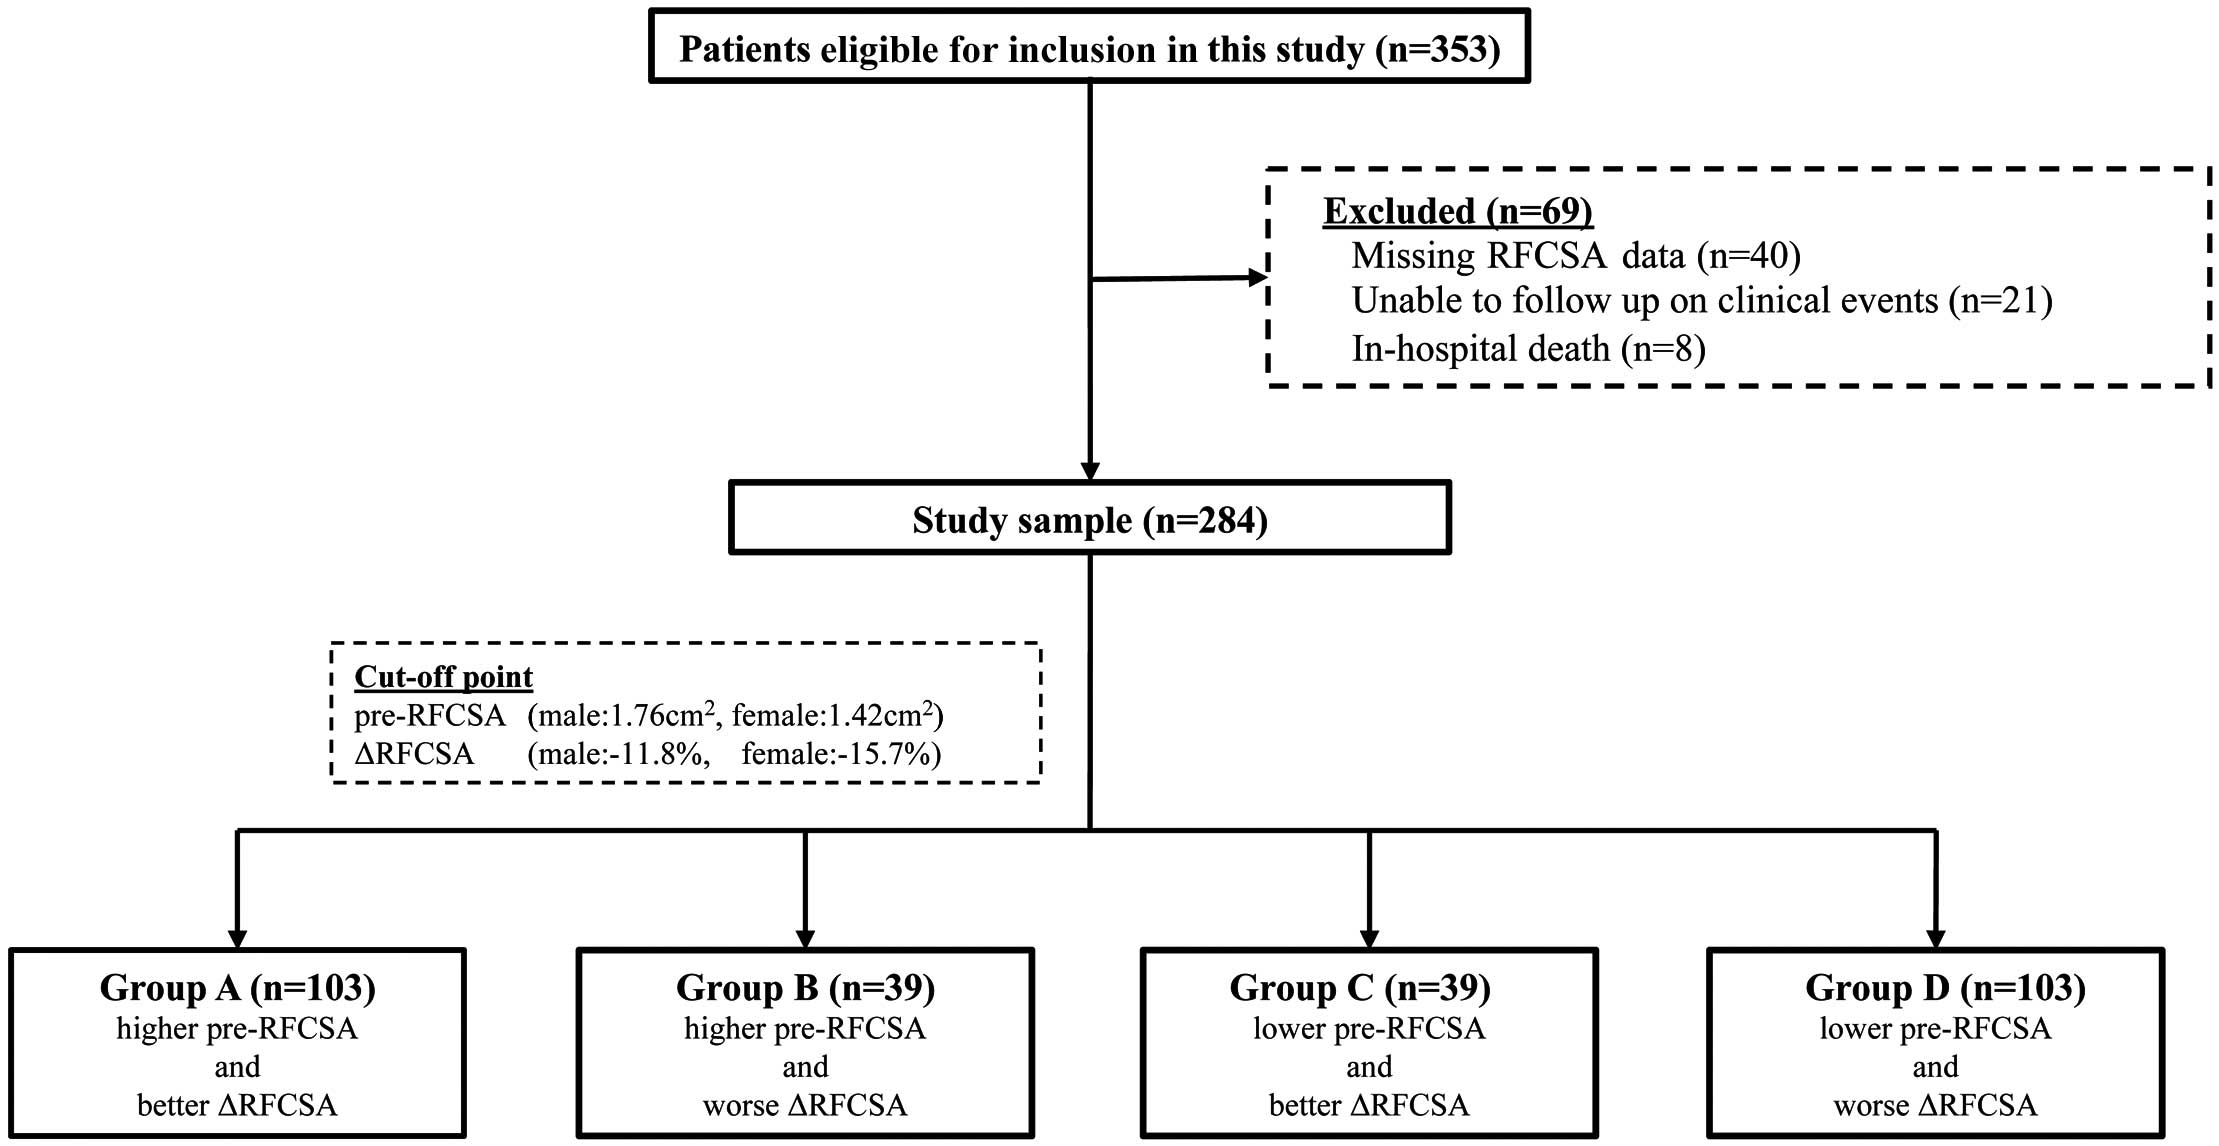
Table 1.
Demographic and Clinical Characteristics
| |
Total cohort
(n=284) |
Group A
(n=103) |
Group B
(n=39) |
Group C
(n=39) |
Group D
(n=103) |
P value |
| Risk factor at admission |
| Age (years) |
79.1±11.9 |
72.1±13.0 |
82.3±10.1 |
80.7±8.3 |
84.4±8.9 |
<0.001 |
| Female sex |
116 (40.8) |
36 (35.0) |
22 (56.4) |
22 (56.4) |
36 (35.0) |
0.013 |
| BMI (kg/m2) |
23.0±4.5 |
25.1±4.6 |
23.2±4.2 |
22.8±4.2 |
20.9±3.6 |
<0.001 |
| LVEF (%) |
50.4±16.6 |
49.0±16.2 |
54.1±15.6 |
53.0±17.4 |
49.4±17.0 |
0.254 |
| LVEF ≥50% |
148 (52.1) |
49 (47.6) |
23 (59.0) |
22 (56.4) |
54 (52.4) |
0.598 |
| NYHA |
|
|
|
|
|
0.774 |
| Class I |
0 (0.0) |
0 (0.0) |
0 (0.0) |
0 (0.0) |
0 (0.0) |
|
| Class II |
13 (4.6) |
6 (5.8) |
2 (5.1) |
2 (5.1) |
3 (2.9) |
|
| Class III |
88 (31.0) |
35 (34.0) |
13 (33.3) |
13 (33.3) |
27 (26.2) |
|
| Class IV |
183 (64.4) |
62 (60.2) |
24 (61.5) |
24 (61.5) |
73 (70.9) |
|
| Mechanical ventilation |
68 (23.9) |
24 (23.3) |
10 (25.6) |
6 (15.4) |
28 (27.2) |
0.523 |
| Intubated MV |
0 (0.0) |
0 (0.0) |
1 (2.6) |
0 (0.0) |
0 (0.0) |
0.275 |
| Non-intubated MV |
68 (23.9) |
24 (23.3) |
9 (23.0) |
6 (15.4) |
28 (27.2) |
0.512 |
| SBP (mmHg) |
143.6±32.8 |
142.3±34.6 |
145.0±33.9 |
138.7±30.4 |
146.2±31.6 |
0.626 |
| DBP (mmHg) |
88.5±24.4 |
90.8±24.4 |
90.2±24.1 |
81.7±22.3 |
88.1±25.0 |
0.243 |
| Heart rate (beats/min) |
95.2±32.4 |
96.0±32.0 |
100.2±31.7 |
92.9±34.2 |
93.3±32.7 |
0.672 |
| MNA-SF (points) |
9 [6, 10] |
10 [9, 11] |
8 [6, 10] |
9 [8, 10] |
7 [4, 8] |
<0.001 |
| CCI |
3 [2, 4] |
3 [2, 4] |
3 [2, 4] |
2 [1, 4] |
4 [3, 5] |
<0.001 |
| AHEAD score |
3 [2, 4] |
2 [2, 3] |
3 [2, 4] |
3 [2, 4] |
3 [2, 4] |
<0.001 |
| Medication at admission |
| β-blocker |
182 (64.1) |
68 (66.0) |
28 (71.8) |
25 (64.1) |
61 (59.2) |
0.526 |
| ACEi/ARB |
182 (64.1) |
68 (66.0) |
28 (71.8) |
25 (64.1) |
61 (59.2) |
0.036 |
| Aldosterone blocker |
166 (58.5) |
65 (63.1) |
26 (66.7) |
20 (51.3) |
55 (53.4) |
0.271 |
| Diuretic |
226 (79.6) |
82 (79.6) |
34 (87.2) |
30 (76.9) |
80 (77.7) |
0.618 |
| Catecholamine |
56 (19.7) |
24 (23.3) |
9 (23.1) |
3 (7.7) |
20 (19.4) |
0.197 |
| Comorbidities |
| Ischemic etiology |
99 (34.9) |
38 (36.9) |
11 (28.2) |
15 (38.5) |
35 (34.0) |
0.752 |
| Dementia |
48 (16.9) |
4 (3.9) |
7 (17.9) |
1 (2.6) |
36 (35.0) |
<0.001 |
| Diabetes |
117 (41.2) |
45 (43.7) |
18 (46.2) |
13 (33.3) |
41 (39.8) |
0.629 |
| Hypertension |
209 (73.6) |
72 (69.9) |
31 (79.5) |
31 (79.5) |
75 (72.8) |
0.542 |
| Dyslipidemia |
84 (29.6) |
37 (35.9) |
16 (41.0) |
8 (20.5) |
23 (22.3) |
0.035 |
| Current smoker |
26 (9.2) |
11 (10.7) |
1 (2.6) |
7 (17.9) |
7 (6.8) |
0.084 |
| COPD |
20 (7.0) |
4 (3.9) |
1 (2.6) |
3 (7.7) |
12 (11.7) |
0.105 |
| Atrial fibrillation |
151 (53.2) |
45 (43.7) |
26 (66.1) |
21 (53.8) |
55 (53.4) |
0.038 |
| Prior HF admission |
188 (66.2) |
65 (63.1) |
26 (66.7) |
21 (53.8) |
76 (73.8) |
0.124 |
| Laboratory data at admission |
| NT-proBNP (pg/mL) |
4,890.0
[2,467.5,
10,480.0] |
3,624.0
[1,639.0,
6,863.0] |
4,147.0
[2,347.5,
8,539.0] |
4,937.0
[2,326.0,
8,171.5] |
8,619.0
[3,778.5,
18,993.5] |
<0.001 |
| HbA1c (%) |
6.3±1.1 |
6.5±1.3 |
6.4±1.0 |
6.2±1.0 |
6.1±0.7 |
0.022 |
| Total protein (g/dL) |
6.7±0.7 |
6.8±0.7 |
6.7±0.8 |
6.6±0.6 |
6.7±0.7 |
0.477 |
| Albumin (g/dL) |
3.5±0.6 |
3.7±0.5 |
3.3±0.6 |
3.6±0.5 |
3.3±0.5 |
<0.001 |
| Sodium (mEq/L) |
138.9±4.6 |
139.1±4.7 |
139.6±3.4 |
140.3±2.7 |
138.0±5.4 |
0.040 |
| Potassium (mEq/L) |
4.3±0.7 |
4.4±0.8 |
4.2±0.7 |
4.3±0.7 |
4.3±0.7 |
0.635 |
| TC (mg/dL) |
152.3±41.8 |
161.3±40.2 |
137.3±44.3 |
158.4±36.5 |
146.7±40.8 |
0.005 |
| HDL-C (mg/dL) |
63.5±31.9 |
67.5±31.9 |
58.4±24.6 |
61.4±36.5 |
61.9±32.5 |
0.434 |
| LDL-C (mg/dL) |
71.1±31.5 |
72.8±33.9 |
70.0±29.3 |
76.0±26.6 |
67.8±31.2 |
0.522 |
| Triglyceride (mg/dL) |
96.9±61.3 |
107.7±76.4 |
83.2±45.2 |
103.1±61.9 |
87.8±43.8 |
0.066 |
| CRP (mg/dL) |
2.2±4.1 |
1.7±3.8 |
2.0±2.2 |
1.7±3.2 |
2.9±5.1 |
0.161 |
| Creatinine (mg/dL) |
1.4±1.1 |
1.3±1.2 |
1.3±0.6 |
1.2±0.6 |
1.6±1.3 |
0.095 |
| eGFR (mL/min/1.73 m2) |
45.8±21.8 |
51.1±23.2 |
42.1±20.2 |
47.1±18.8 |
41.3±21.2 |
0.009 |
| BUN (mg/dL) |
27.5±15.8 |
24.8±13.5 |
28.8±13.3 |
24.9±14.9 |
30.8±18.5 |
0.030 |
| Uric acid (mg/dL) |
6.7±2.3 |
6.6±2.1 |
7.1±2.4 |
7.0±2.6 |
6.6±2.2 |
0.442 |
| Hemoglobin (g/dL) |
12.2±3.2 |
13.3±4.2 |
11.0±2.5 |
11.8±1.8 |
11.6±2.4 |
<0.001 |
| WBC (×103/μL) |
79.4±32.4 |
80.0±36.6 |
74.1±29.7 |
72.3±26.3 |
83.4±30.7 |
0.209 |
| RBC (×104/μL) |
369.6±81.3 |
424.8±77.3 |
381.6±98.3 |
397.1±59.3 |
373.9±77.7 |
<0.001 |
| Hematocrit (%) |
37.8±7.9 |
39.9±7.1 |
35.6±6.6 |
37.1±5.1 |
36.9±9.5 |
<0.001 |
| Platelets (×104/μL) |
20.5±7.6 |
20.9±7.6 |
21.6±8.9 |
19.5±7.0 |
20.2±7.3 |
0.573 |
| Lymphocytes (%) |
19.8±11.0 |
21.5±10.9 |
16.7±7.6 |
23.1±11.8 |
18.1±11.6 |
0.008 |
Total lymphocyte count
(mm3) |
1,525.9±1,136.2 |
1,699.9±1,269.8 |
1,157.4±597.1 |
1,634.0±1,144.6 |
1,450.6±1,120.7 |
0.061 |
| Muscle mass |
| Pre-RFCSA (cm2) |
1.61 [1.23, 2.00] |
2.12 [1.84, 2.57] |
1.91 [1.68, 2.06] |
1.32 [1.14, 1.56] |
1.17 [0.96, 1.39] |
<0.001 |
| Male (cm2) |
1.76 [1.32, 2.28] |
2.30 [1.96, 2.70] |
2.06 [2.00, 2.53] |
1.60 [1.41, 1.67] |
1.30 [0.95, 1.51] |
<0.001 |
| Female (cm2) |
1.42 [1.15, 1.74] |
1.80 [1.59, 2.09] |
1.69 [1.52, 1.81] |
1.16 [1.02, 1.31] |
1.14 [0.97, 1.25] |
<0.001 |
| Post-RFCSA (cm2) |
1.36 [0.99, 1.78] |
1.91 [1.69, 2.35] |
1.45 [1.32, 1.76] |
1.16 [1.02, 1.41] |
0.90 [0.70, 1.14] |
<0.001 |
| Male (cm2) |
1.59 [1.13, 2.13] |
2.16 [1.79, 2.60] |
1.81 [1.68, 2.22] |
1.43 [1.29, 1.51] |
1.01 [0.71, 1.20] |
<0.001 |
| Female (cm2) |
1.18 [0.91, 1.43] |
1.62 [1.39, 1.88] |
1.35 [1.22, 1.39] |
1.05 [0.88, 1.16] |
0.87 [0.69, 0.97] |
<0.001 |
| ΔRFCSA (%) |
−13.6
[−20.1, −8.9] |
−8.1
[−10.4, −6.1] |
−18.37
[−22.5, −14.4] |
−10.12
[−12.8, −8.7] |
−21.2
[−26.4, −17.0] |
<0.001 |
| Male (%) |
−11.8
[−17.8, −8.1] |
−8.0
[−9.4, −5.8] |
−14.1
[−16.5, −12.3] |
−9.6
[−10.1, −6.8] |
−18.7
[−26.9, −15.6] |
<0.001 |
| Female (%) |
−15.7
[−22.0, −10.9] |
−9.5
[−13.7, −6.4] |
−20.0
[−24.8, −18.4] |
−12.4
[−14.0, −10.0] |
−23.2
[−26.1, −20.5] |
<0.001 |
| Prognosis |
| All-cause death |
21 (7.4) |
2 (1.9) |
3 (7.7) |
1 (2.6) |
15 (14.6) |
0.004 |
| HF related readmission |
40 (14.1) |
2 (1.9) |
7 (17.9) |
3 (7.7) |
28 (27.2) |
<0.001 |
Normally distributed continuous variables are presented as the mean±SD; non-normally distributed variables are presented as the median [interquartile range]. Categorical variables are presented as n (%). Percentages may not total 100 because of rounding. Baseline characteristics were compared between groups using one-way analysis of variance or the Kruskal-Wallis test for continuous variables; the χ2 test was used for categorical variables. ACEi, angiotensin-converting enzyme inhibitor; ARB, angiotensin receptor blocker; BMI, body mass index; BUN, blood urea nitrogen; CCI, Charlson Comorbidity Index; COPD, chronic obstructive pulmonary disease; CRP, C-reactive protein; DBP, diastolic blood pressure; eGFR, estimated glomerular filtration rate; Group A, higher rectus femoris cross-sectional area (RFCSA) at admission (pre-RFCSA)/better change in RFSCA from admission to 2 weeks (ΔRFCSA); Group B, higher pre-RFCSA/worse ΔRFCSA; Group C, lower pre-RFCSA/better ΔRFCSA; Group D, lower pre-RFCSA/worse ΔRFCSA; HDL-C, high-density lipoprotein cholesterol; HF, heart failure; LDL-C, low-density lipoprotein cholesterol; LVEF, left ventricular ejection fraction; MNA-SF, Mini Nutritional Assessment Short-Form; MV, mechanical ventilation; NT-proBNP, N-terminal pro B-type natriuretic peptide; NYHA, New York Heart Association functional class; post-RFCSA, RFCSA at 2 weeks; RBC, red blood cells; SBP, systolic blood pressure; TC, total cholesterol; WBC, white blood cells.
Prognostic Value of pre-RFCSA and ∆RFCSA
Over a mean follow-up period of 6.0±3.0 months, 21 (7.4%) patients died and 40 (14.1%) were readmitted to hospital because of HF. The Kaplan-Meier curves demonstrated that the rates of composite events, all-cause mortality, and HF-related readmissions were higher in Group A followed by Groups C, B, and D, in that order (log-rank, all P<0.001; Figures 3–5).
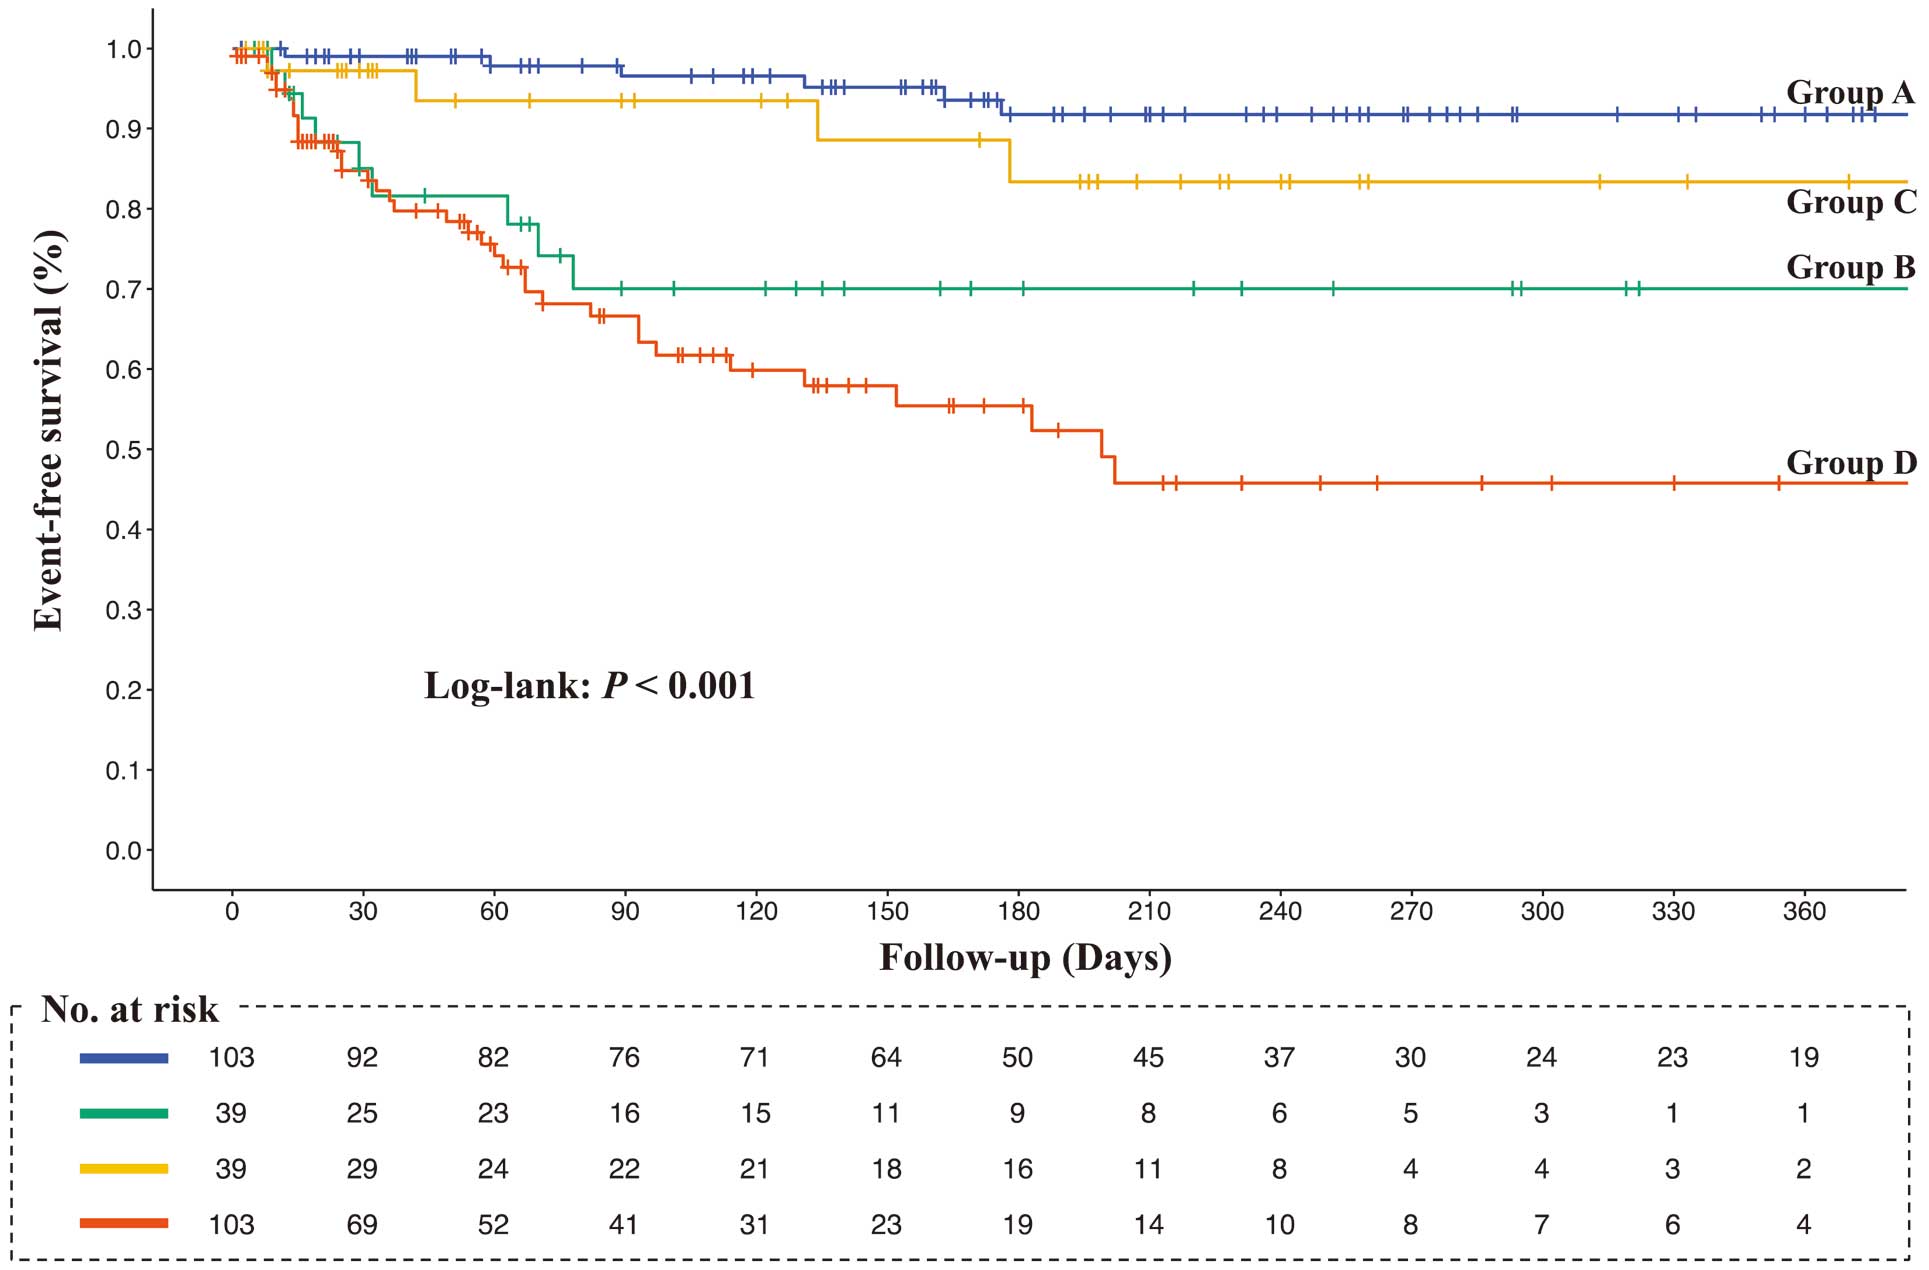
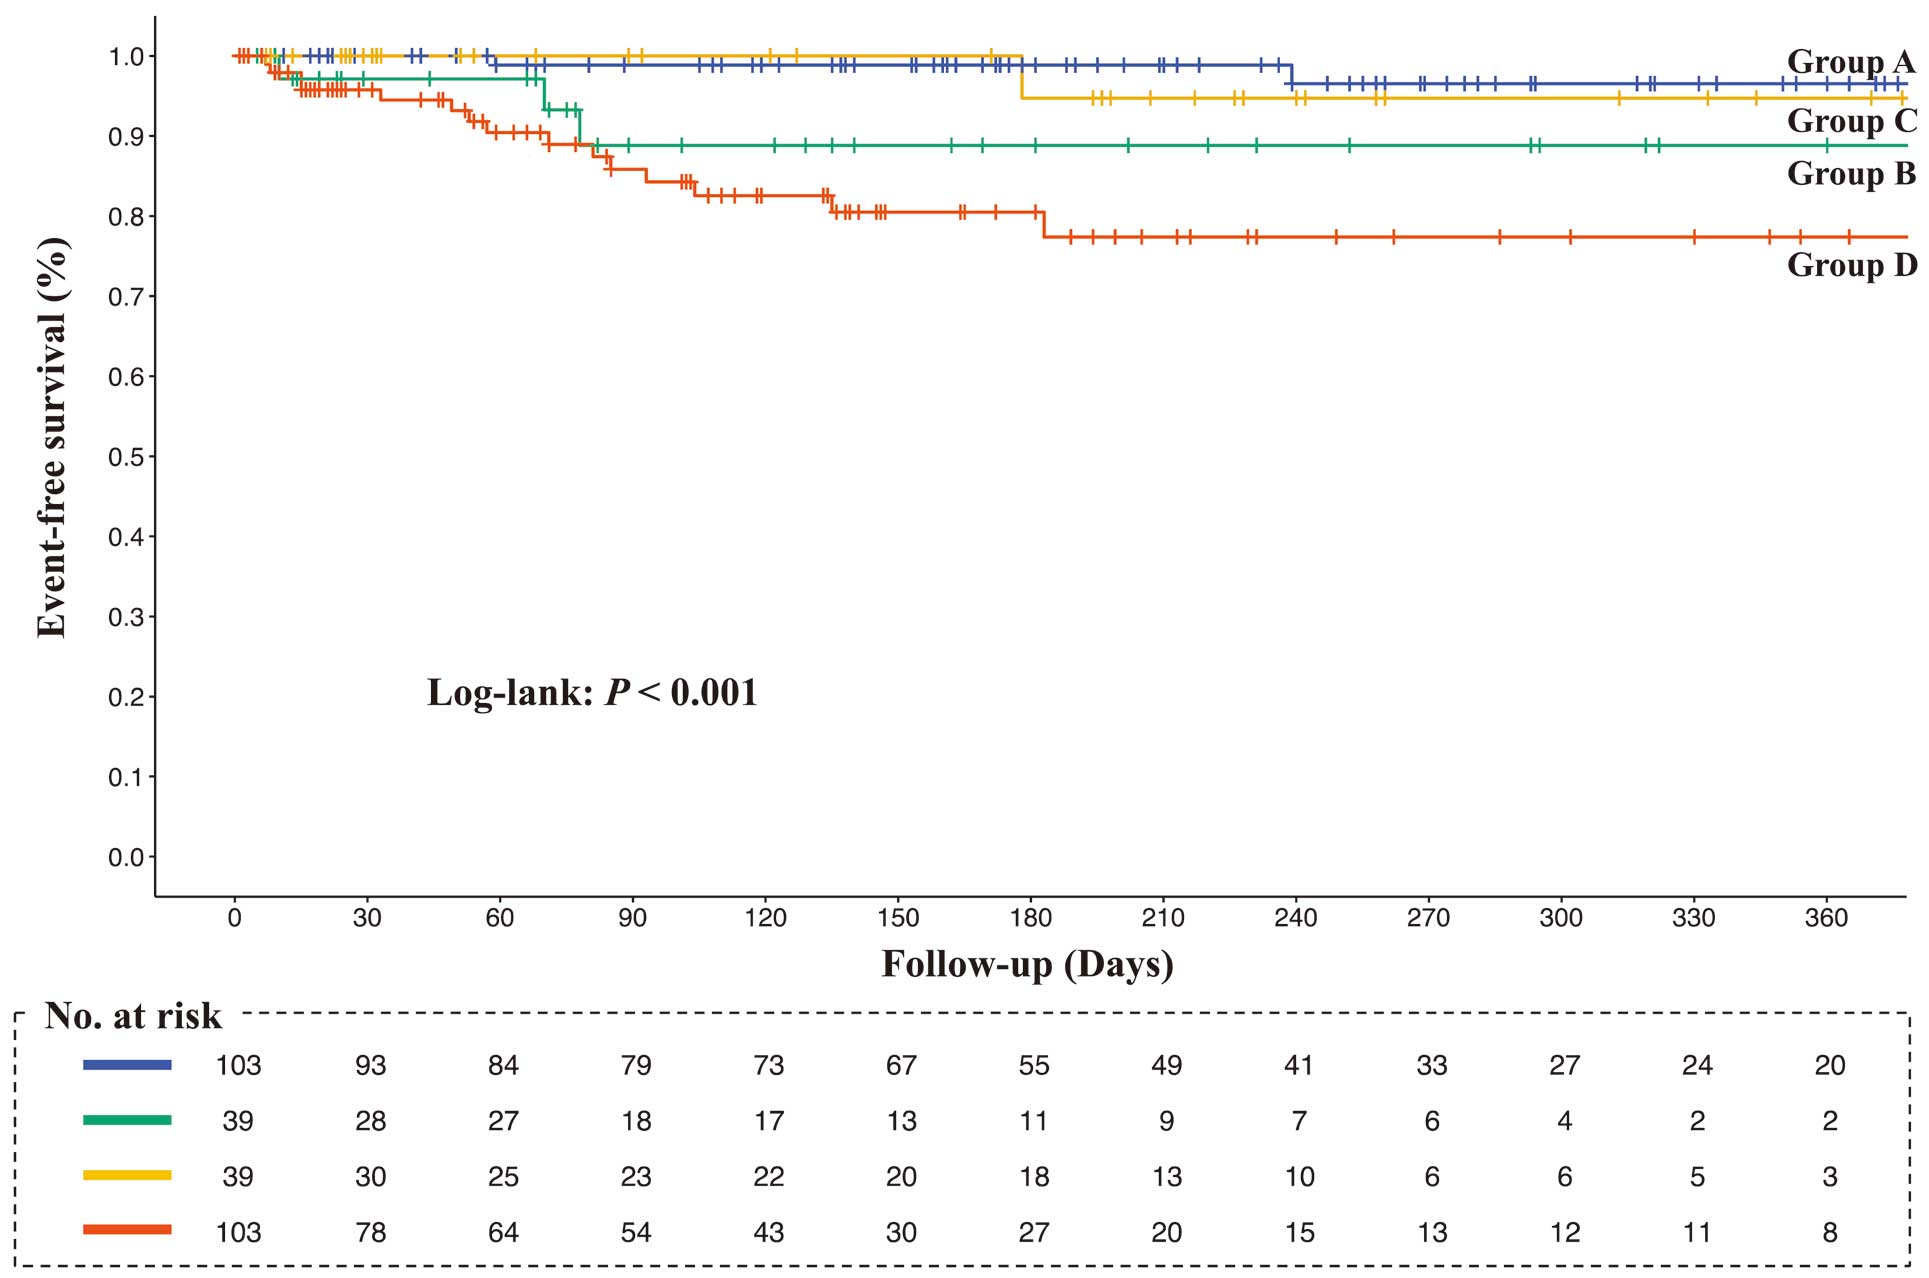
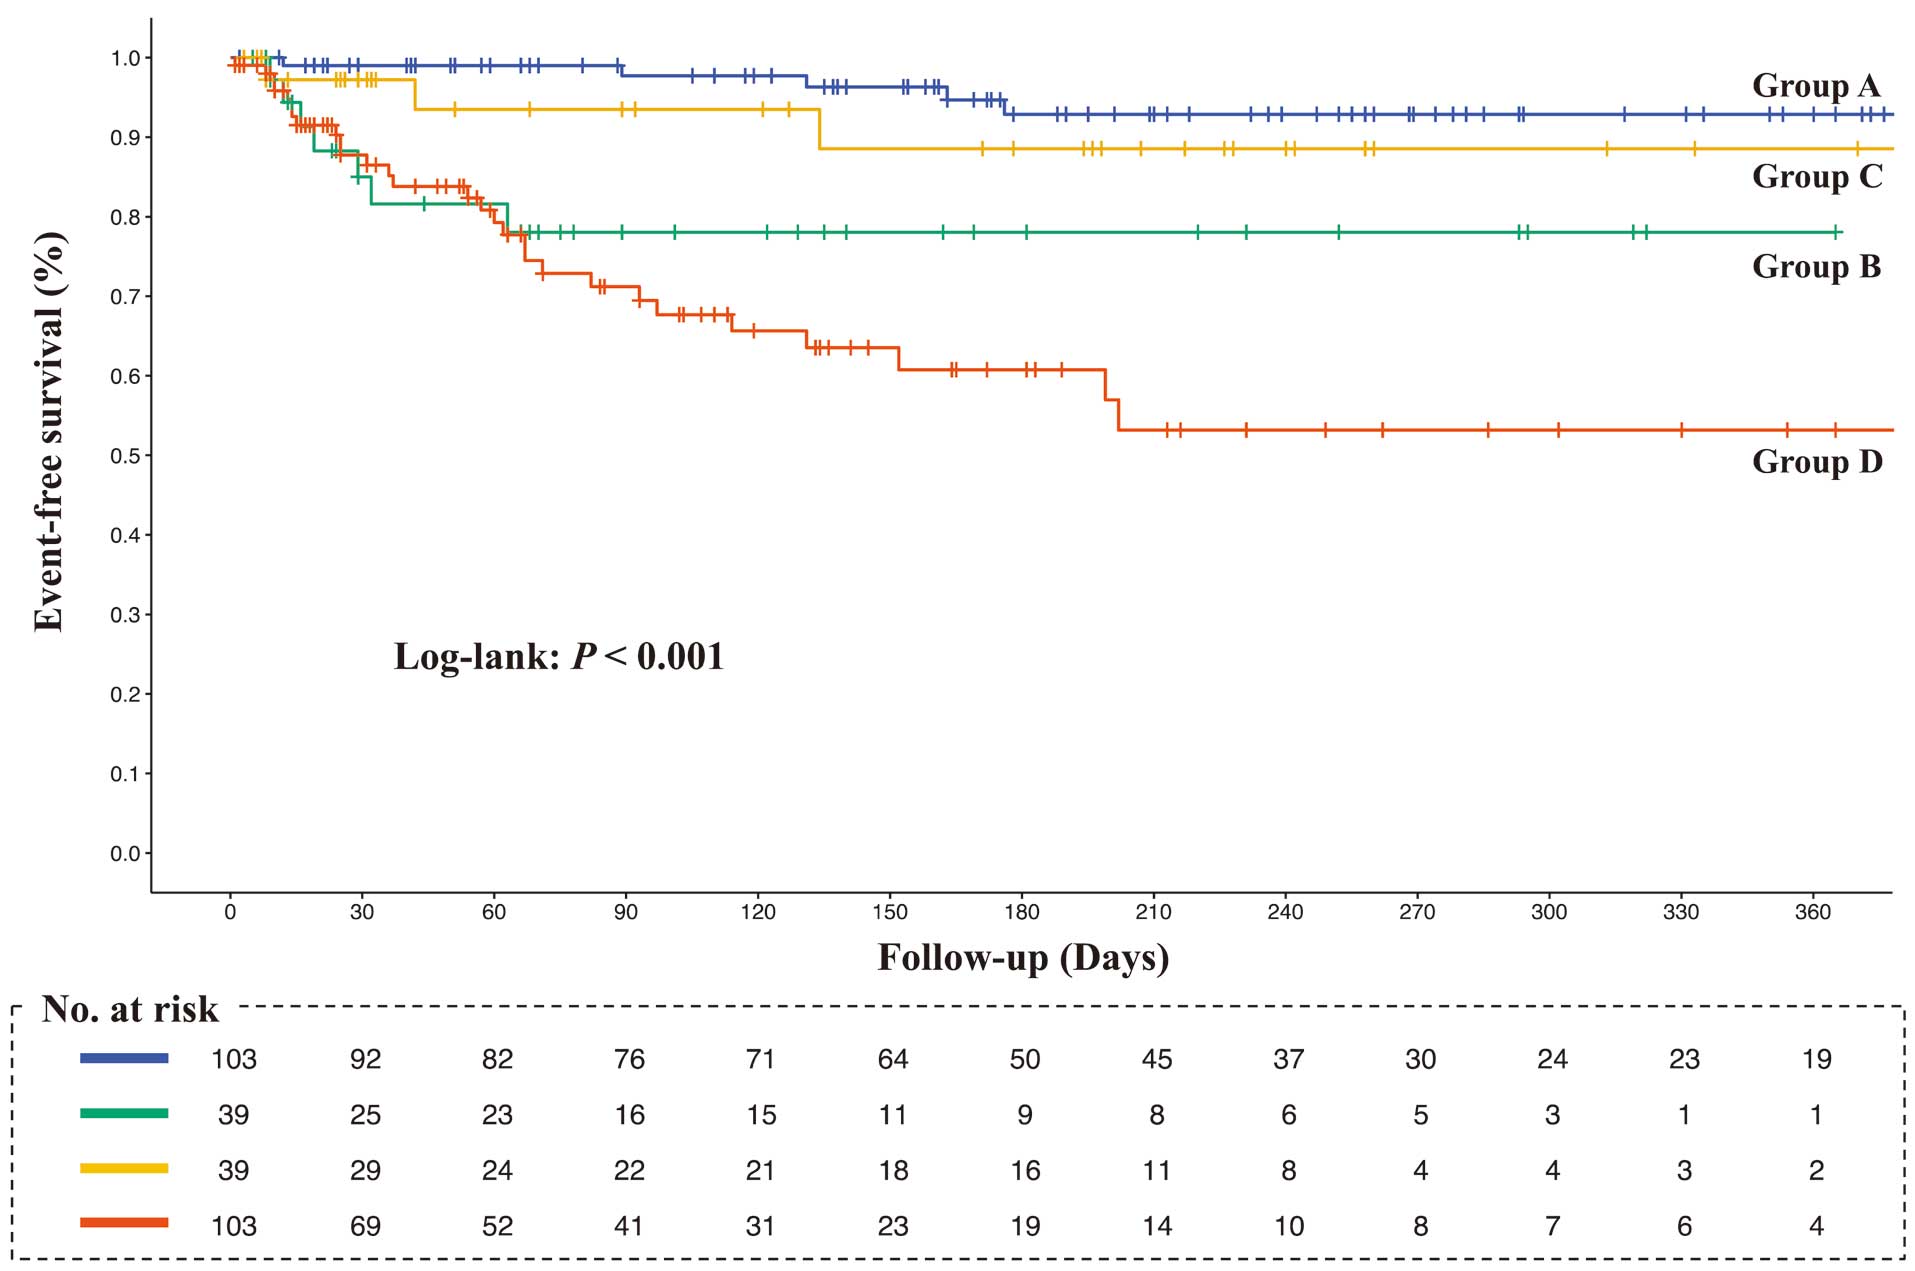
Table 2 presents the outcomes of the Cox proportional hazards model adjusted for age, sex, Charlson Comorbidity Index, LVEF, NT-proBNP, and MNA-SF score. In the survival analysis for composite outcome using Group A as the reference, the cumulative event rate of Group C was not significantly different (hazard ratio [HR] 3.39; 95% confidence interval [CI] 0.71–16.09; P=0.124), but the cumulative event rates of Group B (HR 7.93; 95% CI 1.99–31.60; P=0.003) and Group D (HR 9.24; 95% CI 2.57–33.26; P<0.001) were significantly higher. In addition, in the survival analysis for all-cause mortality using Group A as the reference, the cumulative event rates in Group B (HR 3.64; 95% CI 0.58–22.95; P=0.170) and Group C (HR 0.95; 95% CI 0.08–11.19; P=0.970) were not significantly different, but the cumulative event rate of Group D (HR 6.22; 95% CI 1.26–30.85; P=0.025) was significantly higher. Finally, in the survival analysis for HF-related readmission rates using Group A as the reference, the cumulative event rate was not significantly different in Group C (HR 3.39; 95% CI 0.71–16.09; P=0.124), but the cumulative event rates in Group B (HR 7.93; 95% CI 1.99–31.60; P=0.003) and Group D (HR 9.24; 95% CI 2.57–33.26; P<0.001) were significantly higher.
Table 2.
Unadjusted and Adjusted HRs for Prognosis
| |
Model 1 |
Model 2 |
Model 3 |
Model 4 |
| HR (95% CI) |
P value |
HR (95% CI) |
P value |
HR (95% CI) |
P value |
HR (95% CI) |
P value |
| Composite outcome |
| Group A |
1.00 (Ref.) |
|
1.00 (Ref.) |
|
1.00 (Ref.) |
|
1.00 (Ref.) |
|
| Group B |
11.92
(3.22–44.21) |
<0.001 |
7.42
(1.93–28.61) |
0.004 |
9.81
(2.54–37.88) |
<0.001 |
7.93
(1.99–31.60) |
0.003 |
| Group C |
4.48
(1.00–20.03) |
0.050 |
3.16
(0.70–14.38) |
0.136 |
3.83
(0.84–17.39) |
0.082 |
3.39
(0.71–16.09) |
0.124 |
| Group D |
18.32
(5.61–59.79) |
<0.001 |
11.96
(3.53–40.56) |
<0.001 |
14.07
(4.10–48.35) |
<0.001 |
9.24
(2.57–33.26) |
<0.001 |
| All-cause death |
| Group A |
1.00 (Ref.) |
|
1.00 (Ref.) |
|
1.00 (Ref.) |
|
1.00 (Ref.) |
|
| Group B |
5.69
(0.95–34.14) |
0.057 |
2.91
(0.45–18.75) |
0.261 |
3.80
(0.58–25.10) |
0.166 |
3.64
(0.58–22.95) |
0.170 |
| Group C |
1.65
(0.15–18.20) |
0.683 |
0.92
(0.08–10.47) |
0.948 |
1.14
(0.10–12.91) |
0.916 |
0.95
(0.08–11.19) |
0.970 |
| Group D |
10.79
(2.46–47.40) |
0.002 |
6.90
(1.46–32.49) |
0.015 |
7.84
(1.60–38.52) |
0.011 |
6.22
(1.26–30.85) |
0.025 |
| HF-related readmission |
| Group A |
1.00 (Ref.) |
|
1.00 (Ref.) |
|
1.00 (Ref.) |
|
1.00 (Ref.) |
|
| Group B |
12.72
(2.84–66.34) |
0.001 |
7.42
(1.93–28.61) |
0.004 |
11.33
(2.25–56.99) |
0.003 |
7.93
(1.99–31.60) |
0.003 |
| Group C |
5.07
(0.85–30.39) |
0.076 |
3.16
(0.70–14.38) |
0.136 |
4.47
(0.73–27.21) |
0.104 |
3.39
(0.71–16.09) |
0.124 |
| Group D |
21.52
(5.11–90.72) |
<0.001 |
11.96
(3.53–40.56) |
<0.001 |
16.78
(3.78–74.44) |
<0.001 |
9.24
(2.57–33.26) |
<0.001 |
Analyses were performed using the Cox proportional hazards model. Model 1 was unadjusted. Model 2 was adjusted for age and sex. Model 3 was adjusted for sex, AHEAD score, and Mini Nutritional Assessment Short-Form. Model 4 was adjusted for all factors in Model 2, as well as classical Charlson Comorbidity Index, log-transformed N-terminal pro B-type natriuretic peptide concentration, left ventricular ejection fraction, and Mini Nutritional Assessment Short-Form score. CI, confidence interval; Group A, higher rectus femoris cross-sectional area (RFCSA) at admission (pre-RFCSA)/better change in RFSCA from admission to 2 weeks (ΔRFCSA); Group B, higher pre-RFCSA/worse ΔRFCSA; Group C, lower pre-RFCSA/better ΔRFCSA; Group D, lower pre-RFCSA/worse ΔRFCSA; HF, heart failure; HR, hazard ratio.
Discussion
Principal Findings
Over the 2-week hospitalization period, RFCSA decreased by a median value of –13.6%. Even in the Cox proportional hazards analysis after adjusting for age, sex, comorbidities, HF severity, and nutritional status, changes in RFCSA were prognostic determinants independent of baseline muscle mass. These results suggest that the changes in muscle mass should be evaluated to predict the prognosis of patients with AHF.
Impact of Changes in RFCSA on Prognosis
Previous studies examining muscle mass and prognosis in patients with AHF have often considered muscle mass only at discharge.8–10 Focusing on post-RFCSA in the present study, Groups A, B, C, and D, in that order, had smaller muscle mass. Based on previous findings, the prognosis for patients in this study should be worse in the same order; however, Group B had a worse prognosis than Group C. This is the most important finding of the present study. In summary, patients with AHF exhibit metabolic abnormalities that contribute to muscle volume loss, such as cytokine activation,16 insulin resistance,17 abnormal oxidative metabolism in the skeletal muscles,17 and impaired mitochondrial biogenesis.18 Because patients with AHF are likely to experience muscle volume loss, changes in muscle mass during hospitalization may be a more accurate predictor of prognosis than a single measurement. Considering this, we believe that previous studies were unable to differentiate between patients with preserved muscle mass at discharge and those with worse changes in muscle mass. Therefore, the interpretation of the results of the previous studies has to be reconsidered.
Mechanisms of RFCSA Impact on Prognosis
The precise mechanisms responsible for the association between ∆RFCSA and prognosis cannot be determined from this study; however, some possible explanations are suggested. Studies on femoral muscle in patients with AHF have shown a correlation between ∆RFCSA and exercise capacity,19,20 which is a significant prognostic marker in HF.21,22 Consequently, it may be necessary to prevent a decline in RFCSA during hospitalization through interventions such as cardiac rehabilitation that include electrical muscle stimulation.7 Moreover, the RF diameter association with nutritional status and HF symptoms23 has been substantiated. Thus, ∆RFCSA may serve as an indicator of the nutritional or HF status in relation to medical interventions. Furthermore, a short-term change in muscle mass may represent a subclinical indicator of physiological reserve, in terms of resilience or the ability to improve or recover from stressful events, potentially reflecting a patient’s prognosis. This hypothesis has been supported by research analyzing short-term variations in gait speed and their prognostic significance.24 Further research is needed to clarify whether short-term alterations in muscle mass represent a therapeutic objective or are merely a biomarker of a patient’s clinical condition or prognosis.
Versatility and Utility of RFCSA Using Ultrasound
This study demonstrated the versatility and utility of ultrasound-guided RFCSA in clinical practice. Although magnetic resonance imaging and computed tomography are precise, they are not practical for a broad range of clinical applications. Alternatively, ultrasound is a feasible, reliable, and valid option, particularly for measuring anterior thigh muscle thickness.25,26 In parallel, RFCSA measurements have been reported to be reliable with respect to patients with fluid overload.27 In addition, recent cross-sectional studies have underscored the superior correlations between anterior thigh muscle metrics (cross-sectional area and thickness) and muscle power/strength.28,29 In addition, critical associations have been observed between the anterior thigh muscle cross-sectional area and adverse outcomes, including mobility limitation and mortality.30,31 Given that the muscles of the anterior thigh are the basis for mobility, the RFCSA may be worth evaluating in clinical practice.
Study Limitations
This study has several limitations. First, this study was a single-center observational study with a small sample size and short follow-up period. Second, muscle strength was not assessed in this study, and its relationship with muscle mass is unknown. However, in daily clinical practice, measuring muscle strength upon admission is difficult when a patient’s circulation is unstable. In fact, approximately 25% of the cohort in the present study were on a ventilator, making it impossible to measure muscle strength, such as maximum QIS and grip strength on admission. Third, changes in nutritional status, such as calorie intake during hospitalization, were not considered. Information on changes in nutritional status was not available from the electronic medical records. Changes in muscle mass reflect the effects of nutrition and other factors. If information on changes in nutritional status were available, it would not have been used as a covariate in the multivariate analysis because of multicollinearity. Finally, RFCSA is correlated with exercise capacity in patients with HF, and is a critical prognostic factor in HF. Nevertheless, exercise capacity was not assessed in the present study, leaving the precise mechanisms underlying the prognostic significance of RFCSA undetermined. Therefore, further studies are needed to clarify whether changes in skeletal muscle mass during hospitalization are associated with the prognosis of patients with AHF. Nevertheless, the present study provides data that should highlight to clinicians the need to pay attention to changes in skeletal muscle function when treating patients with AHF rather than performing a one-time assessment.
Conclusions
Changes in RFCSA during hospitalization are useful for the risk assessment of prognosis in patients with AHF. The results of this study provide evidence of the utility of assessing changes in muscle mass during the treatment of patients with AHF.
Acknowledgments
The authors thank Editage (www.editage.com) for help with English language editing.
Sources of Funding
This study did not receive any specific funding.
Disclosures
The authors declare that there are no conflicts of interest.
IRB Information
This study was approved by the Ethics Committee of Sagamihara Kyodo Hospital (No. 237).
Data Availability
Data cannot be shared publicly because of the restrictions placed by the Ethics Committee of Sagamihara Kyodo Hospital.
References
- 1.
McDonagh TA, Metra M, Adamo M, Gardner RS, Baumbach A, Böhm M, et al. 2021 ESC guidelines for the diagnosis and treatment of acute and chronic heart failure. Eur Heart J 2021; 42: 3599–3726, doi:10.1093/eurheartj/ehab368.
- 2.
Bueno H, Ross JS, Wang Y, Chen J, Vidan MT, Normand SL, et al. Trends in length of stay and short-term outcomes among Medicare patients hospitalized for heart failure, 1993–2006. JAMA 2010; 303: 2141–2147, doi:10.1001/jama.2010.748.
- 3.
Cheng RK, Cox M, Neely ML, Heidenreich PA, Bhatt DL, Eapen ZJ, et al. Outcomes in patients with heart failure with preserved, borderline, and reduced ejection fraction in the Medicare population. Am Heart J 2014; 168: 721–730, doi:10.1016/j.ahj.2014.07.008.
- 4.
Li R, Xia J, Zhang XI, Gathirua-Mwangi WG, Guo J, Li Y, et al. Associations of muscle mass and strength with all-cause mortality among US older adults. Med Sci Sports Exerc 2018; 50: 458–467, doi:10.1249/mss.0000000000001448.
- 5.
Newman AB, Kupelian V, Visser M, Simonsick EM, Goodpaster BH, Kritchevsky SB, et al. Strength, but not muscle mass, is associated with mortality in the health, aging and body composition study cohort. J Gerontol A Biol Sci Med Sci 2006; 61: 72–77, doi:10.1093/gerona/61.1.72.
- 6.
Lee ZY, Ong SP, Ng CC, Yap CSL, Engkasan JP, Barakatun-Nisak MY, et al. Association between ultrasound quadriceps muscle status with premorbid functional status and 60-day mortality in mechanically ventilated critically ill patient: A single-center prospective observational study. Clin Nutr 2021; 40: 1338–1347, doi:10.1016/j.clnu.2020.08.022.
- 7.
Matsuo K, Yoneki K, Tatsuki H, Mibu K, Furuzono K, Kobayashi K, et al. Effect of electrical muscle stimulation to reduce muscle volume loss in acute heart failure patients. Int Heart J 2022; 63: 1141–1149, doi:10.1536/ihj.22-207.
- 8.
Matsumura K, Teranaka W, Matsumoto H, Fujii K, Tsujimoto S, Otagaki M, et al. Loss of skeletal muscle mass predicts cardiac death in heart failure with a preserved ejection fraction but not heart failure with a reduced ejection fraction. ESC Heart Fail 2020; 7: 4100–4107, doi:10.1002/ehf2.13021.
- 9.
von Haehling S, Garfias Macedo T, Valentova M, Anker MS, Ebner N, Bekfani T, et al. Muscle wasting as an independent predictor of survival in patients with chronic heart failure. J Cachexia Sarcopenia Muscle 2020; 11: 1242–1249, doi:10.1002/jcsm.12603.
- 10.
Funamizu T, Nagatomo Y, Saji M, Iguchi N, Daida H, Yoshikawa T. Low muscle mass assessed by psoas muscle area is associated with clinical adverse events in elderly patients with heart failure. PLoS One 2021; 16: e0247140, doi:10.1371/journal.pone.0247140.
- 11.
McKee PA, Castelli WP, McNamara PM, Kannel WB. The natural history of congestive heart failure: The Framingham study. N Engl J Med 1971; 285: 1441–1446, doi:10.1056/nejm197112232852601.
- 12.
Charlson ME, Pompei P, Ales KL, MacKenzie CR. A new method of classifying prognostic comorbidity in longitudinal studies: Development and validation. J Chronic Dis 1987; 40: 373–383, doi:10.1016/0021-9681(87)90171-178.
- 13.
Spinar J, Jarkovsky J, Spinarova L, Mebazaa A, Gayat E, Vitovec J, et al. AHEAD score: Long-term risk classification in acute heart failure. Int J Cardiol 2016; 202: 21–26, doi:10.1016/j.ijcard.2015.08.187.
- 14.
Rubenstein LZ, Harker JO, Salvà A, Guigoz Y, Vellas B. Screening for undernutrition in geriatric practice: Developing the short-form mini-nutritional assessment (MNA-SF). J Gerontol A Biol Sci Med Sci 2001; 56: M366–M372, doi:10.1093/gerona/56.6.m366.
- 15.
Heyland DK, Day A, Clarke GJ, Hough CT, Files DC, Mourtzakis M, et al. Nutrition and Exercise in Critical Illness trial (NEXIS trial): A protocol of a multicentred, randomised controlled trial of combined cycle ergometry and amino acid supplementation commenced early during critical illness. BMJ Open 2019; 9: e027893, doi:10.1136/bmjopen-2018-027893.
- 16.
Levine B, Kalman J, Mayer L, Fillit HM, Packer M. Elevated circulating levels of tumor necrosis factor in severe chronic heart failure. N Engl J Med 1990; 323: 236–241, doi:10.1056/nejm199007263230405.
- 17.
Chokshi A, Drosatos K, Cheema FH, Ji R, Khawaja T, Yu S, et al. Ventricular assist device implantation corrects myocardial lipotoxicity, reverses insulin resistance, and normalizes cardiac metabolism in patients with advanced heart failure. Circulation 2012; 125: 2844–2853, doi:10.1161/circulationaha.111.060889.
- 18.
Zhang L, Jaswal JS, Ussher JR, Sankaralingam S, Wagg C, Zaugg M, et al. Cardiac insulin-resistance and decreased mitochondrial energy production precede the development of systolic heart failure after pressure-overload hypertrophy. Circ Heart Fail 2013; 6: 1039–1048, doi:10.1161/circheartfailure.112.000228.
- 19.
Andriopoulou M, Dimaki N, Kallistratos MS, Chamodraka E, Jahaj E, Vassiliou AG, et al. Skeletal muscle alterations and exercise intolerance in heart failure with preserved ejection fraction patients: Ultrasonography assessment of diaphragm and quadriceps. Eur J Heart Fail 2022; 24: 729–731, doi:10.1002/ejhf.2462.
- 20.
Nakano I, Hori H, Fukushima A, Yokota T, Kinugawa S, Takada S, et al. Enhanced echo intensity of skeletal muscle is associated with exercise intolerance in patients with heart failure. J Card Fail 2020; 26: 685–693, doi:10.1016/j.cardfail.2019.09.001.
- 21.
Keteyian SJ, Patel M, Kraus WE, Brawner CA, McConnell TR, Piña IL, et al. Variables measured during cardiopulmonary exercise testing as predictors of mortality in chronic systolic heart failure. J Am Coll Cardiol 2016; 67: 780–789, doi:10.1016/j.jacc.2015.11.050.
- 22.
Nakanishi M, Takaki H, Kumasaka R, Arakawa T, Noguchi T, Sugimachi M, et al. Targeting of high peak respiratory exchange ratio is safe and enhances the prognostic power of peak oxygen uptake for heart failure patients. Circ J 2014; 78: 2268–2275, doi:10.1253/circj.CJ-14-0047.
- 23.
Sato Y, Shiraishi H, Nakanishi N, Zen K, Nakamura T, Yamano T, et al. Clinical significance of rectus femoris diameter in heart failure patients. Heart Vessels 2020; 35: 672–680, doi:10.1007/s00380-019-01534-7.
- 24.
Tanaka S, Kamiya K, Hamazaki N, Matsuzawa R, Nozaki K, Nakamura T, et al. Short-term change in gait speed and clinical outcomes in older patients with acute heart failure. Circ J 2019; 83: 1860–1867, doi:10.1253/circj.CJ-19-0136.
- 25.
Nijholt W, Scafoglieri A, Jager-Wittenaar H, Hobbelen JSM, van der Schans CP. The reliability and validity of ultrasound to quantify muscles in older adults: A systematic review. J Cachexia Sarcopenia Muscle 2017; 8: 702–712, doi:10.1002/jcsm.12210.
- 26.
Berger J, Bunout D, Barrera G, de la Maza MP, Henriquez S, Leiva L, et al. Rectus femoris (RF) ultrasound for the assessment of muscle mass in older people. Arch Gerontol Geriatr 2015; 61: 33–38, doi:10.1016/j.archger.2015.03.006.
- 27.
Matsuzawa R, Yamamoto S, Suzuki Y, Imamura K, Harada M, Matsunaga A, et al. The clinical applicability of ultrasound technique for diagnosis of sarcopenia in hemodialysis patients. Clin Nutr 2021; 40: 1161–1167, doi:10.1016/j.clnu.2020.07.025.
- 28.
Kara M, Kaymak B, Ata AM, Özkal Ö, Kara Ö, Baki A, et al. STAR – Sonographic Thigh Adjustment Ratio: A golden formula for the diagnosis of sarcopenia. Am J Phys Med Rehabil 2020; 99: 902–908, doi:10.1097/phm.0000000000001439.
- 29.
Tsukasaki K, Matsui Y, Arai H, Harada A, Tomida M, Takemura M, et al. Association of muscle strength and gait speed with cross-sectional muscle area determined by mid-thigh computed tomography: A comparison with skeletal muscle as measured by dual-energy X-ray absorptiometry. J Frailty Aging 2020; 9: 82–89, doi:10.14283/jfa.2020.16.
- 30.
Santanasto AJ, Miljkovic I, Cvejkus RC, Gordon CL, Bunker CH, Patrick AL, et al. Body composition remodeling and incident mobility limitations in African Ancestry men. J Gerontol A Biol Sci Med Sci 2019; 74: 400–405, doi:10.1093/gerona/gly067.
- 31.
Santanasto AJ, Goodpaster BH, Kritchevsky SB, Miljkovic I, Satterfield S, Schwartz AV, et al. Body composition remodeling and mortality: The Health Aging and Body Composition Study. J Gerontol A Biol Sci Med Sci 2017; 72: 513–519, doi:10.1093/gerona/glw163.
